High energy scales in electronic self-energy imaged by optics
Abstract
We use a new technique to directly extract an estimate of the quasiparticle self-energy from the optical conductivity which can be easily related to both theory and angle-resolved photoemission spectroscopy (ARPES) experiments. In the high cuprate Bi-2212 we find evidence for a new high energy scale at 900 meV in addition to the two previously well known ones at roughly 50 and 400 meV. The intermediate scale at 400 meV has been recently seen in ARPES as a large kink which optics finds to be weaker and shifted. In YBCO, the three energy scales are shifted to lower energy relative to Bi-2212 and we observe the emergence of a possible fourth high energy feature at 600 meV.
pacs:
74.25.Gz,74.72.-h,74.20.MnOne of the most beautiful aspects of studying condensed matter systems is that a large number of very different types of experiments are available to probe the many-body state, and in the quest for microscopic understanding all of the various probes must concur about the features observed. This provides a stringent test of theories and further allows for the perfection of experimental technique and analysis. Consequently, if there is an opportunity to bring two different techniques closer together for the purpose of comparison, both theory and experiment will benefit and there will be a great enhancement of the ability to identify potentially fundamental and robust signatures of the underlying physics. Two powerful techniques which have been brought to bear on the problem of high superconductivity are angle-resolved photoemission spectroscopy (ARPES)campuzano ; damascelli and far-infrared optical spectroscopybasovrmp . These techniques have blossomed with the demands of this area of study resulting in unprecedented resolution and new methods for extraction and analysis of information, such as through inversion techniques.zhou ; verga ; marsiglio ; dordevic ; schachinger ; carbnat
Applying inversion techniques to the optical conductivity has resulted in the identification of a coupling of the charge carriers to a resonance mode at about 50 meV and a spin fluctuation background extending beyond 400 meV.schachinger ; carbnat ; timusk ; hwang06 ARPES, on the other hand, has mainly confirmed the low energy scale as, until recently, they were limited to presenting data for the quasiparticle dispersion curve up to about 200-300 meV in energy.kaminski ; kaminski2 ; sato ; kordyukmag ; kordyuk2 ; kim ; johnson ; lanzara ; cuk However, new advances have extended this range to greater than 1 eV and several worksgraf ; xie ; vallas06 ; graf06 ; pan06 are reporting features at high energy at about 400 meV and 800 meV, which are speculated to arise from exotic physics. Confirming the existence of these new energy scales and investigating a wide range of materials is essential to the development of these or other new ideas.
In this letter, we present complementary results obtained from optical data and demonstrate, at the same time, a new technique which allows for the direct, although approximate, extraction of the quasiparticle self-energy from the optical conductivity, which can be compared most easily with the ARPES via a dispersion-type curve. This is important because optics is a bulk probe as opposed to ARPES which is only sensitive to the surface. In addition, optical spectroscopy measures the self-energy due to correlations directly while ARPES finds, instead, the renormalized energy and the self-energy follows only once the bare dispersion is known. Using our new technique to analyze the data on Bi-2212 samples of varying doping, we can show that optics also sees features at high energy and supports some of the observations seen in ARPES, but not all. Moreover, as optical experiments are more flexible in the type of materials which can be studied, our work goes beyond Bi-2212 to examine the high energy scales in YBCO.
We begin by discussing the theoretical basis for the new analysis of optics which allows for the extraction of the quasiparticle self-energy. Within the experimental community, it has become common to analyze the complex optical conductivity for the correlated charge carriers in terms of the optical self-energy, , using an extended Drude model of the form:timusk ; basovrmp
| (1) | |||||
| (2) |
where is the plasma frequency. can be written in terms of the optical scattering rate and the optical mass renormalization by
| (3) | |||||
| (4) |
and it is routine to present quantities such as or . Despite the suggestive structure of this form, is not the quasiparticle self-energy and is not the quasiparticle scattering rate. However, these quantities do encode such information and within a set of reasonable approximations, a surprisingly simple procedure can be applied to extract from .
If we can assume, for the sake of argument, that the renormalization and scattering of charge carriers is due to some sort of frequency-dependent interaction with a bosonic spectrum which we will call in analogy to the conventional electron-phonon spectral function, then we can show thatantonclean ; antonimp ; cappelluti ; boza
| (5) | |||||
| (6) | |||||
where the electronic density of states can be energy-dependent and we have ignored the difference between the transport and quasiparticle spectral densities, and , respectively. The approximations behind these formulas and their range of validity may be found in the work of Allenallen , Shulga et al.shulga , and Sharapov and Carbottesharapov . For convenience, these equations are stated here for and for no impurity scattering. In the cuprates, we can assume the clean limit. Finite temperatures effects are easily incorporated when needed. If we define a new quantity, following the work of Carbotte et al.carbotte , which we will call the optically-derived quasiparticle self-energy,
| (7) |
then from Eqs. (5) and (6), the derivative in Eq. (7) gives exactly .
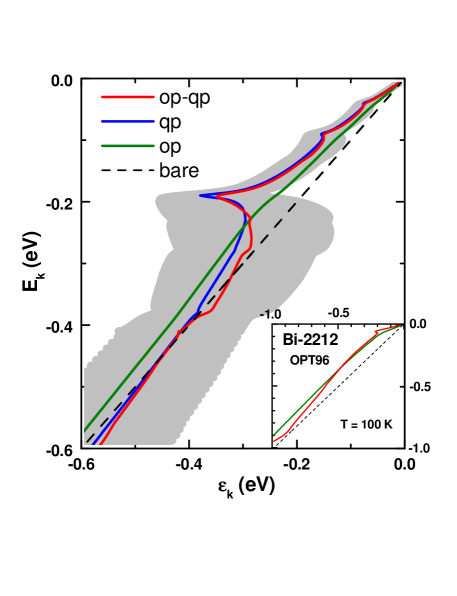
To illustrate the effectiveness of Eq. (7) to determine the exact quasiparticle self-energy, we show a model calculation in Fig. 1, where an spectrum consisting of three delta functions has been used to calculate both the exact from many-body theory and the optical conductivity in the usual Kubo approximation.antonclean ; antonimp The optical conductivity is then processed via Eqs. (3)-(4) and (7) to obtain . In the figure, we have chosen to plot the real part of in terms of a renormalized dispersion curve where schachinger03 as we wish eventually to make comparison with ARPES in the same format. The dispersion curve for shows very clearly three structures due to the three -function peaks in the at 0.04, 0.09, and 0.19 eVantonimp . However, the curve formed from is fairly featureless and does not capture any of the underlying structure of the spectral function. In addition, this calculation has included a finite band density of statesantonclean ; antonimp ; cappelluti which causes the renormalized dispersion curve to cross the bare dispersion curve (a fact that is not well-known, but is a signature of finite bands) and once again the curve from has not crossed the bare dispersion at the same energy and indeed the crossing is higher in energy by a factor of roughly two. On the other hand, the optically-derived quasiparticle self-energy gives a dispersion curve in excellent agreement with the exact one and it reproduces all of the structures at the correct energies and with the proper magnitude. Aside from a small overshoot of the curve between about 0.3 and 0.4 eV due to the derivative technique which is known to produce such characteristics just after the end of the boson spectrum, the op-qp curve also crosses the bare dispersion at the same point as the qp curve. The agreement is remarkable and similar agreement is found in the detailed comparison of the real and imaginary parts of and (not shown). The grey shading shows the broadening of the dispersion curve which occurs with and is indicated by . The inset of this figure shows the procedure of Eq. (7) applied to experimental optical data for optimally-doped Bi-2212 at timusk ; bi2212opt . Again, gives a featureless dispersion curve, but restores structures in the curve (such as the kink at meV) which can now be compared to ARPES. Fig. 1 emphasizes that it is which must be used for this purpose. A point that must be made before continuing to such a comparison is that optics is a transport property and it does not contain momentum-dependent information. Consequently, along with the assumption that , we stress that the “dispersion curves” presented here are to be viewed as momentum-averaged curves in terms of the self-energy and the only remaining momentum-dependence enters through the bare dispersion which is taken from LDA calculations.
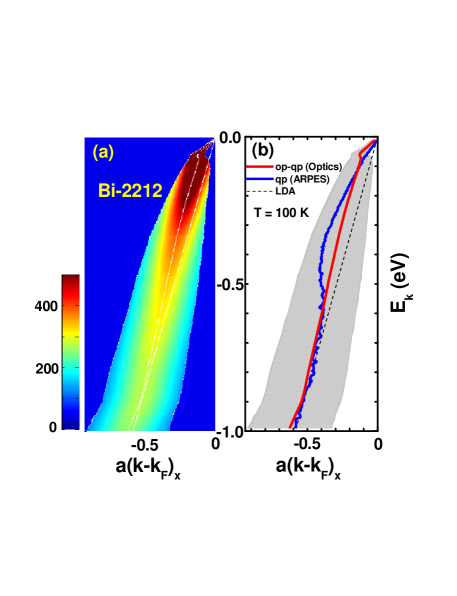
Having established the technique, we now present our new results on high energy scales in Bi-2212 and YBCO as imaged by optics. In Fig. 2, we present the analysis of the optical data for optimally-doped Bi-2212 at 100 K. The derivative needed in Eq. (7) to extract can introduce noise and we have applied smoothing techniques as is reasonable since we are interested mainly in capturing global features. For comparison with ARPES, we have presented the in the form of a dispersion curve using an LDA calculationbansil for the bare dispersion . With this information, we can form a color map of the quasiparticle spectral function to connect to the raw data as presented by ARPES. In Fig. 2b, we compare our data with that of Graf et al.graf from ARPES in the nodal direction on a similar optimally doped sample. In the ARPES, they identify three energy scales with these data at meV, eV, and eV. In our data, we can confirm a structure at eV and a much stronger kink at meV, however, we do not find evidence for a very strong feature at eV, although the does show a local maximum around 0.25 eV. The broadening that we find is within the range that is found by ARPES. Thus, we conclude that overall, we find agreement with ARPES using our analysis as shown in Fig. 2b, however, there remain some discrepancies which we will now address.
Inversionschachinger ; carbnat of optical data to recover the electron-boson spectral density of Eqs. (5) and (6) shows that the kink at meV may be attributed to a peak in which is followed by a broad spin fluctuation background extending beyond 0.4 eV (see inset of Fig. 3). This spectrum accounts for the deviations, extending up to 0.6 eV, of the op-qp data from the LDA curve seen in Fig. 2b. The renormalization found in the ARPES data, while larger than that found in the op-qp curve around 0.4 eV, is smaller below the 50 meV kink. The lack of quantitative agreement between the optics and ARPES in these two regions may reflect (i) the differences between the quasiparticle and transport spectral densities, not included in this work, (ii) the differences in k-dependence between optical data (averaged over the Fermi surface) and that of ARPES (momentum specific), and (iii) that formally the self-energy can depend on the magnitude of as well as direction, but this goes beyond the theory used here. It is clear that renormalizations are present in both experiments on a broad energy scale up to the end of the spin fluctuation spectrum ( 0.4 eV) which we take here to be the scale rather than the position of the peak in the self-energy. Furthermore, we associate the higher energy scale around 0.8-0.9 eV with the commencement of a new higher energy band (see discussion below). One of the results, strongly highlighted in some of the ARPES workvallas06 ; graf06 ; pan06 is the vertical dispersion seen in the data from to . The question arises as to whether this is due to some sort of orderinggraf ; graf06 or if it is a renormalization effect. Indeed a vertical dispersion can be obtained within standard electron-boson modelsdogan ; cappelluti with appropriate choice of parameters and in this instance, the high energy scale of this feature points to a spin-fluctuation spectrum rather than a low energy boson spectrum. Thus, we would conclude that the large kink is due to renormalization rather than something more exotic, as was also concluded by Valla et al.vallas06 .
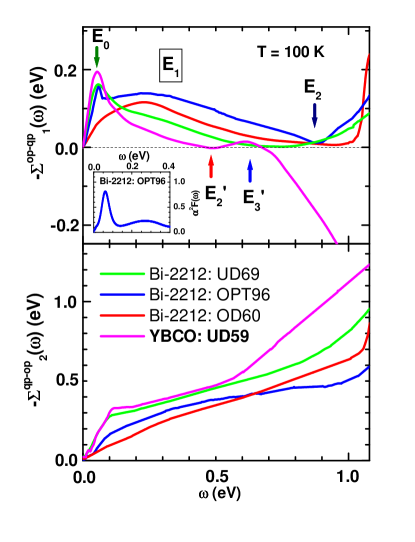
In the upper frame of Fig. 3, we show for three Bi-2212 materials: underdoped (UD69), optimally-doped (OPT96) and overdoped (OD60), and one underdoped YBCO material (UD59) orthoII , all at K in the normal state. For the Bi-2212 samples we have indicated possible features that would correlate with the , , and seen in ARPES providing possible confirmation of three similar energy scales seen universally across members of Bi-2212 family. For the YBCO sample, we also can suggest the existence of the three energy scales. While remains the same, the and scales are now shifted to lower energy relative to Bi-2212 and are labelled (not shown) and . In addition, there is a possible fourth scale eV. In the lower frame, we show for the four samples. This quantity is positive definite and shows some of the characteristic energy scales more unambiguously. In particular, we see the emergence of a new band at larger energy. In the case of a finite band, we expect the scattering rate to drop antonclean ; antonimp ; cappelluti beyond the end of the boson spectrum.
In summary, we have demonstrated a new analysis to extract the quasiparticle self-energy directly from the optical conductivity data, which will facilitate future comparisons with both ARPES and theory. In applying this method to Bi-2212 for various dopings, we find good agreement with the ARPES data in comparison with the optically-derived quasiparticle dispersion curve. While the optics data show features at both low and high energies ( meV and eV) as in ARPES, the profile of the intermediate scale eV, which has been identified as the background spin fluctuation scale, is very different in optics. Notwithstanding the lack of momentum resolution, optics provides a complementary technique to ARPES in this case because it is a bulk probe, has enhanced energy resolution, and is able to examine a wider range of materials such as the YBCO family. Indeed, we find with the YBCO data shown here that we can identify up to four energy scales, which range from low to high energies, but that overall they appear to be shifted to lower energy relative to Bi-2212. The theoretical understanding of these features remains to be more fully elucidated, but confirmation of these scales by more than one technique gives impetus to such an endeavour.
This work has been supported by the Natural Science and Engineering Council of Canada (NSERC) and the Canadian Institute for Advanced Research (CIAR).
References
- (1) C. Campuzano et al, in Physics of Conventional and Unconventional Superconductors, Edited by K. H. Bennemann and J. B. Ketterson (Springer-Verlag, Berlin, 2003) vol. 2, p. 167.
- (2) A. Damascelli et al., Rev. Mod. Phys. 75, 473 (2003).
- (3) D. N. Basov et al., 77, 721 (2005).
- (4) X.J. Zhou et al., Phys. Rev. Lett. 95, 117001 (2005).
- (5) S. Verga et al., Phys. Rev. B 67, 054503 (2003).
- (6) F. Marsiglio et al, Phys. Lett. A 245, 172 (1998).
- (7) S.V. Dordevic et al., Phys. Rev. B 71, 104529 (2005).
- (8) E. Schachinger et al., Phys. Rev. B 73, 184507 (2006).
- (9) J.P. Carbotte et al., Nature (London) 401, 354 (1999).
- (10) J. Hwang et al., Nature (London) 427, 714 (2004).
- (11) J. Hwang et al., cond-mat/0610127 (2006).
- (12) A. Kaminski et al., Phys. Rev. Lett. 86, 1070 (2001).
- (13) A. Kaminski et al., Phys. Rev. Lett. 84, 1788 (2000).
- (14) T. Sato et al., Phys. Rev. Lett. 91, 157003 (2003).
- (15) A.A. Kordyuk et al., Phys. Rev. Lett. 92, 257006 (2004).
- (16) A.A. Kordyuk et al., Phys. Rev. Lett. 97, 017002 (2006).
- (17) T.K. Kim et al., Phys. Rev. Lett. 91, 167002 (2003).
- (18) P.D. Johnson et al., Phys. Rev. Lett. 87, 177007 (2001).
- (19) A. Lanzara et al., Nature (London) 412, 510 (2001).
- (20) T. Cuk et al., Phys. Rev. Lett. 93, 117003 (2004).
- (21) J. Graf et al., cond-mat/06077319 (2006).
- (22) B.P. Xie et al., cond-mat/0607450 (2006).
- (23) T. Valla et al., cond-mat/0610249 (2006).
- (24) J. Graf et al., cond-mat/0610313 (2006).
- (25) Z.-H. Pan et al., cond-mat/0610442 (2006).
- (26) A. Knigavko et al., Phys. Rev. B 72, 035125 (2005).
- (27) A. Knigavko et al., Phys. Rev. B 73, 125114 (2006) .
- (28) E. Cappelluti et al., Phys. Rev. B 68, 224511 (2003).
- (29) B. Mitrović et al. Phys. Rev. B 20, 6749 (1984).
- (30) P.B. Allen, Phys. Rev. B 3 305 (1971).
- (31) S.V. Shulga et al, Physica C 178, 266 (1991) .
- (32) S.G. Sharapov et al, Phys. Rev. B 72, 134506 (2005) .
- (33) J.P. Carbotte et al., Phys. Rev. B 71, 054506 (2005).
- (34) E. Schachinger et al., Phys. Rev. B 67, 214508 (2003).
- (35) J. Hwang et al., cond-mat/0607653 (2006).
- (36) Hsin Lin et al., Phys. Rev. Lett. 96, 097001 (2006).
- (37) F. Dogan et al., cond-mat/0603635 (2006).
- (38) J. Hwang et al., Phys. Rev. B 73, 014508 (2006).