Ex-situ control of fine-structure splitting and excitonic binding energies in single InAs/GaAs quantum dots
Abstract
A systematic study of the impact of annealing on the electronic properties of single InAs/GaAs quantum dots (QDs) is presented. We are able to record single QD cathodoluminescence spectra and trace the evolution of one and the same QD over several steps of annealing. A systematic reduction of the excitonic fine-structure splitting is reported. In addition the binding energies of different excitonic complexes change dramatically. The results are interpreted in terms of a change of electron and hole wavefunction shape and mutual position.
Self-assembled quantum dots (QDs) are building blocks for numerous novel devices including single photon emitters and storage devices benson . It is of largest importance to tailor their opto-electronical properties for optimal device performance. Annealing can considerably alter the electronic structure of QDs young ; langbein ; tarta . Here, the first systematic study of the influence of such an annealing process on the emission characteristics of one and the same QD for two consecutive steps of annealing is presented. Excitonic binding energies and fine-structure splittings are determined.
The InAs QDs were grown by MOCVD in GaAs matrix on GaAs(001) substrates. For the QDs nominally 1.9 monolayers of InAs were deposited followed by a 540 s growth interruption. During the growth interruption the QDs undergo a ripening process potschke . Due to its long duration, most QDs gain in size leading to an ensemble peak centered at 1.06 eV. However, some small QDs remain as they represent the material reservoir for the ripening process of the larger QDs. This leads to an ultra-low QD density ( per cm2) in the 1.25-1.35 eV spectral range (Fig. 1).
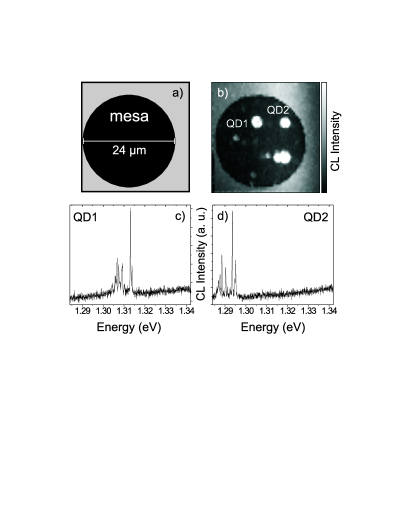
The sample was examined using a JEOL JSM 840 scanning electron microscope equipped with a cathodoluminescence setup providing temperatures as low as 6 K. The luminescence was dispersed by a 0.3 m monochromator equipped with a 1200 lines/mm grating. The light was detected with a liquid-nitrogen cooled Si charge-coupled-device camera. The minimal linewidth as given by the setup was 140 eV. Using a lineshape analysis, the energetic position of a single lines could be determined withtin an accuracy better than 20 eV.
In order to relocate the QDs after annealing, circular mesas with 24 m in diameter were etched into the sample surface (Fig. 1). The consecutive annealing steps lasted five minutes at 710 and 720 ∘C respectively, performed under As atmosphere in order to stabilize the sample surface.
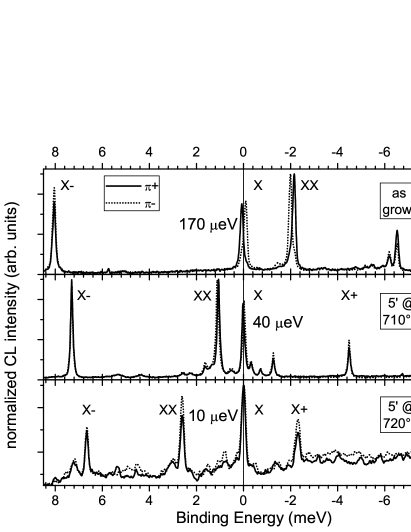
Fig. 2 shows the influence of the annealing steps on a particular QD. Neutral excitons (X), biexcitons (XX) and charged (positively (X+), negatively (X-)) excitons could be identified following Ref. rodt05 . For easier comparison the energetic position of the X line has been shifted to 0 meV. Fig. 2 shows that the XX shifts to lower energies with respect to the X line, changing its character from anti-binding (-2.1 meV) to binding (2.6 meV) with a total change in binding energy meV. Likewise, the X+ binding energy increases by 6.3 meV. The X- on the other hand shows the opposite trend becoming less binding with its binding energy decreasing by -1.3 meV. Additionally the excitonic fine-structure splitting (FSS) was recorded. For this particular dot it decreased from 170 to 10 eV, i.e. a value below our experimental accuracy. The general trend of decreasing FSS and increasing XX binding energy after annealing has also been observed by Young et al. However, they did not record the spectra of identical QDs before and after annealing young .
The binding energies of these complexes are a function of the wavefunction shape and their mutual position affecting the direct Coulomb energies and the degree of correlation. The energy contribution due to correlation foremost depends on the number of bound states and the sublevel spacing. In our case there is a trade off between the decreasing number of bound states with annealing () and the slightly decreasing sublevel spacing (). Therefore we approximate to be constant during annealing and analyze the change of binding energies in terms of the direct Coulomb integrals and their change alone:
| (1) | |||||
| (2) | |||||
| (3) |
where describes the Coulomb energy between the wavefunctions and .
The left hand values are taken from experiment. As a first approximation, the electron wavefunction does not change with annealing due to its small effective mass, leading to the additional assumption . Since the right hand side of the equation system 1-3 has rank two only, we can solve eqs. 1 and 2 and use eq. 3 as a test. Eqs. 1 and 2 yield meV and meV respectively. These values are well confirmed by eq. 3. describes the Coulomb repulsion of the spin-degenerate hole groundstates and has therefore a negative value. A positive hence is a sign of an extension of the hole groundstate wavefunction upon annealing. describes the the Coulomb attraction between electron and hole groundstate having a positive value. For the one would expect a value half as large as since the hole wavefunction increases its extent and the electron extent remains virtually unchanged. But this is only true if electron and hole preserve their mutual position and their shapes. In contrast, our results can be understood if we assume that both wavefunctions are originally oriented along orthogonal directions like and and loose this misorientation during annealing. In an elongated QD electron and hole wavefunctions are aligned into the direction of the elongation. Hence the large FSS plus the required misorientation of electron and hole wavefunction point at an interface-mediated anisotropy resulting from the lack of inversion symmetry of the underlying zinc-blende lattice. Annealing destroys the clearly defined interfaces and the confinement anisotropy vanishes. Model calculations show, that piezoelectric fields are insensitive to annealing.
In conclusion, we have recorded emission spectra of single QDs and followed their evolution under an annealing procedure. We have shown, that it is possible to alter the electronic structure of the QDs on the order of meV in a controlled manner. Our results can be understood by a change of electron and hole wavefunction shape and mutual position. We have thus demonstrated a powerful tool to tailor single QDs’ electronic properties for their use in potential applications.
This works was supported by the DFG via SfB 296 and the SANDiE Network of Excellence of the European Commision, Contract No. NMP4-CT-2004-500101.
References
- (1) e. g. O. Benson et al., Phys. Rev. Lett. 84, 2513 (2000); S. Cortez et al., Phys. Rev. Lett. 89, 207401 (2002).
- (2) R. J. Young et al., Phys. Rev. B 72, 113305 (2005).
- (3) Langbein et al., Phys. Rev. B 69, 161301(R) (2004).
- (4) A. I. Tartakovskii et al., Phys. Rev. B 70, 193303 (2004).
- (5) U. W. Pohl et al., Phys. Rev. B 72, 245332 (2005).
- (6) S. Rodt et al., Phys. Rev. B 71, 155325 (2005).