The kagome staircase compounds Ni3V2O8 and Co3V2O8 studied with implanted muons
Abstract
We present the results of muon-spin relaxation (SR) measurements on the kagome staircase compounds Ni3V2O8 and Co3V2O8. The magnetic behavior of these materials may be described in terms of two inequivalent magnetic ion sites, known as spine sites and cross-tie sites. Our SR results allow us to probe each of these sites individually, revealing the distribution of the local magnetic fields near these positions. We are able not only to confirm the magnetic structures of the various phases proposed on the basis of bulk measurements but also to give an insight into the temperature evolution of the local field distribution in each phase.
pacs:
75.50.Ee, 76.75.+i, 75.40.-s, 75.50.-yI Introduction
Geometric frustration often gives rise to highly degenerate ground state manifolds with unusual spin correlations. Small perturbations become decisive in lifting the degeneracy and may lead to the existence of rich phase diagramsmoessner . One of the most studied frustrated systems is the two-dimensional (2D) kagome lattice. This is formed from corner sharing triangles of spins with equal antiferromagnetic (AFM) interactions between nearest neighbours. The expected low temperature spin state ranges from a quantum spin liquid for the Heisenberg modelsachdev to long range magnetic order (LRO) for the classical () casehuse . Real systems approximating the kagome lattice show a variety of ground states resulting from the presence of relatively weak interactions. Notable examples include SrCr9Ga3O19 which displays a spin liquid phase and short range orderramirez ; lee , and the jarosite materials whose interlayer Dzyaloshinskii-Moriya interactions give rise to a number of commensurate magnetic structureswills .
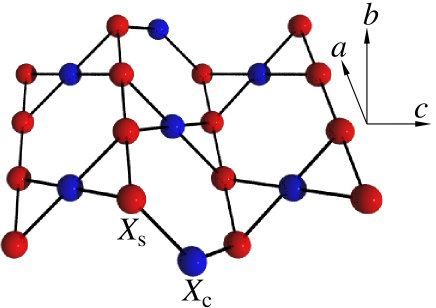
Another class of material that has been the subject of much recent research effort is V2O8 (VO), where includesrogado ; rogado2 Ni (), Co () and Cu (). This system is a further variant of the 2D kagome paradigm, which has attracted attention both for its complex magnetic phasesrogado ; lawes_mag ; kenzelmann ; chen ; szymczak ; wilson1 ; wilson2 and, in the case of =Ni, for the appearance of ferroelectricity that accompanies one of its magnetic phase transitionslawes_el ; harris , making it a further example of a multiferroic material (for a review of multiferroic behavior, see Ref.khomskii, ). The material is formed from spins arranged on buckled kagome planes (which retain the connectivity of normal kagome planes) forming so-called kagome staircases which are stacked along the crystallographic -direction. The staircase layers are shown in Fig. 1. The spins in the layers may be split into two inequivalent groups: spine spins (which lie on lines (or spines) running parallel to the -direction, where the treads meet the risers of the staircase) and cross-tie spins (which lie at the centre of the treads and risers)lawes_mag . The most frequently studied of the VO systems have been Ni3V2O8 (NVO) and Co3V2O8 (CVO). Despite these materials having identical crystal symmetry and similar structural parameters their magnetic properties are quite different. Both compounds are frustrated and it is small perturbations that relieve the frustration and therefore determine their behavior. As a result, the nature of the magnetic order of the Ni2+ spins and the Co2+ spins is different.
Although the details of the magnetic phases of NVO and CVO are complex (see below), some general observations may be made on the basis of experiment and of theoretical modelschen . The ordering in both materials involves spin components aligned, for the most part, along the -direction (i.e. parallel to the spines). The magnetic structure always involves ordering of the spine spins (and may or may not also involve ordering of the cross-tie spins). For CVO the ordering along each spine is ferromagnetic in all phases that show LRO. For NVO, a competition between nearest- and next-nearest-neighbors (due to alternating Ni-O-Ni bond angles along the staircase) causes the ordering along the spines to be incommensurate before adopting an antiferromagnetic structure at low temperatures. The magnetic ordering of the system then follows from the interaction of inter- and intralayer spines. The separation of the magnetic behavior of the spine and cross-tie spins is clearly of central importance in elucidating the magnetic properties of this system. The difference between the two materials may, in part, be attributed to the magnetocrystalline anisotropy, which is found to be far larger in CVO than in NVOszymczak .
A range of experimental techniques has been used to probe the bulk properties of VO, most notably neutron diffractionlawes_mag ; kenzelmann . However, a study of the local magnetic properties of the system has, hitherto, been lacking. In this paper we present a zero field muon-spin relaxation (ZF SR) study of NVO and CVO. In recent years, implanted muons have been successful in probing frustration related behavior in several systems from a local viewpoint, allowing new insights into the magnetic propertiesmusr1 ; musr2 ; musr3 ; musr4 ; musr5 ; musr6 ; musr7 ; musr8 . Using muons we are able to probe the spine and cross-tie magnetic sites individually, relating the observed magnetic transitions to the behavior at each magnetic site. Our measurements allow us to confirm the magnetic structures inferred on the basis of previous neutron studies, as well as to show the evolution of the internal magnetic fields of the systems as a function of temperature.
II Experimental details
Polycrystalline samples of NVO and CVO were prepared by the solid state reaction technique using high purity NiO, Co2O3 and V2O5 chemicals. Stoichiometric quantities were mixed and reacted in air at 850 ∘C for 24 h. The samples were reground and sintered (Co compound at 1050∘C, Ni compound at 950∘C) in air for 48 h. The phase purity of the polycrystalline samples was checked using x-ray powder diffraction. The final powders were isostatically pressed into rods of 10 mm diameter and length 100 mm. The rods were sintered in air at 1050 ∘C and 950 ∘C for the Co and Ni compounds respectively. Crystal growth was achieved using an optical floating zone furnace (Crystal System Inc.) at a growth speed of mm/h with the seed and feed rods counter rotating at 25 rpm in an argon/oxygen mixed gas atmosphere. For further details see Ref. balakrishnan, .
ZF SR measurements were made on mosaics of single crystals of NVO and CVO, using the GPS instrument at the Swiss Muon Source, Paul Scherrer Institute, Villigen, Switzerland. Six crystallites of typical volume 50 mm3 were aligned on silver foil such that the initial muon-spin polarization lay along the direction. The crystal facets facing the muon beam were of typical area 20 mm2 and covered approximately 80% of the area illuminated by the muon beam. In a SR experiment, spin-polarized positive muons are stopped in a target sample, where the muon usually occupies an interstitial position in the crystal. The observed property in the experiment is the time evolution of the muon spin polarization, the behavior of which depends on the local magnetic field at the muon site, and which is proportional to the positron asymmetry function steve .
III NVO
Detailed studies of NVO involving specific heat, magnetization, magnetic susceptibility and neutron diffraction measurements lawes_mag ; kenzelmann reveal a complex magnetic phase diagram which, in zero applied magnet field, is proposed to consist of five phases (See Figs. 2 and 3). We describe these below:
-
•
Commensurate (C’) phase ( K): An AFM ordered phase where the staggered magnetism is principally directed along the -direction. A weak ferromagnetic moment also exists along .
-
•
Commensurate (C) phase ( K): The difference between phases C’ and C is unclear, although we note that they are separated by a pronounced peak in the heat capacitylawes_mag ; kenzelmann at K.
-
•
Low temperature incommensurate (LTI) phase ( K): The spin structure is elliptically polarized with both spine and cross-tie spins in the - plane. In this phase ferroelectric order is also observable, with a spontaneous electrical polarization parallel to the -direction.
-
•
High temperature incommensurate (HTI) phase ( K): A further incommensurate phase dominated by a longitudinally modulated structure with spine spins mainly parallel to the -axis.
-
•
Paramagnetic (PM) phase ( K)
The phase transitions at K and K are continuous, while that at K is discontinuouslawes_mag ; kenzelmann .
Example SR spectra for NVO, measured in each of the magnetic phases, are shown in Fig. 2. In all of the phases occurring below K we observe oscillations in the asymmetry spectra. The oscillations are characteristic of a quasistatic local magnetic field at the muon site, which causes a coherent precession of the spins of those muons with a component of their spin polarization perpendicular to this local field; their presence provides strong evidence for the existence of LRO in these phases, in agreement with previous neutron diffraction measurementslawes_mag ; kenzelmann . The frequency of the oscillations is given by , where is the muon gyromagnetic ratio ( MHz T-1) and is the local field at the th muon site. In the presence of a distribution of local magnetic fields the oscillations are expected to relax. The nature of the oscillations and their relaxation differ in different regions of the phase diagram of NVO, allowing an insight into the local magnetic field distribution and its correlations in each of the phases. We describe the muon response to each phase in detail below.
III.1 C’ and C phases
Example spectra measured in the C’ and C phases are shown in Fig. 2(a) and (b). The measured spectra are found to be similar in these two phases and may be described with the same relaxation function.

The observed oscillations in these phases demonstrate the existence of a narrow distribution of the magnitudes of the static local magnetic fields at symmetry-related muon sites in the crystal, associated with LRO. These oscillations are observed at two distinct frequencies corresponding to two sets of magnetically inequivalent muon sites in the material. Fitting the oscillations requires the inclusion of constant phase offsets , which took the values and (see Eq. III.1 below).
A successful model of the measured spectra also requires the inclusion of a purely relaxing component . Irrespective of crystal orientation, the fact that the muon couples to dipole fields means that, in addition to the large magnetic field components directed perpendicular to the muon spin, there may also exist components parallel to the muon spin. These will give rise to non-oscillatory components in the SR spectra. An exponentially relaxing component will often arise due to dynamic fluctuations in the local magnetic field distribution experienced by the muon ensemblehayano .
The spectra were well described across the measured temperature range with the resulting functional form
where represents a constant background contribution from those muons that stop in the sample holder or cryostat tail. This parameter takes the constant value % in all phases of NVO. The amplitudes were found to be constant in this temperature regime, taking the values, , , %. The frequencies were found to be in a constant ratio and were fixed as such in the fitting procedure.
The results of the fitting procedure are shown in Fig. 3(a) and (b), where we see that the frequencies vary continuously across , showing a tendency to decrease with increasing temperature. We also note the suggestion of a minimum in the frequencies at around 3.5 K. The relaxation rates associated with the oscillatory components show little variation at low temperatures but increase sharply as is approached from below. The relaxation rate also shows an increase as is increased within the C phase but shows a maximum around K.
The need for nonzero phases is probably due to the difficulty in modelling the early time part of the asymmetry spectrum. More significantly, the presence of nonzero phases is often a signature of an incommensurate component of the magnetic order (see below). A small incommensurate contribution was identified from neutron diffraction measurements lawes_mag on cooling, although this was shown to be metastable and suppressed by magnetic field cycling.
No dramatic change of behavior is observed at the phase boundary of the C’ and C phases at temperature K. The C phase is only distinguished from the C’ phase in our measurements by the increased influence of fluctuations in the oscillating components (reflected by increased relaxation rates ) and by the maximum in the purely relaxing component with relaxation rate . It should be noted, however, that the increase in relaxation rates may be ascribed to the approach to the phase transition at temperature K rather than to an intrinsic difference between the C’ and C phases.

III.2 LTI phase
A sample spectrum measured in the LTI phase is shown in Fig. 2(c) where oscillations are again apparent. The oscillations in the LTI phase are no longer well modelled by simple cosinusoidal oscillations; instead, they are best described with the use of zeroth order Bessel functions . This form is expected in cases of incommensurate magnetic orderamato where the magnitude of the magnetic field at the muon site shows a single wavevector modulation . In this case the distribution of magnetic fields at the muon sites is
| (2) |
yielding a response from the muon ensemble given by
| (3) |
where . Although the spin distribution in the LTI phase has been shown to be helicallawes_mag , the magnitudes of magnetic fields at the muon sites are reasonably described by Eq.(2).
As in the C’ and C phases, two oscillatory frequencies are observed, so two Bessel function components were required to model the data. The data also included a purely relaxing exponential component to which we assign relaxation rate . The spectra in this phase were fitted to the resulting relaxation function
As in the C and C’ phases, the amplitudes were found to take constant values (in this phase , and %). The relaxation rates were allowed to vary, except for which was found to be relatively small and approximately constant in this temperature range and was fixed at a value of MHz.
The frequency (Fig. 3(a)) decreases slowly in this phase. In contrast, shows a more dramatic variation, tending to zero as in the manner of a continuous phase transition. Fitting the frequency to the phenomenological form , withnote , gives MHz, and yields an estimate for the transition temperature K. Our estimate for is in agreement with that of the previous magnetic measurementskenzelmann . The temperature evolution of the relaxation rates is shown in Fig. 3(c). We see that the relaxation rate (associated with the slowly varying frequency ) shows little variation across the measured temperature regime. Relaxation rate , on the other hand (associated with the decreasing frequency ), increases sharply as is approached from below. This sharp rise is also indicative of a phase transition, and may arise due to the onset of critical fluctuations in the order parameter.
III.3 HTI phase
An example spectrum measured in the HTI phase is shown in Fig. 2(d). The spectra in this regime consist of an oscillating component along with a significant relaxing component. Zeroth order Bessel functions are no longer effective in describing the oscillatory component of the spectra, reflecting the change in magnetic structure that occurs at . As the temperature approaches the relaxation rate becomes sufficiently small to resolve the lineshape of the relaxing component, which is found to be Gaussian. Formally, a broad distribution of local magnetic fields at the muon site leads to the occurrence of the Kubo-Toyabe (KT) functionhayano , and this is well approximated by a Gaussian function at early times with relaxation ratektnote . It is likely therefore that the relaxing component seen in this regime reflects a broad distribution of magnetic fields at one set of muon sites. The measured spectra were fitted to the relaxation function
For the fitting procedure, the amplitudes were found to take constant values , and %, while the relaxation rates took the values MHz, MHz.
The evolution of and are shown in Fig. 3(a) and (d) respectively. The frequency is seen to decrease with increasing temperature tending to zero as is approached from below. Fitting the frequency to the form , with , gives MHz, and yields an estimate for the transition temperature K. The relaxation rate is seen to decrease with increasing temperature.
III.4 PM phase
In the PM phase we no longer observe oscillations, with the measured spectra being well described by a single relaxing component,
| (6) |
This behaviour is typical of magnetic fluctuations of a paramagnetic material.
III.5 Discussion
The fact that there are two magnetically distinct Ni2+ positions in NVO is key to understanding the SR results. The observation of two distinct, temperature dependent signals in each of the phases below is consistent with the existence of two sets of magnetically inequivalent muon sites in the crystal. A clue to the origin of the two sets of muon sites is seen by noting that one difference between the Ni2+ positions in the HTI and LTI phaseskenzelmann is that and the moment on the cross-tie spins vanish as the system is warmed through the transition at . It is likely, therefore, that the component of the SR signal with amplitude arises due to magnetically similar muon sites that are strongly coupled to the cross-tie Nic sites. Since the frequency persists up to a temperature , it is probable that the component of the signal with amplitude arises due to muon sites which are strongly coupled to the spine Nis sites.
In the C’ and C phases where there is a nonzero moment at both sites we observe oscillations at two distinct frequencies. The larger of these, , corresponds to sites near the Nis spins and the smaller, , to sites near Nic spins. We again observe two frequencies in the LTI phase, but here the cross-tie frequency decreases strongly as is increased. The muon results are therefore unique in allowing us to observe the continuous decrease of the magnitude of the magnetic moments at the cross-tie sites followed by the phase transition associated with these spins that occurs at . In the HTI phase there is no quasistatic order at the cross-tie sites, so instead of oscillations we observe a Gaussian signal, characteristic of a random distribution of static magnetic fields at these positions. The order at the spine sites persists, however, leading to a coexistence of oscillations with the Gaussian relaxation. Comparing the critical parameters estimated from the behaviour of the two frequencies, we see that the transition associated with the Nic spins, with , appears more three-dimensional than that associated with the Nis spins which occurs with .
The decrease in the Gaussian relaxation rate also suggests that the second moment of the local field probed by the muons at the cross-tie sites decreases with increasing temperature in the HTI phase. Since it is unlikely that this distribution is narrowing with increasing temperature, it is likely that the magnitude of the local field distribution is decreasing. This effect has been observed before in SR studies where two magnetic subsystems have been found to coexist in a materialtom . We see therefore that in the HTI phase the local field at both the spine and cross-tie sites decreases with increasing temperature, although in this case only the spine sites are ordered.
For a polycrystalline sample the amplitude of a component in the SR spectrum should correspond to the number of muon sites coupled to the spin system giving rise to that signal. In this case we would perhaps expect to be double in all phases since there are twice as many spine sites as cross-tie sites in the XVO structure. In a single crystal sample (as was used in this study) this will not necessarily be the case since there will potentially be different components of each local field distribution directed perpendicular to the initial muon spin (giving rise to oscillations) and parallel (giving rise to a non-oscillatory amplitude). Furthermore, a change in magnetic structure will potentially alter the proportions of local magnetic field directed perpendicular and parallel to the initial muon-spin direction. This effect will be dependent on the exact position of the muon site and hence will give rise to a nontrivial variation of the amplitudes in different phases. It is therefore difficult to draw conclusions from the component amplitudes in the different phases.
IV CVO
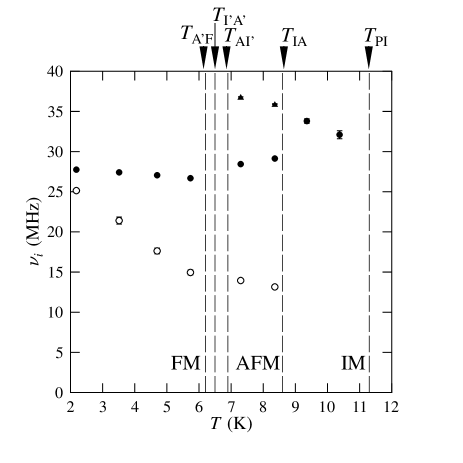
We now turn our attention to CVO, for which specific heatszymczak , magnetization szymczak ; wilson1 and neutron diffraction measurementschen ; wilson2 reveal another complex phase diagram, consisting of six phases which we describe below (see Figs. 4 and 5).
-
•
Ferromagnetic (FM) phase ( K): The magnetic structure has moments on the spine and cross-tie sites of and respectively, ordered along the -directionchen .
-
•
Antiferromagnetic (AFM’) phase ( K): A commensurate antiferromagnetic structure exists over a small temperature range, where the ordering may be described by a wavevector (0,,0), with .
-
•
Incommensurate (IM’) phase ( K): The structure is incommensurate in another similarly narrow temperature range and cannot be described by a simple sinusoidal modulation.
-
•
Commensurate antiferromagnetic phase (AFM) ( K): In this phase the ordering may be described by the wavevector (0,,0), with . The magnetic structure is characterised by ferromagnetic layers with moments on the spine and cross-tie sites of and respectively, ordered along the -direction. These alternate with antiferromagnetic layers where the spine site has an ordered moment of , while the cross-tie spins are frustrated and carry no ordered moment.
-
•
Incommensurate phase (IM) ( K): A spin density wave state with ordering wavevector (0,,0) and spin direction along the -direction. The component is seen to decrease with decreasing temperature from K to K.
-
•
Paramagnetic (PM) phase ( K).
The transition to the ferromagnetic phase at K was found to be discontinuouschen . In our study we have chosen to concentrate on the FM, AFM and IM phases and example spectra measured in each of these phases are shown in Fig. 4. In all of these phases we observe oscillations in the positron asymmetry spectra. As in the case of NVO, the nature of the oscillations varies across the phase diagram, revealing the differences in the local magnetic field distributions in each phase.

IV.1 FM phase
An example spectrum measured in the FM phase is shown in Fig. 4(a). We find that the SR signal is comprised of two oscillating components and a single relaxing component. We may therefor use Eq.(III.1) to fit the measured data in this phase, where takes the value % for CVO. The amplitudes were fixed at the values , and %, while the relaxation rates were MHz, MHz and MHz. Nonzero phases were again required to fit the oscillations, with . More significantly, a successful fit could only be achieved if was allowed to vary with temperature, following an approximately linear variation given by , where is in degrees and in K. Fits to Eq.(III.1) yield the frequencies shown in Fig. 5, where we see that remains approximately constant in this phase, while decreases as is approached from below.
IV.2 AFM phase
An example spectrum measured in the AFM phase is shown in Fig. 4(b). In this phase the spectra are described by three frequencies, suggesting three magnetically inequivalent muon sites. The spectra were fitted to the function
The amplitudes took the constant values and %, while the phases took values , and .
IV.3 IM phase
An example spectrum measured in the IM phase is shown in Fig. 4(c). In this phase only one frequency is observed, along with a purely relaxing component. The data were fit to the function
In this case the amplitudes were given by % and %, while and MHz.
IV.4 Discussion
The model for NVO of two sets of muon sites, with each strongly coupled to one of the two inequivalent magnet positions, also explains the results of our measurements on CVO.
In the FM phase, where there is an ordered moment on both spine (2.73 ) and cross tie (1.54 ) spins we obtain two oscillations, where we might expect that the larger frequency arises from those muon sites lying close to the Cos spins and the smaller from muon sites near Coc spins. The AFM phase in CVO is unusual in that all spine sites are no longer equivalent and all cross tie sites are also no longer equivalent. Instead we have alternating ferromagnetically (FM) and AFM coupled staircase layers. Within the FM coupled layers all Cos spins (1.39 ) and Coc spins (1.17 ) are aligned along the -directionchen . Within the AFM coupled layers, the spines of Cos spins (2.55 ) have ordered moments that lie parallel or antiparrallel to (alternating along the staircase in the -direction), while Coc spins have no ordered moment. This leads, from the muon’s point of view, to four inequivalent magnetic environments (since the muon is insensitive to the direction of the spine spin ordering). The disordered Coc spins within the AFM layers do not lead to a resolvable relaxation of the muon spin. It is likely that these fluctuating moments are outside the muon time window and therefore are motionally narrowed from the spectrum. The three ordered sites then give rise to the three oscillatory signals observed. From the size of the moments found from the neutron studieschen , we assign to spine sites within the FM layers, to cross-tie sites within the FM layers and the larger frequency to the spine sites within the AFM layers.
The variation of in the FM phase as the AFM phase is approached suggests that there is a continuous change in the distribution of local fields at the muon sites near Coc spins as a function of temperature. This is most likely due to the nature of the transition between the FM and AFM phases. We see a continuous decrease in the local magnetic field near the Coc spins, but it is likely that this differs in alternating layers depending on whether the Coc spin lies on a layer that becomes FM coupled or AFM coupled in the AFM phases. It follows that Coc spins on layers becoming AFM coupled will show a far larger decrease in magnitude than those on FM layers. As a result the two sites become more inequivalent with increasing temperature, changing the distribution of local magnetic fields and thus causing to vary.
In the IM phase, the magnetic structure is incommensurate and described by (0, , 0), with for all spins. As a result, only one precession frequency is observed in our measurements. Since the two subsets of muon site are unlikely to lie an equal distance from a Cos spin or a Coc spin the contributions from them in an incommensurate structure will be different. The resulting distribution of magnetic fields at the muon site will be more complicated than that considered in section III.2 and so we should not expect a signal that could be well described by a zero order Bessel function. This does not appear to be the case in the LTI phase of NVO, where the order of the Nis and Nic spins gives rise to independent components in the SR spectra.
From our measurements CVO appears to be a less clear case than NVO and it is possible that the situation may be more complicated than is considered here. Further work is required to elucidate this system further.
V Conclusions
We have carried out a detailed study of the kagome staircase compounds V2O8 (Ni and Co) using implanted muons. Two sets of muon sites occur in each compound, one set near the spine spins and one near the cross-tie spins, allowing us to probe the two spin environments separately. Our results lend additional experimental support to the proposed models of magnetic structure for both NVO and CVO and, in addition, allow us to follow the temperature evolution of the local field distribution across the magnetic phase diagrams. In the case of NVO the continuous phase transitions are associated with a continuous decrease in one of the two subsets of spins. The transition at , where both maintain a nonzero value, is discontinuous and is manifested in the spin dynamics of the local magnetic fields. In the HTI phase, the local field at both the spine and cross-tie sites decreases with increasing temperature, although in this case only the spine-site spins are ordered. For CVO the evolution of the separate subsets of spins is more complex but provides additional experimental evidence for the magnetic transitions deduced from previous studies.
Acknowledgements.
Part of this work was carried out at the Swiss Muon Source, Paul Scherrer Institute, Villigen, Switzerland. We thank Alex Amato for technical assistance. This work is supported by the EPSRC. T.L. acknowledges support from the Royal Commission for the Exhibition of 1851.References
- (1) R. Moessner, Can. J. Phys. 79 1283 (2001); A.P. Ramirez, Annu. Rev. Mater. Sci. 24 453 (1994).
- (2) S. Sachdev, Phys. Rev. B 45, 12377 (1992).
- (3) D.A. Huse and A.D. Rutenberg, Phys. Rev. B 45, 7536 (1992).
- (4) A.P. Ramirez, G.P. Espinosa and A.S. Cooper, Phys. Rev. Lett. 64 2070, (1990).
- (5) S.-H. Lee, C. Broholm, G. Aeppli, T.G. Perring, B. Hessen and A. Taylor, Phys. Rev. Lett. 76, 4424 (1996).
- (6) A. S. Wills, Can. J. Phys. 79, 1501 (2001).
- (7) N. Rogado, G. Lawes, D.A. Huse, A.P. Ramirez and R.J. Cava, Solid State Commun. 124, 229 (2002).
- (8) N. Rogado, M.K. Haas, G. Lawes, D.A. Huse, A.P. Ramirez and R.J. Cava, J. Phys. Condens. Matter 15, 907 (2003).
- (9) G. Lawes, M. Kenzelmann, N. Rogado, K.H. Kim, G.A. Jorge, R.J. Cava, A. Aharony, O. Entin-Wohlman, A.B. Harris, T. Yildirim, Q.Z. Huang, S. Park, C. Broholm and A.P. Ramirez, Phys. Rev. Lett. 93, 247201 (2004).
- (10) M. Kenzelmann, A.B. Harris, A. Aharony, O. Entin-Wohlman, T. Yildirim, Q. Huang, S. Park, G. Lawes, C. Broholm, N. Rogado, R.J. Cava, K.H. Kim, G. Jorge and A.P. Ramirez, Phys. Rev. B 74, 14429 (2006).
- (11) R. Szymczak, M. Baran, R. Diduszko, J. Fink-Finowicki, M. Gutowska, A. Szewczyk and H. Szymczak, Phys. Rev. B 73, 94425 (2006).
- (12) Y. Chen, J.W. Lynn, Q. Huang, F.M. Woodward, T. Yildirim, G. Lawes, A.P. Ramirez, N. Rogado, R.J. Cava, A. Aharony, O. Entin-Wohlman and A.B. Harris, Phys. Rev. B, 74, 14430 (2006).
- (13) N.R. Wilson, O.A. Petrenko and G. Balakrishnan, arXiv:cond-mat/0610123
- (14) N.R. Wilson, O.A. Petrenko and G. Balakrishnan, arXiv:cond-mat/0610098
- (15) G. Lawes, A.B. Harris, T. Kimura, N. Rogado, R.J. Cava, A. Aharony, O. Entin-Wohlman, T. Yildrim, M. Kenzelmann, C. Broholm and A.P. Ramirez, Phys. Rev. Lett., 95, 87205 (2005).
- (16) A.B. Harris, T. Yildirim, A. Aharony and O. Entin-Wohlman, Phys. Rev. B, 73, 184433 (2006).
- (17) D.I. Khomskii, J. Mag. Mag. Mater. 306 1 (2006).
- (18) F. Bert, P. Mendels, A. Olariu, N. Blanchard, G. Collin, A. Amato, C. Baines and A. D. Hillier, Phys. Rev. Lett., 97 117203 (2006).
- (19) P. Dalmas de Réotier, A. Yaouanc, L. Keller, A. Cervellino, B. Roessli, C. Baines, A. Forget, C. Vaju, P.C.M. Gubbens, A. Amato and P.J.C. King, Phys. Rev. Lett., 96, 127202 (2006).
- (20) X. G. Zheng, H. Kubozono, K. Nishiyama, W. Higemoto, T. Kawae, A. Koda and C. N. Xu, Phys. Rev. Lett., 95, 057201, (2005).
- (21) A. Yaouanc, P. Dalmas de Réotier, V. Glazkov, C. Marin, P. Bonville, J.A. Hodges, P.C.M. Gubbens, S. Sakarya and C. Baines, Phys. Rev. Lett., 95, 047203 (2005).
- (22) E. Sagi, O. Ofer, A. Keren and J. S. Gardner, Phys. Rev. Lett., 94, 237202 (2005).
- (23) D. Bono, P. Mendels, G. Collin, N. Blanchard, F. Bert, A. Amato, C. Baines, and A.D. Hillier, Phys. Rev. Lett., 93, 187201 (2004).
- (24) A. Fukaya, Y. Fudamoto, I.M. Gat, T. Ito, M.I. Larkin, A.T. Savici, Y.J. Uemura, P.P. Kyriakou, G.M. Luke, M.T. Rovers, K.M. Kojima, A. Keren, M. Hanawa, and Z. Hiroi, Phys. Rev. Lett., 91, 207603 (2003).
- (25) P. Dalmas de Réotier, A. Yaouanc, P.C.M. Gubbens, C.T. Kaiser, C. Baines, and P.J.C. King, Phys. Rev. Lett., 91, 167201 (2003).
- (26) G. Balakrishnan, O.A. Petrenko, M.R. Lees and D.McK. Paul, J. Phys. Condens. Matter 16, L347 (2004).
- (27) S.J. Blundell, Contemp. Phys. 40, 175 (1999).
- (28) R.S. Hayano, Y. J. Uemura, J. Imazato, N. Nishida, T. Yamazaki and R. Kubo, Phys. Rev. B 20, 850 (1979).
- (29) A. Amato, Rev. Mod. Phys. 69, 1119 (1997).
- (30) The parameter models the low temperature behavior of the frequency evolution. As this phase does not persist down to we are unable to determine this parameter from the measured data. The choice of (usually chosen to describe the influence of antiferromagnetic magnons at low temperatures) was found to provide a satisfactory description of the data in both LTI and HTI phases, although other parameterizations are possible.
- (31) The recovery of asymmetry at late times, characteristic of the KT function, is often lost due to the presence of slow dynamics in the local field distribution. As a result, the observed signal is often only the early time part of the KT function, which is well described by a Gaussian function.
- (32) T. Lancaster, S. J. Blundell, D. Prabhakaran, P.J. Baker, W. Hayes and F. L. Pratt, Phys. Rev. B 73, 184436 (2006).