Magnetism in Geometrically Frustrated YMnO3 Under Hydrostatic Pressure Studied with Implanted Muons
Abstract
The ferroelectromagnet YMnO3 consists of weakly coupled triangular layers of spins. Below K muon-spin relaxation data show two oscillatory relaxing signals due to magnetic order, with no purely relaxing signals resolvable (which would require different coexisting spin distributions). The transition temperature increases with applied hydrostatic pressure, even though the ordered moment decreases. These results suggest that pressure increases both the exchange coupling between the layers and the frustration within the layers.
pacs:
75.50.Ee, 76.75.+i, 75.40.Cx, 75.47.LxThe hexagonal MnO3 manganites yakel (=Ho, Er, Tm, Yb, Lu, Y or Sc) are a class of magnetically ordered materials that also possess ferroelectric properties and some degree of magnetoelectric coupling, suggesting that an understanding of the magnetism may allow manipulation of the electric polarization with possible device applications eerenstein . Moreover, these compounds are layered and exhibit geometric frustration within their layers, offering the possibility of studying the effect of competing interactions in low-dimensional systems moessner .
YMnO3, an insulator which undergoes a ferroelectric transition at K frohlich , is the most intensively studied of the MnO3 series. The magnetic system is based on a frustrated architecture, with Mn3+ () ions forming a two-dimensional (2D) corner-sharing triangular network. Studies of magnetic susceptibility katsufuji confirm the frustrated nature of the system, with a large ratio of Weiss temperature ( K) to antiferromagnetic (AFM) ordering temperature ( K). Neutron diffraction studies munoz ; brown have found that below , the Mn3+ spins lie in the plane and adopt a 120∘ structure, with a Mn moment of 2.9–3.1 at 1.7 K. This is below the expected value of 4, due to fluctuations associated with either the frustration or the low dimensionality. Heat capacity measurements tomuta ; katsufuji suggested incomplete ordering of the Mn spins below and elastic and inelastic neutron scattering (INS) measurements park found strong diffuse scattering persisting across ; this was taken as evidence for a spin liquid phase which coexists with the ordered phase below . However, it has been claimed that by taking low energy Einstein modes into account, heat capacity data may be consistent with conventional AFM ordering tachibana . Other INS studies sato ; roessli have found evidence for coexisting three-dimensional (3D) and 2D fluctuations. More recent neutron studies janoschek ; kozlenko show that the ordered moment decreases with increasing hydrostatic pressure. This observation was explained in terms of a pressure-induced change in volume fraction of ordered and spin liquid components of the material kozlenko .
In this paper we present the results of muon-spin relaxation steve (SR) measurements made on YMnO3 at ambient pressure and as a function of hydrostatic pressure up to kbar. Muons are a sensitive local probe of the spin distributions in a magnetic material and have proven particularly useful in probing frustration related effects frust ; however, measurements made under pressure have been less common. Strikingly, we show that increases with increasing , even though the magnetic moment decreases. This provides, as we shall show, an insight into the role of the finely balanced interactions in this system.

Zero-field (ZF) SR measurements time were made on a single crystal sample of YMnO3 using the GPS instrument at the Swiss Muon Source (SS) and on the MuSR instrument at the ISIS facility. The muon spin was directed along the crystallographic -axis of the sample. Transverse field (TF) SR measurements were made on a powder sample of YMnO3 under hydrostatic pressure using high energy incident muons on the E1 decay muon beam line at SS. For these measurements, the sample was packed into a cylinder approximately 7 mm in diameter and 18 mm in length which was mounted in a Cu-Be25 piston cylinder pressure-cell with Daphne oil used as the pressure medium. The pressure was measured by monitoring the superconducting transition temperature of an indium wire located in the sample space samples .
Example ZF SR spectra at ambient pressure (measured at SS) are shown in Fig. 1. Below we observe oscillations in the time dependence of the muon polarization (the “asymmetry” steve ) characteristic of a quasi-static local magnetic field at the muon stopping site. This local field causes a coherent precession of the spins of those muons with a component of their spin polarization perpendicular to this local field. The frequency of the oscillations is given by , where is the muon gyromagnetic ratio ( MHz T-1) and is the average magnitude of the local magnetic field at the th muon site. Any fluctuation in magnitude of these fields will result in a relaxation of the signal, described by relaxation rates . Two separate frequencies were identified in the low temperature spectra, corresponding to two magnetically inequivalent muon stopping sites in the material. The larger frequency is found to have a small relaxation rate while the smaller frequency is associated with a relaxation rate which is an order of magnitude larger. The spectra were found to be well fitted using only oscillatory components. In the ordered phase of YMnO3 the Mn3+ moments adopt the 120∘ structure, where the ordered Mn moments lie within the - plane munoz . Although the initial muon polarization is directed parallel to the -direction, the fact that the muon couples to dipole fields means that, in addition to the magnetic field components directed perpendicular to the muon spin, there may also exist components parallel to the muon spin. In our measurements these components only give rise to a constant background offset.
To follow the temperature evolution of the observed features the SS spectra below were fitted to the functional form
| (1) |
where represents a constant background contribution, including the signal from those muons that stop in the silver sample holder or cryostat tails. Nonzero phases were required to fit the observed oscillations because of the difficulty in resolving features at early times in the spectra due, at least in part, to the fast initial depolarization feature. To give the best fit across the entire temperature range we fixed and .
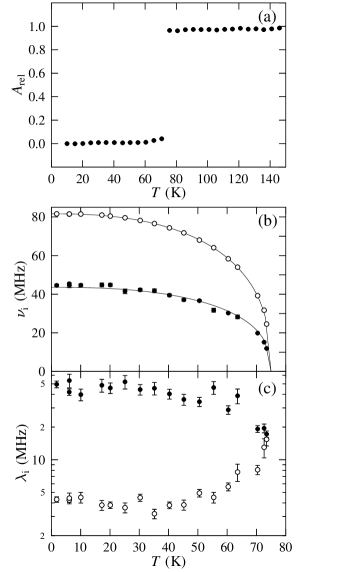
We are unable to resolve a relaxing signal due to any coexisting spin distribution such as the spin liquid phase suggested to persist into the ordered phase park . Our muon data are straightforwardly accounted for by a model assuming conventional long range magnetic order throughout the bulk of the sample. The full muon asymmetry is observed above and relaxes exponentially with a single relaxation rate, as expected for a conventional paramagnetic state. Below we observe an oscillatory signal with only weak relaxation, as expected for a well-defined magnetically ordered state. Thus we find no evidence for any static magnetic inhomogeneities in our sample, nor any evidence for coexisting ordered and disordered volume fractions. Furthermore, simulations of the internal field distribution expected from “droplets” of spin liquid dispersed in an antiferromagnetic medium predict a sizeable slowly relaxing fraction, inconsistent with our data. This effectively rules out a model in which long range order and a disordered spin liquid somehow coexist in different regions of the sample. Thus the diffuse scattering observed in neutron experiments park (which has been proposed to arise from a spin liquid state) results not from phase separated regions but more likely from high frequency fluctuations which are motionally narrowed on the muon timescale and which do not affect the magnetic ground state of the system. Our data do show a small missing fraction of relaxing asymmetry (approximately 10% of the total signal) corresponding to muons which are depolarized within 1 ns of implantation (not resolvable in our measurements) but this feature only appears below , unlike the diffuse scattering which persists across the transition park .
Complementary data were measured over a longer time window at the ISIS facility, where the limited time resolution does not allow us to resolve oscillations. Instead, we see a sharp decrease in the relaxing amplitude as the material is cooled through . This is because the local field in the ordered state will strongly depolarize the muon-spin if local field components are perpendicular to the initial muon-spin polarization (or have no effect on it if local field components are parallel to the initial muon-spin polarization), removing the relaxing asymmetry from the spectrum. These data (Fig. 2(a)) show that the relaxing amplitude does not vary with temperature apart from at , showing that there is no temperature variation in the volume fractions due to the ordered magnetic state (for ) or paramagnetic state (). Moreover, only a weak, temperature independent relaxation ( MHz) is observed in the ISIS data below , which is well within the ordinarily expected background contribution, confirming that no purely relaxing component is needed in Eq. (1).
Fig 2(b) shows that and can be fitted by from which we estimate K, and , consistent with 3D Heisenberg or 3D behaviour, as found in specific heat studies tachibana . Our determination of allows us to attempt to identify the muon sites in YMnO3. Dipole fields were calculated in a sphere containing Mn ions with moments of arranged in the structure. The positive muon’s position is usually in the vicinity of electronegative O2- ions brewer . Candidate muon sites giving rise to the higher oscillation frequency are found to be separated from an O(4) oxygen by 1 Å along the -direction. This gives sites at coordinates (1/3, 2/3, ) and (2/3, 1/3, ), where and . Several candidate sites for the lower frequency are found close to the planes of triangularly arranged O(1) and O(2) atoms. One possibility is for the sites to lie between oxygens, with the sites forming triangles centred again on the (1/3, 2/3, ) and (1/3, 2/3, ) positions, where now and .
The division of the muon sites into a set lying close to the Mn planes and a set between these planes may explain the difference in the observed relaxation rates. The relaxation rates are expected to vary as , where is the second moment of the local magnetic field distribution and is its fluctuation time. Sites giving rise to the frequency lie close to the Mn planes in well defined positions such that is small. We also expect muons at these sites to be sensitive to both in-plane (2D) and out-of-plane (3D) magnetic fluctuations. Relaxation rate increases as is approached from below (Fig. 2(c)) because increases due to the onset of critical fluctuations close to the phase transition. Sites associated with frequency lie between the Mn planes in several positions where there is some variation of the dipole fields around 40 MHz and consequently a large value of . These will be less sensitive to 2D fluctuations than those lying close to the planes, reducing the influence of any variation in . The temperature evolution of (Fig. 2(c)) is now dominated by the magnitude of , which scales with the size of the local field. Relaxation rate therefore decreases as the magnetic transition is approached from below.
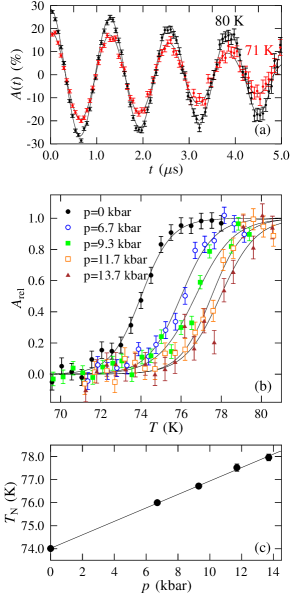
In contrast to the ZF data measured at ambient pressure at SS, it is not possible to resolve precession frequencies in SS ZF data measured under hydrostatic pressure. This is because the signal from the sample amounts to only 20% of the total measured spectrum from the pressure cell and is strongly depolarized. To observe the magnetic transition, it was necessary to follow the amplitude of the muon precession in a transverse field of mT (Fig. 3(a)) and fit the data to the functional form , where and are found to be independent of pressure, is a relaxation rate and is the normalized amplitude. The temperature dependence of characterizes the magnetic transition and is shown in Fig. 3(b) for several applied pressures. The pressure independence of and are inconsistent with an earlier speculation kozlenko that there is a change in volume fraction between spatially separated spin-liquid and AFM states when the pressure is varied. To extract the transition temperature we use the phenomenological form where is a parameter describing the “width” of the transition. At all pressures the parameter remained practically unchanged at K-1, while shows a linear increase with pressure as shown in Fig. 3(c). A straight line fit yields , where is the pressure in kbar. Our value for Kkbar-1 is in excess of that predicted by the “10/3” law bloch , (where is the bulk modulus), which holds for many oxides and garnets. Using Mbar posadas yields an estimate Kkbar-1, which is approximately half the measured value. This strong pressure dependence of demonstrates the sensitivity of to pressure-induced small changes in intralayer and interlayer coupling (see e.g. Ref. lynn, ).
The increase of with pressure in YMnO3 is surprising given that previous studies kozlenko ; janoschek have shown that the magnitude of the ordered moment decreases with applied pressure, implying an increase in the spin fluctuations that reduce the value of the magnetic moment found at ambient pressure. It is plausible that the application of hydrostatic pressure to the polycrystalline material has two effects. The first is on the structure of the triangular MnO planes as shown by neutron measurements kozlenko . At ambient pressures the Mn-O(3)-Mn and Mn-O(4)-Mn bond angles and length differ slightly. This relieves the magnetic frustration to an extent. The neutron diffraction measurements show that upon the application of pressure the Mn-O(3)-Mn and Mn-O(4)-Mn bond angles and lengths approach each other. These effects act to make the MnO planes more perfect realisations of a triangular lattice, causing the exchange coupling along the triangular bonds to become more similar as pressure is increased. This increased frustration has been proposed as an explanation for the reduction in magnetic moment kozlenko ; janoschek . The second effect is an increase in both and , which have an exponentially sensitive dependence on bond distance, making the relative effect on larger. INS measurements at ambient pressure show that sato , which is consistent with ( meV park ; sato ). Pressure will therefore increase and hence . It is clear that in order for this dual effect to occur there exists a delicate balance of competing interactions in this system.
This work was carried out at SS, Paul Scherrer Institut, Villigen CH and at the ISIS facility, Rutherford Appleton Laboratory, UK. We thank Hubertus Luetkens for technical assistance and EPSRC (UK) for financial support. T.L. thanks the Royal Commission for the Exhibition of 1851 for support.
References
- (1) H. Yakel et al., Acta Crystallogr. 16, 413 (1994).
- (2) W. Eerenstein et al., Nature 442, 759 (2006).
- (3) R. Moessner, Can. J. Phys. 79 1283 (2001);
- (4) D. Fröhlich et al., Phys. Rev. Lett. 81 3239 (1998).
- (5) T. Katsufuji et al., Phys. Rev. B, 64 104419 (2001).
- (6) A. Muñoz et al., Phys. Rev. B 62, 9498 (2000).
- (7) P.J. Brown and T Chatterji, J. Phys.: Condens. Matter 18 10085 (2006).
- (8) D.G. Tomuta et al., J. Phys.: Condens. Mater., 13 4543 (2001).
- (9) J. Park et al., Phys. Rev. B 68, 104426 (2003).
- (10) M. Tachibana et al., Phys. Rev. B 72 64434 (2005).
- (11) T.J. Sato et al., Phys. Rev. B, 68 14432 (2003).
- (12) B. Roessli et al., JETP Letters 81, 351 (2005).
- (13) D.P. Kozlenko et al., JETP Letters 82, 193 (2005).
- (14) M. Janoschek, et al., J. Phys. Condens. Matter 17, L425 (2005).
- (15) S.J. Blundell, Contemp. Phys., 40, 175 (1999).
- (16) F. Bert et al., Phys. Rev. Lett., 97 117203 (2006); P. Dalmas de Réotier, et al. Phys. Rev. Lett., 96, 127202 (2006); X. G. Zheng, et al. Phys. Rev. Lett., 95, 057201, (2005).
- (17) Data were measured in 8192 bins, each of width 1.25 ns.
- (18) Samples were produced via a solid state reaction. Stoichiometric mixtures of Y2O3 and MnO2 were ground together and calcined in air. For the polycrystalline material this process lasted 70 hours at C with several intermediate grindings. The single crystal material was pressed into a rod under 60 MPa hydrostatic pressure and crystals were grown in an optical floating zone furnace (Crystal System Inc.) at a growth speed of 5 mm/hour, with the seed and feed rods counter rotating at 25 rpm. Purity was confirmed with X-ray diffraction.
- (19) E. Holzschuh et al, Phys. Rev. B 27, 5294 (1983).
- (20) D. Bloch, J. Phys. Chem. Solids 27, 881 (1966).
- (21) A. Posadas et al., Appl. Phys. Lett. 87, 171915 (2005).
- (22) J.W. Lynn et al, Phys. Rev. B 40, 5172 (1989).