Electronic structure of Pr0.67Ca0.33MnO3 near the Fermi level studied by ultraviolet photoelectron and x-ray absorption spectroscopy
Abstract
We have investigated the temperature-dependent changes in the near-F occupied and unoccupied states of Pr0.67Ca0.33MnO3 which shows the presence of ferromagnetic and antiferromagnetic phases. The temperature-dependent changes in the charge and orbital degrees of freedom and associated changes in the Mn 3 - O 2 hybridization result in varied O 2 contributions to the valence band. A quantitative estimate of the charge transfer energy (CT) shows a larger value compared to the earlier reported estimates. The charge localization causing the large CT is discussed in terms of different models including the electronic phase separation.
pacs:
79.60.-i, 75.47.Gk, 78.70.Dm, 71.20. -bI INTRODUCTION
Recently, a lot of attention have been focused on the charge-ordered compositions of Pr1-xCaxMnO3 due to their importance as possible prototypes for the electronic phase separation (PS) models deac ; fisher ; kajimoto ; nagapriya ; moreo1 ; moreo2 ; yunoki ; sarma1 ; radaelli proposed to explain the phenomenon of colossal magnetoresistance (CMR). The PS models are qualitatively different from the double-exchange model zener ; anderson ; gennes or those based on strong Jahn-Teller polarons millis1 ; millis2 . According to the PS model the ground state of CMR materials is comprised of coexisting nanosize clusters of metallic ferromagnetic and insulating antiferromagnetic nature moreo2 . The insulator-metal transition in this scenario is through current percolation. Though there have been a number of experimental studies showing the existence of phase separation, their size varies from nano- to mesoscopic scales sarma1 ; radaelli . Radaelli et al. have shown the origin of mesoscopic phase separation to be the intergranular strain radaelli rather than the electronic nature as in PS models. Nanosized stripes of a ferromagnetic phase simon were reported in Pr0.67Ca0.33MnO3. This compound also attracted much attention earlier due to the existence of a nearly degenerate ferromagnetic metallic state and a charge-ordered antiferromagnetic insulating state with a field-induced phase transition possible between them miyano . With slight variations in the Ca doping the Pr1-xCaxMnO3 system turns ferromagnetic (=0.2) or antiferromagnetic (=0.4) at low temperatures wollam ; simon . The composition =0.33 shows a coexistence of ferromagnetic and antiferromagnetic phases jirak . This makes the charge- orbital-ordered Pr0.67Ca0.33MnO3 a prototype for the PS scenario.
One of the requisites for the existence of an electronic phase separation in manganites is a strong-coupling interaction affecting the hopping of the itinerant g electrons. The PS is expected to occur moreo1 when H/ 1, where H is the Hund’s coupling contribution between the localized 2g and the g electrons and is the hopping amplitude of the eg electrons. The PS also favors a strong electron-phonon coupling, like the influence of a strong Jahn-Teller (JT) polaron arising from the 2 and 3 JT modes. Essentially, one expects a strong localization of charge carriers to accompany the electronic separation of phases. Apart from charge, the orbital degrees of freedom also play an important role in this scenario moreo1 . The itinerant electron hopping term is strongly influenced by the symmetry of the orbitals ( and ) hybridized with the O 2 orbitals of the MnO6 octahedra. In comparison with the most popular CMR material La1-xSrxMnO3, the charge-ordered Pr system has an inherently reduced g bandwidth due to the smaller ionic radius of Pr, which also enhances the tendency for carrier localization. All these charge and orbital interactions are reflected in the near-F electronic structure of these materials and could be probed using electron spectroscopic techniques. Valence band photoemission and O x-ray absorption are two such proven tools sensitive to the changes in the low-energy states crucial to these interactions. Although, there are many reports on the near-F electronic structure of other CMR compounds using these techniques sarma2 ; park1 ; park2 ; saitoh1 ; saitoh2 ; pal ; dessau1 ; dessau2 ; mannella ; toulemonde only a few studies have been reported on their charge-ordered compositions sarma1 ; park3 . One of the key energy terms these spectroscopies could show earlier was the charge transfer energy CT which is intimately related to the electron-electron and electron-lattice interactions park1 .
In this study we have used ultraviolet photoelectron spectroscopy and x-ray absorption spectroscopy (XAS) in order to probe the electronic structure of the occupied and unoccupied states on a well-characterized, high-quality single crystal of Pr0.67Ca0.33MnO3. Another part of this single crystal had earlier been used for a detailed neutron scattering experiment that indicated the possible existence of a phase separation of ferromagnetic and antiferromagnetic stripes simon . In the present study we have analyzed the temperature-dependent changes in the near-F electron energy states from the perspective of a phase separation.
II EXPERIMENT
The single-crystal sample of Pr0.67Ca0.33MnO3 was grown by the floating zone method in a mirror furnace. The compositional homogeneity of the crystal was confirmed using energy-dispersive spectroscopic analysis. Magnetization and transport measurements on this crystal showed the transition temperatures c and N to be 100 and 110 K, respectively. Details of the sample preparation, magnetization, and transport measurements and structural studies are published elsewhere simon ; silvina . Angle-integrated ultraviolet photoemission measurements were performed using an Omicron -metal UHV system equipped with a high-intensity vacuum-ultraviolet source (HIS 13) and a hemispherical electron energy analyzer (EA 125 HR). At the He (21.2 eV) line, the photon flux was of the order of 1016 photons/s/sr with a beam spot of 2.5 mm diameter. Fermi energies for all measurements were calibrated using a freshly evaporated Ag film on a sample holder. The total energy resolution, estimated from the width of the Fermi edge, was about 80 meV. The single-crystalline samples were repeatedly scraped using a diamond file inside the chamber with a base vacuum of 1.0 10-10 mbar. Scraping was repeated until negligible intensity was found for the bump around 9.5 eV, which is a signature of surface contamination sarma2 . For the temperature-dependent measurements, the sample was cooled by pumping liquid nitrogen through the sample manipulator fitted with a cryostat. Sample temperatures were measured using a silicon diode sensor touching the bottom of the sample holder. XAS measurements were performed using the BEAR (Ref. 31) and BACH (Ref. 32) beamlines associated with ELETTRA at Trieste, Italy. At the BEAR beamline we used monochromatized radiation from a bending magnet in order to record the O edge spectra at room temperature and 150 K in fluorescence detection mode on a freshly scraped surface of the single crystal. The energy resolution was around 0.2 eV in the case of these two spectra. The O edge spectra at 95 K was recorded at the BACH beamline, using the total electron yield mode. Before the measurements, the sample surface was scraped inside the UHV chamber ( 1.0 10-10 mbar) using a diamond file. At this beamline we used radiation from an undulator, monochromatized using a spherical grating. The resolution at the O edge for this measurement was better than 0.1 eV.
III RESULTS AND DISCUSSION
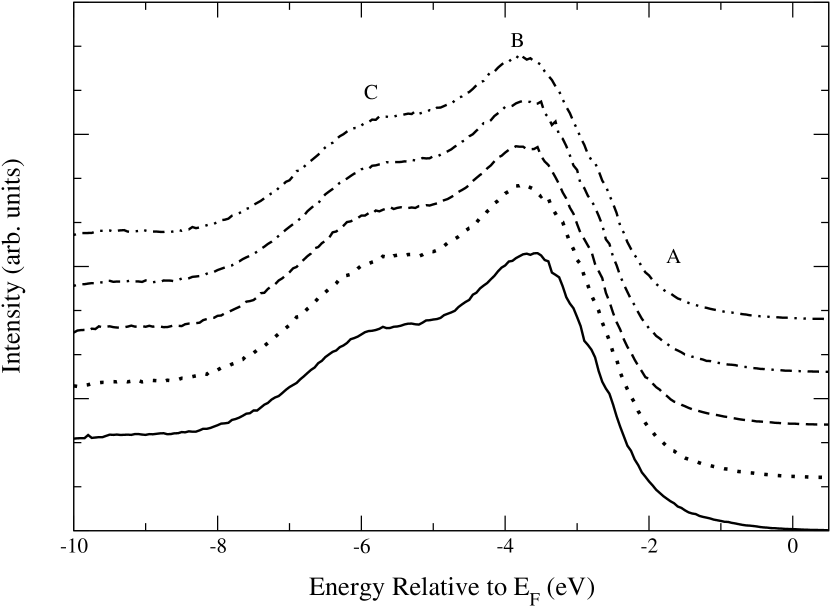
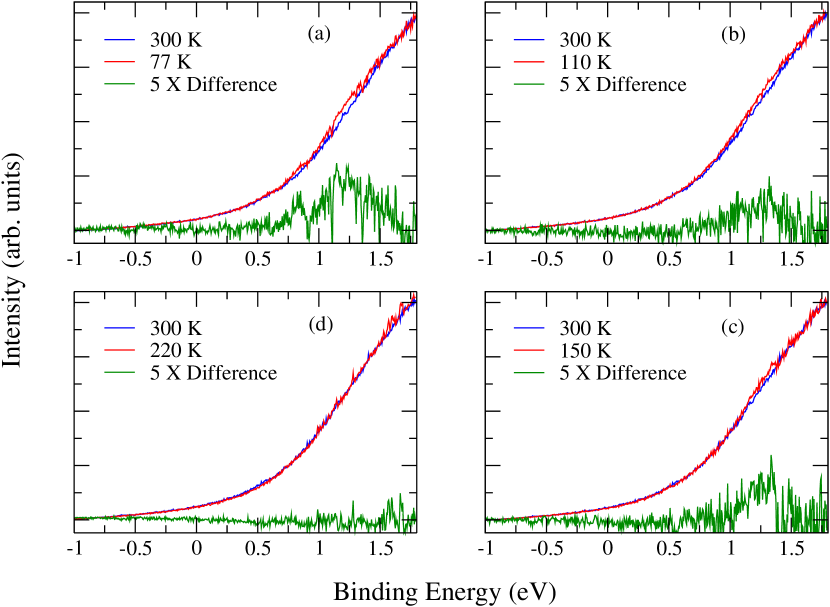
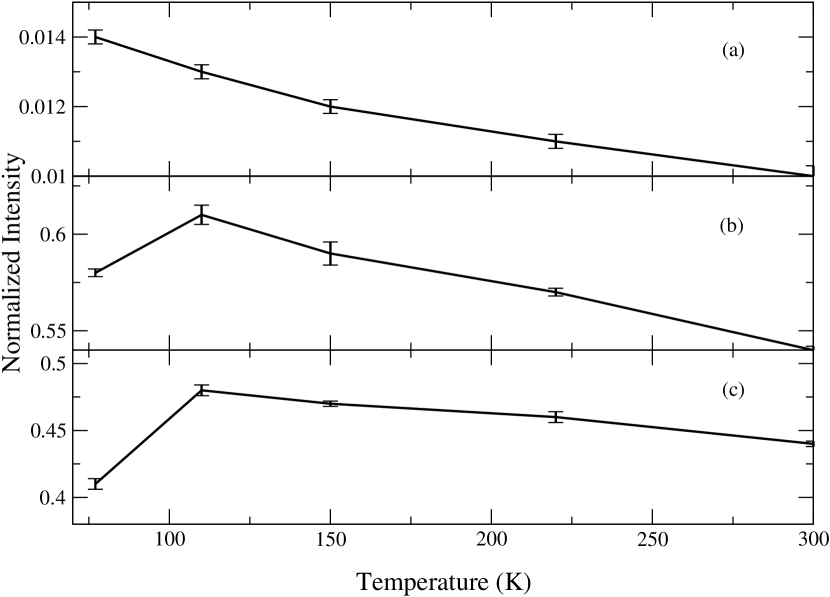
The angle-integrated valence band photoemission spectra of Pr0.67Ca0.33MnO3 taken at different temperatures below and above c are shown in Fig. 1. Intensities of all the spectra were normalized and shifted along the axis by a constant for clarity. The spectra, dominated by the states due to the Mn 3-O 2 hybridized orbitals, look similar to those reported earlier on the La1-xSrxMnO3 system sarma2 ; park1 ; park2 ; saitoh1 ; saitoh2 . The origin of the two prominent features, one at -3.5 eV (marked ) and another at -5.6 eV (marked ) below F, are now well known from earlier experiments and band structure calculations saitoh2 ; pal ; kurmaev on similar systems. While the feature at -3.5 eV is mainly due to the 2g↑ states of the MnO6 octahedra, the -5.6 eV subband has contributions from both 2g and g states. More important contributors to the properties of these systems are the states nearer to F, which appear as a tail at -1.2 eV (marked ) from the chemical potential. The Intensity of this feature is quite small compared to and and is a signature of the insulating nature of this material. Earlier photoemission experiments on La1-xSrxMnO3 also have shown that the intensity of this tail feature is quite small sarma1 ; park1 ; park2 ; saitoh1 ; saitoh2 . The presence of the feature is clear from Fig. 2, where we have shown the near-F region of the valence band spectra taken with a higher resolution. Here, the spectra taken at different temperatures have been compared with those at room temperature. The figure also shows the difference spectra obtained by subtracting the room-temperature spectra from spectra taken at low temperatures. The feature in the difference spectra corresponds to , which originates from the g↑ states saitoh1 . In order to estimate the relative changes in all the three features (, , and ) due to temperature, we have carefully fitted the whole valence band spectrum with three components corresponding to the three subbands contributing to this region. We used a 2 iterative program for fitting the different spectra with Lorentzian line shapes for , , and . Except for the area of the peaks, the energy positions, widths, background, and all other parameters of all the peaks were kept the same for different temperatures. The positions and full widths at half maximum (FWHMs) of the three peaks are given in the caption of Fig. 3. The fitted spectra for 77 K (below c) and 300 K (above c) are shown on the left sides of Figs. 5(a) and 5(b) below. One can see from Figs. 3(a)-3(c) and that the area of all the peaks keeps increasing as we go down in temperature c, but below this temperature the intensities of both peaks and decrease. On the other hand, the intensity of does not show any decrease across the transition [Fig. 3(a)].
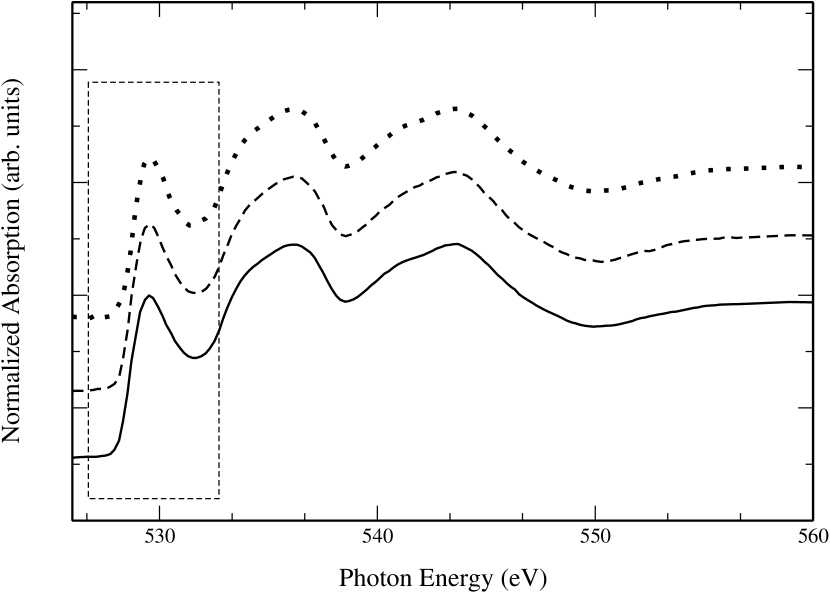
In a reasonable approximation, the near-F region of the O x-ray absorption spectra could well represent the density of unoccupied states in many of the transition metal oxide compounds park1 ; degroot . In order to probe the electronic structure of the unoccupied states we have performed XAS on our Pr0.67Ca0.33MnO3 single crystal. The O edge XAS spectra taken at room temperature and 150 and 95 K (below c), shown in Fig. 4, have been normalized in intensity all along the region starting from 550 eV. The preedge feature in the O spectra (centered around 529.5 eV) is due to the strong hybridization between Mn 3 and O 2 orbitals. We will analyze this structure in detail in the later part of this paper. The broad feature around 536.5 eV is due to the bands from hybridized Pr 5 and Ca 3 orbitals, while the structure above 540 eV is due to states like Mn 4 and Pr 6, etc. These states are known to contribute least to the near-F electronic structure of these transition metal-oxide compounds. The assignments of the features mentioned above are consistent with the band structure calculations on similar systems degroot ; kurata .
The preedge feature in the O edge spectra carries a substantial amount of physics involved in the properties of these materials. It has earlier been shown that the prepeak in the O edge spectra of different CMR materials consists of two lines, one of which appears as a shoulder on the low-energy side of the other park2 ; toulemonde ; dessau1 ; mannella . The intensity of this shoulder was found to increase as the material goes across the insulator-metal transition toulemonde ; mannella . Since our Pr0.67Ca0.33MnO3 sample is an insulator at all temperatures the prepeak in our O edge spectra (Fig. 4) does not show any splitting, though the presence of the shoulder is visible as an asymmetry on the low-energy side of this peak. This shoulder feature is due to the first available unoccupied states and in XAS corresponds to the addition of an electron to the g↑ state of the crystal-field-split MnO6 octahedra. The main feature in the prepeak arises from the 2g↓ states park2 . For a quantitative estimate of the temperature-dependent changes in the intensities of the two features we have fitted the prepeak using two components of Lorentzian line shapes. Here also the data fitting was done using 2 iterative method, keeping the energy positions and widths the same for all temperatures. Results of the data fit are shown in Table I. Fitted spectra for temperatures above (300 K) and below (95 K) are shown on the right side of Figs 5(a) and 5(b). Though very small, the intensity of the feature ′ shows a slight increase below c. The best fit gives a 0.60.1 eV difference between the energy positions of ′ and ′. Following a different assignment of origin to the prepeak features Dessau . have interpreted this energy difference as a measure of the Jahn-Teller distortion (4JT) dessau2 .
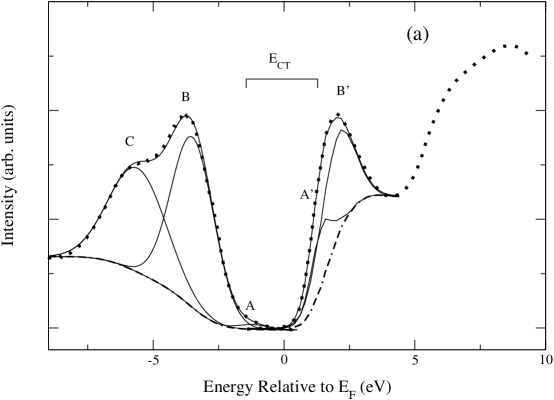
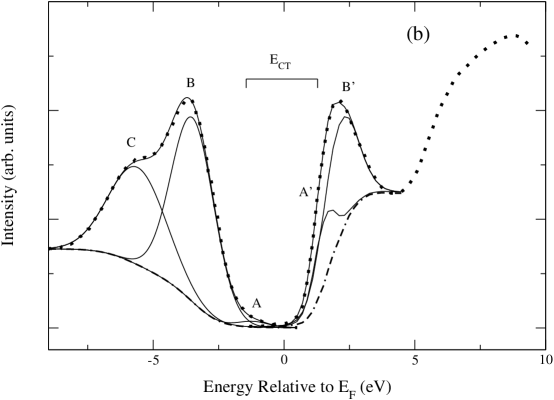
Having shown the temperature-dependent changes in the UPS and XAS results in Figs. 2 and 4, we present a combined picture of them in order to derive some insights into the charge transfer energy involved in the properties of the Pr0.67Ca0.33MnO3 sample. The combined spectra of the valence band from photoemission and the preedge region of the O edge XAS, presented in Figs 5(a) and 5(b) give the density of both occupied and unoccupied states above and below the Curie temperature (c). A schematic of these energy levels is shown in Fig. 6. The hole or electron doping (value of ) causes the symmetry of the last occupied and first unoccupied bands to be . In Fig. 5 these states are marked by and ′. In order to scale the left and right sides of F, the O edge spectra have been shifted such that the energy of the first unoccupied state (1.4 eV from F) found from inverse photoemission chainani coincides with that of ′. We have used integral backgrounds for both sides of F and, as mentioned earlier, all the fitting parameters were kept the same including the energy positions for the high and low temperatures. The important parameter which can be derived from this combined spectrum is the charge transfer energy CT, which is the energy required for an g electron to hop between the Mn3+(32g1g) and Mn4+(32g) sites. In our spectra (Fig. 5) CT is the energy difference between and ′ which corresponds to the last occupied and first unoccupied states. The value of CT is 2.60.1 eV from our spectra, which is higher than the value (1.50.4 eV) determined indirectly by Park . for the La1-xCaxMnO3 system park1 . The larger value of CT shows the existence of a stronger charge localization in the charge- or orbital-ordered Pr0.67Ca0.33MnO3 compound.
Pr0.67Ca0.33MnO3 shows a transition to a charge-ordered state below 220 K (Tco) silvina ; christine ; hardy . Neutron diffraction studies simon on another part of this single crystal have shown that this charge ordering turns into an antiferromagnetically structured pseudo-CE type charge or orbital ordering below 110 K. Also, the coexistence of ferromagnetic and antiferromagnetic phases below this transition temperature has been shown on this single crystal. In the pseudo-CE-type ordering the Mn 3 orbitals, where the g state is occupied, are aligned with the O 2 orbitals. Such an alignment can increase the hybridization between Mn 3 and O 2. Furthermore, a simultaneous decrease in the hybridization strength could also be expected for the corelike in-plane 2g and O 2 states. The results of the curve fitting (Fig. 3) of our valence band spectra reflects these changes in hybridization with temperature. The charge ordering following the decrease in temperature causes an increase in the O 2 contribution to both the 2g and g spin-up subbands in the valence region and hence the intensities of , , and go up. As mentioned earlier, the pseudo-CE-type charge or orbital ordering below 110 K, results not only in a stronger hybridization of O 2 with the states compared to that with the 2g states but a simultaneous decrease in the latter also. This is reflected in the increase in intensity of and decrease in the intensities of both and below 110 K. Though in Pr0.67Ca0.33MnO3 there is no temperature-dependent insulator-metal transition, the change in intensities of these features across c appears similar to the shifting of spectral weight found in the La1-xSrxMnO3 system sarma1 .
The value of CT indicating a strong charge localization, found in our Pr0.67Ca0.33MnO3 has significant implications for the models proposed to explain the CMR effect in manganites. Charge localization can result from strong-coupling interactions of the g electron with the corelike 2g or the 2 and 3 Jahn-Teller modes. Both these interactions influence the electron hopping term (). The former interaction, ferromagnetic in nature, is the Hund’s coupling H. A large value of H favors the electronic separation of phases. A strong electron-lattice coupling results from the cooperative Jahn-Teller distortions of the MnO6 octahedra. These distortions, particularly the 2 and 3 vibrational modes of the oxygen ions are stronger in the case of Pr-containing manganites compared to La-containing ones. Park . park1 have reported a smaller charge transfer energy (CT = 1.5 eV) in the case of La1-xCaxMnO3 and have attributed it to small polarons (Anderson localization) induced from the ionic size difference between Mn3+ and Mn4+. A small-polaronic model may not be able to explain the high value of CT found in Pr0.67Ca0.33MnO3. On the other hand, a strong charge localization is expected in the case of the PS model in which the ground state is described as a mixture of ferromagnetic and antferromagnetic regions. It is also possible that this large charge localization is due to the Zener polaron proposed by Aladine aladine . In the Zener polaron picture, the Mn ions of adjacent MnO6 octahedra form a dimer with variations in the Mn-O-Mn bond angle. The pseudo-CE-type charge ordering in Pr1-xCaxMnO3 favors such regular distortions in the MnO6 octahedra. Further studies using electron spectroscopic techniques on samples in the vicinity of the charge-ordered compositions may be able to differentiate between these possible driving mechanisms behind the strong charge localization.
IV CONCLUSIONS
Using valence band photoemission and O edge x-ray absorption, we have probed the electronic structure of Pr0.67Ca0.33MnO3, which is regarded as a prototype for the electronic phase separation models in CMR systems. With decrease in temperature the O 2 contributions to the 2g and g spin-up states in the valence band were found to increase until c. Below c, the density of states with g spin-up symmetry increased while those with 2g symmetry decreased, possibly due to the change in the orbital degrees of freedom associated with the Mn 3 - O 2 hybridization in the pseudo-CE-type charge or orbital ordering. These changes in the density of states could well be connected to the electronic phase separation reported earlier. Our quantitative estimate of the charge transfer energy (CT) is 2.60.1 eV, which is large compared to the earlier reported values in other CMR systems. Such a large charge transfer energy may support the phase separation model.
ACKNOWLEDGMENTS
The authors would like to thank the staff at the BEAR and BACH beamlines of Elettra Sincrotrone Trieste, Italy for the XAS measurements and DST, India for financial support.
References
- (1) I. G. Deac, J. F. Mitchell and P. Schiffer Phys. Rev. B 63, 172408 (2001).
- (2) L. M. Fisher, A. V. Kalinov, I. F. Voloshin, N. A. Babushkina, K. I. Kugel, and D. I. Khomskii Phys. Rev. B 68, 174403 (2003).
- (3) R. Kajimoto, H. Mochizuki, H. Yoshizawa, S. Okamoto, and S. Ishihara, Phys. Rev. B 69, 54433 (2004).
- (4) K. S. Nagapriya, A. K. Raychoudhuri, B. Bansal, V. Venkataraman, S. Parashar, and C. N. R. Rao, Phys. Rev. B 71, 024426 (2005).
- (5) A. Moreo, S. Yunoki, and E. Dagatto, Science 283, 2034 (1999).
- (6) A. Moreo, M. Mayr, A. Feiguin, S. Yunoki, and E. Dagotto, Phys. Rev. Lett. 84, 5568 (2000).
- (7) S. Yunoki, J. Hu, A. L. Malvezzi, A. Moreo, N. Furukawa, and E. Dagotto, Phys. Rev. Lett. 80, 845 (1998).
- (8) D. D. Sarma, D. Topwal, U. Manju, S. R. Krishnakumar, M. Bertolo, S. La Rosa, G. Cautero, T. Y. Koo, P. A. Sharma, S.-W. Cheong, and A. Fujimori, Phys. Rev. Lett. 93, 97202 (2004).
- (9) P. G. Radaelli, R. M. Ibberson, D. N. Argyriou, H. Casalta, K. H. Andersen, S. -W. Cheong and J. F. Mitchell, Phys. Rev. B 63, 172419 (2001)
- (10) C. Zener, Phys. Rev. 82, 403 (1951).
- (11) P. W. Anderson and H. Hasegawa, Phys. Rev. 100, 675 (1955).
- (12) P. -G. de Gennes, Phys. Rev. 118, 141 (1960).
- (13) A. J. Millis, P. B. Littlewood, and B. I. Shraiman, Phys. Rev. Lett. 74, 5144 (1995).
- (14) A. J. Millis, B. I. Shraiman, and R. Mueller Phys. Rev. Lett. 77, 175 (1996).
- (15) Ch. Simon, S. Mercone, N. Guiblin, C. Martin, A. Brulet, and G. Andre, Phys. Rev. Lett. 89, 207202 (2002).
- (16) K. Miyano, T. Tanaka,Y. Tomioka, and Y. Tokura, Phys. Rev. Lett. 78, 4257 (1997).
- (17) E. O. Wollan, and W. C. Koehler, Phys. Rev. 100, 545 (1955)
- (18) Z. Jirak, S. Krupicka, Z. Simsa, M. Dlouha, and S. Vratislav, J. Magn. Magn. Mater. 53, 153 (1985)
- (19) D. D. Sarma, N. Shanthi, S. R. Krishnakumar, T. Saitoh, T. Mizokawa, A. Sekiyama, K. Kobayashi, A. Fujimori, E. Weschke, R. Meier, G. Kaindl, Y. Takeda, and M. Takano, Phys. Rev. B 53, 6873 (1996).
- (20) J.-H. Park, C. T. Chen, S. W. Cheong, W. Bao, G. Meigs, V. Chakarian, and Y. U. Idzerda, Phys. Rev. Lett. 76, 4215 (1996)
- (21) J.-H. Park, T. Kimura, and Y. Tokura, Phys.Rev. B 58, R13330 (1998).
- (22) T. Saitoh, A. E. Bocquet, T. Mizokawa, H. Namatame, A. Fujimori, M. Abbate, Y. Takeda, and M. Takano, Phys. Rev. B 51, 13942 (1995).
- (23) T. Saitoh, A. Sekiyama, K. Kobayashi, T. Mizokawa, A. Fujimori, D. D. Sarma, Y. Takeda, and M. Takano, Phys. Rev. B 56, 8836 (1997).
- (24) P. Pal, M. K. Dalai, B. R. Sekhar, S. N. Jha, S. V. N. Bhaskara Rao, N. C. Das, C. Martin, and F. Studer, J. Phys.: Condens. Matter 17, 2993 (2005).
- (25) D. S. Dessau, Y. D. Chuang, A. Gromko, T. Saitoh, T. Kimura, and Y. Tokura, J. Electron Spectrosc. and Relat. Phenom. 117-117, 265 (2001).
- (26) D. S. Dessau, T. Saitoh, C.-H. Park, Z.-X. Shen, Y. Moritomo, and Y. Tokura, in and , edited by M. Hundley, J. Nickel, R. Ramesh, and Y. Tokura, MRS Symposia Proceedings No. 494 (Materials Research Society, Pittsburgh, 1998),p. 181.
- (27) N. Mannella, A. Rosenhahn, M. Watanabe, B. Sell, A. Nambu, S. Ritchey, E. Arenholz, A. Young, Y. Tomioka, and C. S. Fadley, Phys. Rev. B 71, 125117 (2005).
- (28) O. Toulemonde, F. Millange, F. Studer, B. Raveau, J. H. Park, and C. T. Chen, J. Phys. Condens. Matter 11, 109 (1999).
- (29) J.-H. Park, C. T. Chen, S.-W.Cheong, W. Bao,and G. Meigs, J. Appl. Phys. 79, 4558 (1996).
- (30) S. Mercone, V. Hardy, C. Martin, Ch. Simon, D. Saurel,and A. Brulet, Phys. Rev. B 68, 094422 (2003).
- (31) S. Nannarone, F. Borgatti, A. DeLuisa, B. P. Doyle, G. C. Gazzadi, A. Giglia, P. Finetti, N. Mahne, L. Pasquali, M. Pedio, G. Selvaggi, G. Naletto, M. G. Pelizzo, and G. Tondello, in SYNCHROTRON RADIATION INSTRUMENTATION: Eighth international conference on synchrotron radiation instrumentation, edited by T. Warwick, J. Stohr, H. A. Padmore, and J. Arthur, AIP Conf. Proc. No. 705 (AIP, San Franscisco, California, 2003), pp. 450-453.
- (32) M. Zangrando, M. Finazzi, G. Paolucci, G.Comelli, B. Diviacco, R. P. Walker, D. Cocco, and F. Parmigiani, Rev. Sci. Instrum. 72, 1313 (2001).
- (33) E. Z. Kurmaev, M. A. Korotin, V. R. Galakhov, L. D. Finkelstein, E. I. Zabolotzky, N. N. Efremova, N. I. Lobachevskaya, S. Stadler, D. L. Ederer, T. A. Callcott, L. Zhou, A. Moewes, S. Bartkowski, M. Neumann, J. Matsuno, T. Mizokawa, A. Fujimori, and J. Mitchell, Phys. Rev. B 59, 12799 (1999).
- (34) F. M. F. de Groot, M. Grioni, J. C. Fuggle, J. Ghijsen, G. A. Sawatzky, and H. Petersen, Phys. Rev. B 40, 5715 (1989).
- (35) H. Kurata, E. Lefevre, C. Colliex, and R. Brydson, Phys. Rev. B 47, 13763 (1993).
- (36) A. Chainani, M. Mathew, and D. D. Sarma, Phys. Rev. B 47, 15397 (1993).
- (37) C. Martin, A. Maignan, M. Hervieu, and B. Raveau, Phys. Rev. B 60, 12191 (1999).
- (38) V. Hardy, A. Wahl, and C. Martin, Phys. Rev. B 64, 64402 (2001)
- (39) A. Daoud-Aladine, J. Rodriguez-Carvajal, L. Pinsard-Gaudart, M. T. Fernandez-Diaz, and A. Revcolevschi, Phys. Rev. Lett. 89, 097205 (2002).
| Temperature (K) | O edge x-ray absorption spectra | |||||
|---|---|---|---|---|---|---|
| ′ | ′ | |||||
| Position | FWHM | Normalized | Position | FWHM | Normalized | |
| 95 | (eV) | (eV) | area | (eV) | (eV) | area |
| 2.11 | 1.52 | 0.72 | 1.48 | 0.97 | 0.29 | |
| 150 | 2.11 | 1.52 | 0.72 | 1.48 | 0.97 | 0.26 |
| 300 | 2.12 | 1.52 | 0.73 | 1.47 | 0.97 | 0.26 |