One-dimensional versus two-dimensional correlation effects in the oxyhalides TiOCl and TiOBr
Abstract
We have performed a comparative study of the electronic structures of the spin-Peierls systems TiOCl and TiOBr by means of photoemission spectroscopy and density functional calculations. While the overall electronic structure of these isostructural compounds is qualitatively similar, the bromide appears to be less one-dimensional. We present a quantitative analysis of the experimental dispersions in terms of exchange constant and hopping integral as well as a discussion of the qualitative spectral features. From that we conclude that despite the one-dimensional physics triggering the ground state in both compounds a proper description of the normal state electronic structure has to take into account the anisotropic frustrated interchain interactions on the underlying triangular lattice.
pacs:
71.20.-b,71.27.+a,71.30.+h,79.60.-iI Introduction
Based on magnetic measurements and LDA+U calculations, the layered Mott insulator TiOCl was recently proposed to be electronically and magnetically quasi-one-dimensional and an unusual spin-Peierls compound.Seidel et al. (2003) Indeed, a true spin-Peierls ground state was identified for TiOCl as well as for the isostructural TiOBr by revealing the lattice dimerization in x-ray diffraction measurements.Shaz et al. (2005); Palatinus et al. (2005) For a conventional spin-Peierls system one would expect only one phase transition, however, TiOCl and TiOBr possess two successive phase transitions at temperatures K, K and K, K, respectively. In the intermediate phase an incommensurate superstructure was found that develops below .van Smaalen et al. (2005); Krimmel et al. (2006) In a first order transition at this order locks in, resulting in the commensurate order of the spin-Peierls ground state.Rückamp et al. (2005); van Smaalen et al. (2005); Krimmel et al. (2006) Also in contradiction to a canonical spin-Peierls scenario, both compounds display marked fluctuation effects in an extended temperature regime above . For TiOCl, this was seen in magnetic resonance,Imai and Chou ; Kataev et al. (2003) RamanLemmens et al. (2004) and infrared spectroscopy,Caimi et al. (2004a) and specific heat measurements.Hemberger et al. (2005) For TiOBr, the importance of fluctuations was inferred from the infrared optical properties.Caimi et al. (2004b) The origin of these fluctuations is still unclear but fluctuating orbital degrees of freedom can be ruled out due to the high energy of the lowest crystal field excitation in the manifold.Rückamp et al. (2005); Hoinkis et al. (2005); Zakharov et al. (2006) From photoemission spectroscopy on TiOCl in connection with electronic structure calculations we argued in a previous study that electronic correlations and/or spin-Peierls fluctuations might play an important role in this system.Hoinkis et al. (2005) The detailed behavior of the quasi-one-dimensional dispersions, however, is still not understood.
In this study we compare the electronic structures of TiOBr and TiOCl well above the transition temperatures and . We present angle-integrated and angle-resolved photoemission (ARPES) data as well as complementary density functional calculations. While TiOBr is less one-dimensional than TiOCl we conclude from a detailed analysis of the experimental dispersions as well as a discussion of the qualitative spectral features that probably a Hubbard-like model including the anisotropic frustrated interchain interactions on the underlying triangular lattice is best suited to capture the relevant physics dominating the single-particle excitation spectra of these compounds.
II Technical Details
Single crystals of TiOCl were prepared by chemical vapor transport from TiCl3 and TiO2.Schäfer et al. (1958) TiOBr crystals were synthesized in a similar way from TiO2 with a 40% excess of Ti and TiBr4.Palatinus et al. (2005); Schäfer et al. (1958)
Photoemission spectroscopy (PES) was performed using He i radiation (21.22 eV) and an Omicron EA 125 HR electron energy analyzer. Fresh surfaces were prepared by in situ crystal cleavage with adhesive tape. The resulting surfaces were clean and atomically long-range ordered as evidenced by x-ray induced photoemission (XPS) and low-energy electron diffraction (LEED), respectively. Since both TiOCl and TiOBr are insulators sample charging was reduced by measuring at elevated temperatures, i.e., at 325 K in the case of TiOCl and at 360 K in the case of TiOBr. For TiOCl, we found from systematic temperature variations that the charging is almost negligible at and above 370 K. In this situation the maximum of the Ti peak (see below) is located 1.45 eV below the experimental chemical potential , which corresponds to the Fermi edge position of a silver foil. The TiOCl spectra were aligned accordingly. The energy position of the Ti peak in TiOBr depends on the temperature in a very similar way. It was aligned to the same value of 1.45 eV below . The energy resolution amounted to 60 meV for the TiOCl and 110 meV for the TiOBr measurements. The angular acceptance was in both cases.
The photoemission experiments are complemented by calculations of the electronic structure of TiOBr and TiOCl within the ab initio density functional theory in the generalized gradient approximation with inclusion of on-site Coulomb correlations (GGA+U)Perdew et al. (1996); Anisimov et al. (1993) using the full-potential linearized augmented plane-wave code WIEN2k.Blaha et al. (2001) The GGA+U calculations, which require a spin-polarized starting configuration, were performed by considering a ferromagnetic alignment of the Ti spins. For both systems a value of was used and k irreducible points were considered for Brillouin zone integrations. The onsite Coulomb repulsion and onsite exchange were chosen to be eV and eV, respectively.Seidel et al. (2003); Saha-Dasgupta et al. (2004)
III Results and Discussion
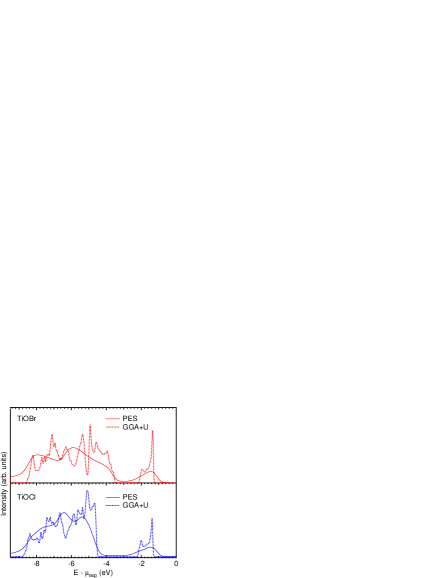
In Fig. 1 angle-integrated photoemission spectra are compared to the GGA+U densities of states. The calculations yield a clear separation of the states with predominant Ti character centered around eV from the ones which are mainly derived from the O and Br/Cl levels. The latter are found between eV and eV for TiOBr and between eV and eV for TiOCl. The photoemission spectra clearly show this partition as well. Also the significantly smaller separation of the Ti states from the rest of the valence band which is found in the calculations for TiOBr is observed in photoemission.
However, neither the exact shape nor the width of the Ti spectral weight are reproduced by our calculations. As it was pointed out in an earlier publication,Hoinkis et al. (2005) this is most likely due to pronounced electronic correlations and/or spin-Peierls fluctuations which are beyond the scope of the GGA+U method. A better match between the calculated and the experimental spectra is found with respect to the width of the bands. Due to matrix element effects a more detailed agreement of the spectra with the bare densities of states cannot be expected.
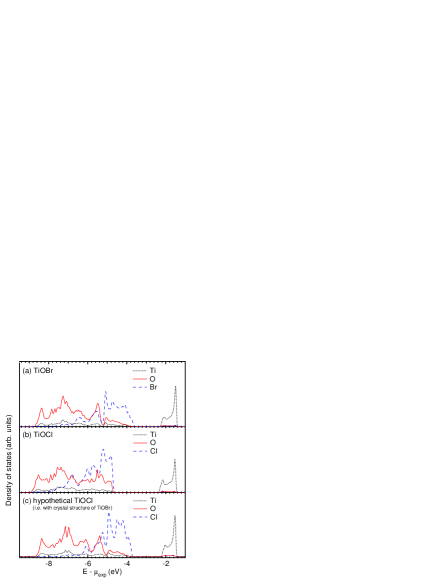
In order to address the question whether the smaller separation between the manifold of O/Cl(Br) and the Ti states in the Br compared to the Cl system is caused by the change in chemistry or rather related to the structural expansion we performed a third calculation. There we assumed a hypothetical compound with the crystal structure of TiOBr but with Br substituted by Cl. In Fig. 2 the atomically resolved densities of states for all three systems is presented. The decomposition into Ti states near the chemical potential on the one hand and O and Cl(Br) states at higher binding energies on the other becomes very clear in this plot. By comparison it is easily seen that the separation of the Ti states is smaller in the Br system mainly due to the expanded unit cell of TiOBr.
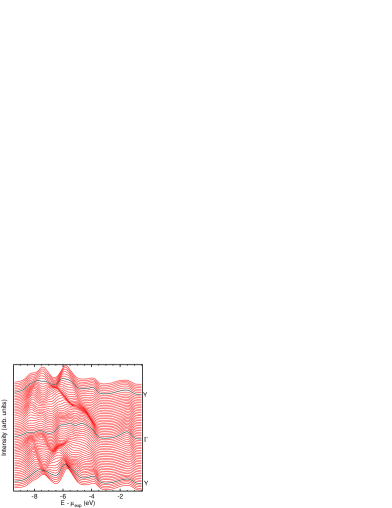
Turning to our angle-resolved photoemission data, we display energy distribution curves (EDCs) of TiOBr in a broad energy range along the crystallographic direction in Fig. 3. What immediately stands out are the well-pronounced dispersions, especially in the Br /O part of the spectra. The dispersions are clearly symmetric with respect to the point reflecting atomic long range order and thus can be taken as a further proof of the good surface quality.
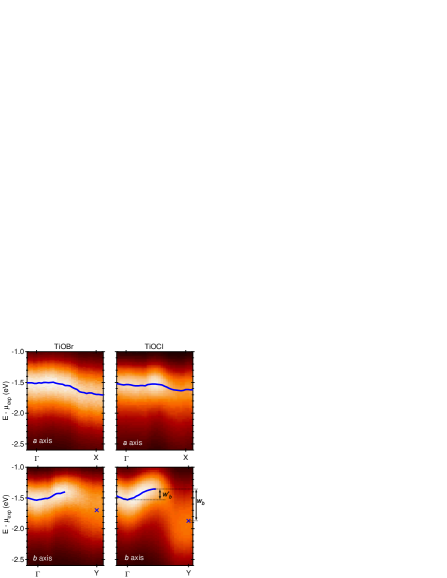
In Fig. 4 the Ti spectral weight distributions of TiOBr and TiOCl are compared. The four panels show ARPES intensity plots along the crystallographic axes and . As seen, small but clear dispersions are discernible in all four panels. These are quantitatively identified by lines and markers. The lines indicate EDC peak maxima obtained by a fitting procedure. For both compounds, this works well along the direction and in the first half of the path from to Y, i. e. along in direct space. In the second half, however, the EDCs lose their single peak-like shape as an additional feature at higher binding energies appears and thereby the spectra gradually change their form to end up in a broad hump at the Y point.Hoinkis et al. (2005) Thus a fit with a single peak is not adequate here. Instead, we take the first order moment of the EDCs at the Y point, indicated by crosses in Fig. 4.
Following first the dispersions along the axes, i. e. from to X in reciprocal space, both compounds display a qualitatively similar behavior: Initially the energy changes only slightly before it reaches a maximum, and then shifts downwards until the Brillouin zone edge. Also along the crystallographic direction, the dispersions show a qualitative resemblance in the two compounds. Starting from , a single peak disperses upwards, with the shape of the EDCs remaining essentially unaltered until Y. As already pointed out, subsequently the spectral changes get more complex. In any case the overall dispersion bends downwards reaching a minimum at the Y point which lies further below the one at . We emphasize once more that while at first glance the dispersions from the intensity plots might appear to be similar along the and directions they are qualitatively different if one looks at the spectral shapes of the corresponding EDCs.
| width | TiOBr | TiOCl |
|---|---|---|
| 0.27(3) eV | 0.12(3) eV | |
| 0.26(5) eV | 0.47(5) eV | |
| 0.13(1) eV | 0.17(1) eV |
For a quantitative comparison of the electronic dispersions between the two compounds we list the parameters , , and in Table 1. The unprimed quantities refer to the overall dispersion widths while measures the width of only the inner part of the dispersion in the region from to about Y. These widths are determined either from the difference of the maximal and minimal peak energies along the corresponding paths in space as obtained by the fitting procedure (see lines in Fig. 4), or the difference between the maximum peak energy and the first order moment at the Y point in case of (see markers in Fig. 4). The errors indicated reflect the scatter from several samples and measurements.
As is immediately read off from Table 1 the overall dispersion width along is significantly smaller in TiOBr with respect to TiOCl while it is the other way round regarding the axis. Given that both systems and in particular their electronic structures are governed by the same physics we hence conclude that the anisotropy of TiOBr is less pronounced than in TiOCl. This is in line with the trend in the relevant hopping integrals as derived from downfolding LDA+U results as well as with the fact that the Bonner-Fisher curve indicative for 1D Heisenberg chains does not provide a good fit for the high-temperature magnetic susceptibility of TiOBr in contrast to TiOCl.Lemmens et al. (2005); foo
At this stage we resort to the central result of our previous study on TiOClHoinkis et al. (2005) where among various approaches to the resolved electronic structure we identified the spectral function of the single-band 1D Hubbard model as the most promising starting point in order to get further insight into the microscopic physics behind our experimental data. We recall that the most obvious shortcomings of the model calculations were the lack of any evidence for spin-charge separation and the absence of the so-called shadow band in the ARPES spectra although for the relevant parameter regime it should be clearly observable.Ben As possible explanations for the discrepancies between theory and experiment we invoked multiorbital effects and/or spin-Peierls fluctuations. A comparison between the isostructural compounds TiOBr and TiOCl now opens the possibility to further explore the reasons for this discrepancy between 1D Hubbard model prediction and experiment. For this purpose we focus on the central part of the dispersion along the axis marked by lines in Fig. 4. Within the single-band 1D Hubbard model this part corresponds to the () region of the spinon and holon branches (see Fig. 7 in Ref. Hoinkis et al., 2005). Hence, depending on the dominant character of the experimental dispersion its width should either scale with the exchange constant whose value can be extracted from magnetic susceptibility measurementsSeidel et al. (2003); Rückamp et al. (2005) or the hopping integral . The latter either can be inferred from the Hubbard model perturbation expression for the exchange constant, , and thus should scale as or it can be deduced from an appropriate downfolding procedure of LDA+U band calculations.Lemmens et al. (2005) An account of these quantities is given in Table 2. The values of for TiOBr and TiOCl differ by % (with respect to the value in TiOCl), whereas the experimental dispersion width is smaller in TiOBr by only %.
| TiOBr | TiOCl | x/x | |
|---|---|---|---|
| 1D dispersion | 0.13 eV | 0.17 eV | -23% |
| J from magnetic susceptibility | 32 meV | 58 meV | -45% |
| 0.16 eV | 0.22 eV | -26% | |
| from LDA+U | 0.17 eV | 0.21 eV | -19% |
On the contrary, the experimental width nicely matches the transfer integral as obtained from which is smaller in the bromide by % compared to the chloride. A similarly fair agreement is achieved with from the LDA+U downfolding studiesLemmens et al. (2005) where the effective - hopping parameter along the axis is by % smaller in TiOBr with respect to TiOCl. From this analysis it follows that the experimentally observed dispersions scale with — not with — and thus can clearly be identified as charge excitations. Moreover, there is no indication in the spectra of Fig. 3 for any asymmetry towards lower binding energies which could be interpreted as a remnant of the spinon branch. Thus, we are led to rule out that the experimentally observed spectral dispersion is a superposition of both holon and spinon excitations.
Turning back to our starting point, i.e., the single-band 1D Hubbard model, a simple explanation for the lack of a spinon branch and shadow band would be that the two-dimensional coupling in these compounds under the particularities of a triangular lattice is already large enough so that generic 1D features of the spectral weight distribution can not persist. One would then be left with a lower Hubbard band which though incoherent in nature could still display sizable dispersion alike to what we observe experimentally. Clearly, this issue demands for more detailed theoretical investigation. Alternatively, one could stick to the 1D Hubbard model and cite the coupling to phonons, multiorbital or spin-Peierls fluctuation effects as possible causes for the complete suppression of the generic 1D phenomenology. However, from the organic quasi-one-dimensional conductor TTF-TCNQ we know that the phonons,Claessen et al. (2002); Sing et al. (2003) which should couple equally strong to the electrons in this charge density wave system and are of even higher energy, do not suppress or smear out the spectral features of spin-charge separation and shadow band. Moreover, since as already stated the orbital degrees of freedom are quenched in the oxyhalides and spin-Peierls fluctuations should not be too important so far above the transition temperatures, these two effects are probably not very effective.
In view of the above results we are thus left in a situation where on the one hand the spin-Peierls ground state of both oxyhalides studied here is dominated by 1D interactions while the analysis and discussion of the electronic dispersions at room temperature as well as the incommensurate order in the intermediate phase point to the importance of 2D (frustrated) interchain interactions. It remains interesting to see whether or not an anisotropic Hubbard model type description taking account of the magnetic interchain frustrations on the underlying triangular lattice is capable of better describing the electronic properties of this class of materials positioned in the regime between 1D and 2D correlations.
IV Conclusions
In summary, we have investigated the electronic structure of TiOBr and TiOCl by means of photoelectron spectroscopy and GGA+U calculations. In these compounds we find a very similar density of states, with the exception of an enlarged separation between the manifold of O and Cl(Br) levels and the Ti states. This difference is due to the enlarged unit cell in TiOBr. ARPES measurements reveal that the Ti spectral weight dispersions of the two compounds show a great qualitative resemblance, with the main difference that in TiOBr the overall dispersion width is larger along the axis and smaller along the axis, compared to the chloride. Thus the quasi-one-dimensional character of TiOBr is clearly less pronounced. From the comparison of TiOBr and TiOCl, we are able to show that the dispersion of the band along the axis scales with the square root of the exchange constant , i.e. with the hopping integral . Based on this analysis and the lack of any sign for spin-charge separation or shadow band and against the background of other experimental findings we argue that the physics of both systems is governed by the interplay of both one-dimensional and two-dimensional correlations.
Acknowledgements.
We are grateful to H. Benthien and M. Potthoff for fruitful discussions. This work was supported by the Deutsche Forschungsgemeinschaft through SFB 484 and grant CL 124/3-3.References
- Seidel et al. (2003) A. Seidel, C. A. Marianetti, F. C. Chou, G. Ceder, and P. A. Lee, Phys. Rev. B 67, 020405(R) (2003).
- Shaz et al. (2005) M. Shaz, S. van Smaalen, L. Palatinus, M. Hoinkis, M. Klemm, S. Horn, and R. Claessen, Phys. Rev. B 71, 100405(R) (2005).
- Palatinus et al. (2005) L. Palatinus, A. Schönleber, and S. van Smaalen, Acta Crystallogr. C 61, i48 (2005).
- van Smaalen et al. (2005) S. van Smaalen, L. Palatinus, and A. Schönleber, Phys. Rev. B 72, 020105 (2005).
- Krimmel et al. (2006) A. Krimmel, J. Strempfer, B. Bohnenbuck, B. Keimer, M. Hoinkis, M. Klemm, S. Horn, A. Loidl, M. Sing, R. Claessen, et al., Phys. Rev. B 73, 172413 (2006).
- Rückamp et al. (2005) R. Rückamp, J. Baier, M. Kriener, M. Haverkort, T. Lorenz, G. Uhrig, L. Jongen, A. Möller, G. Meyer, and M. Grüninger, Phys. Rev. L. 95, 097203 (2005).
- (7) T. Imai and F. C. Chou, eprint cond-mat/0301425.
- Kataev et al. (2003) V. Kataev, J. Baier, A. Möller, L. Jongen, G. Meyer, and A. Freimuth, Phys. Rev. B 68, 140405(R) (2003).
- Lemmens et al. (2004) P. Lemmens, K. Y. Choi, G. Caimi, L. Degiorgi, N. N. Kovaleva, A. Seidel, and F. C. Chou, Phys. Rev. B 70, 134429 (2004).
- Caimi et al. (2004a) G. Caimi, L. Degiorgi, N. N. Kovaleva, P. Lemmens, and F. C. Chou, Phys. Rev. B 69, 125108 (2004a).
- Hemberger et al. (2005) J. Hemberger, M. Hoinkis, M. Klemm, M. Sing, R. Claessen, S. Horn, and A. Loidl, Phys. Rev. B 72, 012420 (2005).
- Caimi et al. (2004b) G. Caimi, L. Degiorgi, P. Lemmens, and F. C. Chou, J. Phys.: Condens. Matter 16, 5583 (2004b).
- Hoinkis et al. (2005) M. Hoinkis, M. Sing, J. Schäfer, M. Klemm, S. Horn, H. Benthien, E. Jeckelmann, T. Saha-Dasgupta, L. Pisani, R. Valentí, et al., Phys. Rev. B 72, 125127 (2005).
- Zakharov et al. (2006) D. V. Zakharov, J. Deisenhofer, H.-A. K. von Nidda, P. Lunkenheimer, J. Hemberger, M. Hoinkis, M. Klemm, M. Sing, R. Claessen, M. V. Eremin, et al., Phys. Rev. B 73, 094452 (2006).
- Schäfer et al. (1958) H. Schäfer, F. Wartenpfuhl, and E. Weise, Z. Anorg. Allg. Chemie 295, 268 (1958).
- Perdew et al. (1996) J. Perdew, S. Burke, and M. Ernzerhof, Phys. Rev. Lett. 77, 3865 (1996).
- Anisimov et al. (1993) V. I. Anisimov, I. V. Solovyev, M. A. Korotin, M. T. Czyzyk, and G. A. Sawatzky, Phys. Rev. B 48, 16929 (1993).
- Blaha et al. (2001) P. Blaha, K. Schwarz, and J. Luitz (2001), computer code WIEN2k, Techn. Univ. Wien, Vienna, URL http://www.wien2k.at.
- Saha-Dasgupta et al. (2004) T. Saha-Dasgupta, R. Valentí, H. Rosner, and C. Gros, Europhys. Lett. 67, 63 (2004).
- Lemmens et al. (2005) P. Lemmens, K. Y. Choi, R. Valentí, T. Saha-Dasgupta, E. Abel, Y. S. Lee, and F. C. Chou, New J. Phys. 7, 74 (2005).
- (21) We remark that despite in TiOBr it should not be considered as almost ideally two-dimensional. Since the physical origin of the observed dispersions along and and hence their scaling properties are not known, their widths cannot be compared offhand.
- (22) H. Benthien, Ph. D. thesis, Universität Marburg, 2005.
- Claessen et al. (2002) R. Claessen, M. Sing, U. Schwingenschlögel, P. Blaha, M. Dressel, and C. S. Jacobsen, Phys. Rev. Lett. 88, 096402 (2002).
- Sing et al. (2003) M. Sing, U. Schwingenschlögl, R. Claessen, P. Blaha, J. M. P. Carmelo, L. M. Martelo, P. D. Sacramento, M. Dressel, and C. S. Jacobsen, Phys. Rev. B 68, 125111 (2003).