Point-contact spectroscopy of the borocarbide superconductor YNi2B2C
Abstract
Point-contact (PC) spectroscopy measurements on YNi2B2C single crystals in the normal and superconducting (SC) state (15.4 K) for the main crystallographic directions are reported. The PC study reveals the electron-phonon interaction (EPI) function with a dominant maximum around 12 meV and a further weak structure (kink or shallow broad maximum) at higher energy at about 50 meV. Other phonon maxima at 20, 24 and 32 meV specified in the phonon DOS of YNi2B2C by neutron measurements [PRB, 55, 9058 (1997)] are not resolved in the PC spectra pointing out to the main role of the low energy phonon modes in EPI. Directional study of the SC gap results in 1.5 meV for the - direction and 2.4 meV along the -axis which may point to anisotropic and/or multiband behavior. Noteworthy, the critical temperature in all cases corresponds to that of bulk samples. The value 2/ 3.6 is close to the BCS one of 3.52, and the temperature dependence is BCS-like, while for the -direction deviates from mean-field BCS behavior above . The directional variation in can be attributed to the multiband nature of the SC state in YNi2B2C predicted 10 years ago (PRL, 80, 1730 (1998)).
keywords:
YNi2B2C , borocarbides, point-contact spectroscopy , superconducting gap , electron-phonon interactionPACS:
72.10.Di, 74.45.+c, 74.70Dd, , , , , ,
By point-contact (PC) researches both the superconducting (SC) gap and the PC electron-phonon interaction (EPI) function can be determined by measuring the first and second derivatives of the characteristic of PC’s [1]. Thus the PC spectroscopy is a powerful method to study both the EPI spectra and the SC gap behavior.
In the family of borocarbide superconductors YNi2B2C is remarkable because of its relative high critical temperature 15.4 K among nonoxide ternary compounds. In particular, the nature of the attractive interaction and the SC order parameter remain challenging. So far several thermodynamic, transport and spectroscopic measurements give a clear evidence for a notable anisotropy of the SC gap in this compound [2]. Concerning the EPI studies there is not much information available except the PC data cited in [1].
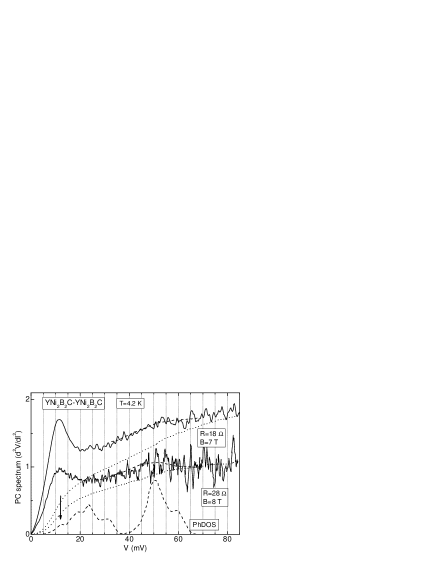
We have measured PC EPI spectra of YNi2B2C with a pronounced phonon maxima at about 12 mV and a broad maximum or shoulder around 50 mV (Fig. 1). These peaks correspond to the features seen in the phonon DOS [3], however 20, 24 and 32 mV phonon maxima are not resolved in the PC spectra. We have obtained the PC EPI spectra for different directions and for contacts with different SC gap , which is distributed (see Fig. 2) between 1.5 meV and 2.5 meV, however, no qualitative difference between PC EPI spectra is observed. In all cases, a more or less broad 12 mV-maximum prevails in the PC EPI spectra. This points out the main role of the low energy phonons in EPI which contribution to the EPI constant is estimated to about 90%. PC EPI spectra were measured by suppressing of superconductivity by magnetic field or temperature to avoid features in the spectra due to SC gap. In this case we did not found in the PC EPI spectra any ”soft” modes at about 5 mV mentioned, e. g., by Martinez-Samper et al. [2].
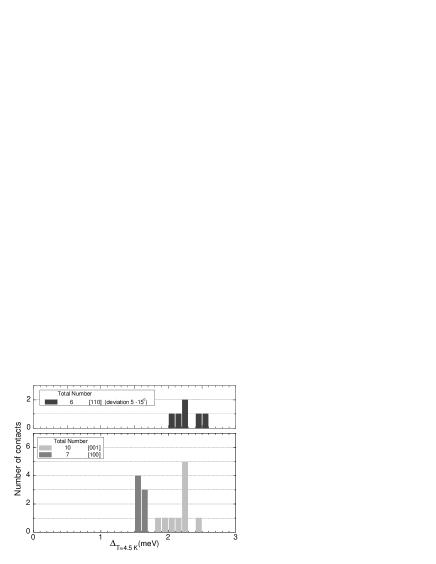
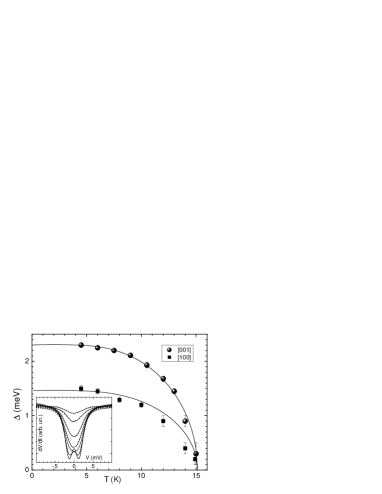
The SC gap manifests itself in the curve of a N-c-S contact as pronounced minima around at . Such are presented in Fig. 3(inset). We have measured the gap distribution for the different crystallographic directions in YNi2B2C shown in Fig. 2. The anisotropy in the distribution is clearly seen: the small gap is characteristic for the a-axis, while along the c-axis the gap is larger. Also the [110] direction has in average the largest gap. Important is that for many of PCs with different gap we have checked the critical temperature , which was always close to the bulk . This avoids the gap variation due to, i. e., the surface degradation.
The SC gap and its temperature dependence are established (Fig. 3) from the fit of . It is seen that has BCS-type dependence, however the small gap deviates from the BCS curve by approaching . Similar (small) gap behavior is characteristic for the multiband superconductor MgB2. For borocarbides, multiband superconductivity has been firstly proposed already in 1998 [4].
References
- [1] Yu. G. Naidyuk and I.K. Yanson, Point-Contact Spectroscopy, Springer Series in Solid-State Sciences, Vol.145 (Springer Science+Business Media, Inc, 2005).
- [2] K. Izawa et al., Phys. Rev. Lett. 89 (2002) 137006; T. Park et al., Phys. Rev. Lett. 92 (2004) 237002; P. Martinez-Samper et al., Phys. Rev. B 67 (2003) 014526; P. Raychaudhuri et al., Phys. Rev. Lett. 93 (2004) 156802; D. L. Bashlakov et al., Supercond. Sci. Technol. 18 (2005) 1094.
- [3] F. Gompf et al., Phys. Rev. B 55 (1997) 9058.
- [4] S.V. Shulga et al., Phys. Rev. Lett. 80 (1998) 1730.