Strain-Rate Frequency Superposition (SRFS) - A rheological probe of structural relaxation in soft materials
Abstract
The rheological properties of soft materials often exhibit surprisingly universal linear and non-linear features. Here we show that these properties can be unified by considering the effect of the strain-rate amplitude on the structural relaxation of the material. We present a new form of oscillatory rheology, Strain-Rate Frequency Superposition (SRFS), where the strain-rate amplitude is fixed as the frequency is varied. We show that SRFS can isolate the response due to structural relaxation, even when it occurs at frequencies too low to be accessible with standard techniques.
pacs:
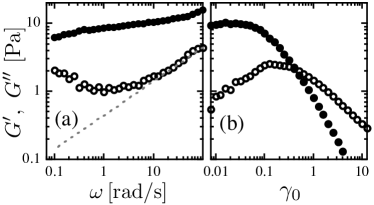
83.60.Bc, 83.60.Of, 83.80.Hj, 83.80.IzConcentrated suspensions Mason and Weitz (1995), pastes Cloitre et al. (2000), emulsions Mason et al. (1995), foams Cohen-Addad et al. (1998), or associative polymer systems Hyun et al. (2002); Daniel et al. (2001) represent commonly encountered examples of soft solids. Their structures are often metastable, with dynamics strongly reminescent of that of glasses. They are thus often termed soft glassy materials Sollich et al. (1997). Despite the wide diversity of these materials, their rheological response, as characterized by the complex shear modulus , is remarkably similar. The storage modulus is only very weakly dependent on frequency. The loss modulus also shows a very weak frequency dependence and is much larger than the response due to the continuous phase fluid. It often exhibits a shallow minimum near the lowest experimentally accessible frequencies. At even lower frequencies, there should be a crossover from solid-like to liquid-like behavior which is signaled by a pronounced peak in , reflecting the structural relaxation. Unfortunately, the relaxation frequencies are often much too low to be accessed by standard linear rheological measurements. A typical example of this linear viscoelastic behavior is shown in Fig. 1(a) for soft hydrogel spheres. Remarkably, the similarities in the rheological response of these materials extend even to nonlinear measurements, characterized by strain-dependent viscoelastic measurements performed at constant , varying the strain amplitude. Above a critical yield strain, the storage modulus exhibits a power-law decay . By contrast, the loss modulus exhibits a well-defined peak, before falling as a power-law ; typically with . The pronounced peak in the loss modulus is a remarkably robust feature of soft glassy materials Mason and Weitz (1995); Mason et al. (1995); Daniel et al. (2001); Hyun et al. (2002); Robertson et al. (2005). The ubiquitousness and similarity of the rheological response, both linear and nonlinear, of so many soft materials suggests that the response is governed by a common underlying mechanism. A possible clue to the origin of this behavior comes from a proposed explanation for the response of a supercooled fluid Miyazaki et al. (2006). Within this picture, the peak in observed in nonlinear measurements is directly related to a decrease of the structural relaxation time with increasing shear rate Sollich et al. (1997); yamamoto1998 ; berthier2002 ; fuchs2002 ; miyazaki2002 ; the applied strain drives the relaxation and forces it to a higher frequency, where it is directly probed. While this picture provides an excellent description of a colloidal supercooled liquid, the underlying physical concept should be much more generally applicable. If this link is verified, the relaxation could be probed using the nonlinear response, even when the relaxation frequency is experimentally inaccessible. This would provide a new probe of the dynamics and rheology of soft materials. However, there have been no attempts to exploit this behavior and explore its general applicability to a variety of different materials.
In this Letter, we show that the typical linear and nonlinear viscoelastic behavior of a wide variety of soft materials can be explained by a common mechanism Sollich et al. (1997); yamamoto1998 ; berthier2002 ; fuchs2002 ; miyazaki2002 . We introduce a new approach to oscillatory rheology; by keeping the strain rate constant during the measurement we can directly probe the structural response. The data exhibits a characteristic scaling, allowing us to clearly isolate and probe the response due to structural relaxation. This new technique, which we call Strain-Rate Frequency Superposition (SRFS), should be generally applicable to the study of many soft materials.
To elucidate the viscoelastic response, we use a system of hydrogel microspheres dispersed in water. They consist of interpenetrating polymer networks of cross-linked poly N-isopropylacrylamide and polyacrylic acid Hu and Xia (2004); Xia and Hu (2004). The sample studied has a polymer weight fraction and at low volume fraction the particles have a radius of . All rheological measurements are performed with a strain-controlled rheometer (ARES), applying an oscillatory strain to the sample and measuring the resultant time-dependent stress .
This system of soft spheres shows the behavior typical of soft materials, both in its linear and nonlinear viscoelastic behavior, including the ubiquitous peak in that typefies the rheology. The measurements shown in Fig. 1 represent the most commonly used types of oscillatory rheological measurements. They depend on two variables only, the frequency and the strain amplitude ; the applied oscillatory strain for each data point is . Frequency dependent measurements [Fig. 1(a)] are usually performed in the linear viscoelastic regime at a constant , while strain dependent measurements [Fig. 1(b)] are perfomed at constant , probing the viscoelastic response at a fixed time scale . However, the probe frequency might not be the only important time scale. Instead, as the strain rate becomes large, it can itself drive the slow structural relaxation process at the time scale of the imposed strain rate. For oscillatory measurements, the natural scale of strain rate is its amplitude . Thus, if a structural relaxation process is present, its time scale should depend on the applied strain rate amplitude,
| (1) |
However, in traditional strain or frequency dependent rheological measurements, the amplitude of the strain rate varies for each data point for both frequency and strain dependent measurements. This makes it difficult to discern the effects of strain rate on the time scale of a structural relaxation process.
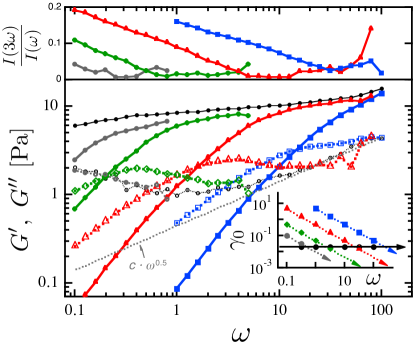
We circumvent this problem by performing frequency dependent rheological measurements at constant strain rate amplitude . This ‘constant rate frequency sweep’ is achieved by applying a strain amplitude that is inversely proportional to the oscillation frequency, as shown in the inset of Fig. 2. We perform a series of such measurements with ranging from to , shown in the main graph of Fig. 2. For comparison, the linear viscoelastic measurement (see Fig. 1) performed at a constant strain amplitude (circles) is also included.
The viscoelastic response depends strongly on the strain rate amplitude. With increasing , the entire frequency dependent response is shifted towards higher , as expected from Eq. (1). Remarkably, however, the general shape of the frequency dependent storage and loss moduli is surprisingly insensitive to . At low frequencies the response is liquid-like: is larger than and both moduli scale with frequency as a power law, with a ratio of between the corresponding exponents. At higher frequencies there is a pronounced peak in the loss modulus, followed by a shallow minimum and a final slow increase at the highest frequencies. The storage modulus rises continuously until it reaches a plateau where it shows only a very weak frequency dependence. The response remains surprisingly harmonic for all our measurements Hyun et al. (2002) with a ratio of the third to the first harmonic component of the response that is always smaller than 20%; in the relevant frequency range around the peak position this ratio is smaller than 10%, as shown in the top graph of Fig. 2. This justifies our treatment of the data in terms of the viscoelastic moduli and .
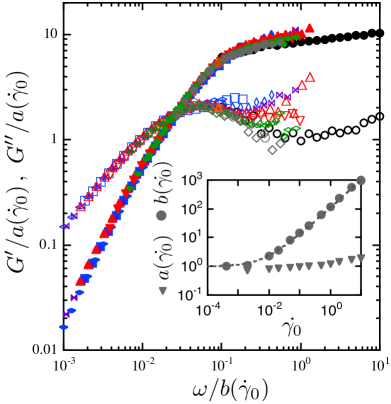
To highlight the striking similarities in the shape of the viscoelastic response, we rescale the moduli in both magnitude and frequency, using , where and are the scaling factors for the magnitude and frequency, respectively. All the data can be superimposed onto a single master curve, as shown in Fig. 3. The scaling factors are plotted in the inset to Fig. 3 as a function of . The value of varies by less than a factor of 3 over the entire range of accessed, whereas the frequency scaling factor depends strongly on . At large strain rates we observe a power-law dependence, , with ; at low strain rates it asymptotically approaches unity, which suggests that in this regime the imposed strain rate is sufficiently low that it no longer impacts the viscoelastic behavior. The rate dependence of the scaling factors is consistent with the behavior expected from Eq. (1), with .
The observed scaling behavior is a direct consequence of a structural relaxation process, which leads to a decrease in and a concomitant peak in in linear viscoelastic measurements. However, this structural relaxation occurs at too low a frequency to be directly observed in the data in Fig. 1(a); nevertheless the incipient behavior is observed in the linear viscoelasticity at low frequencies and is responsible for the peak observed in in the nonlinear behavior.
The structural relaxation time decreases as increases, as expected from Eq. (1). The relaxation peaks in the data shown in Fig. 3 occur when becomes comparable to . To isolate this contribution due to structural relaxation, we must separate the peak from the subsequent rise in the data at higher frequencies. Closer inspection of the data reveals systematic differences between the scaled curves at the highest frequencies. This suggests that a significant contribution to the response does not depend on strain rate at sufficiently high . The high frequency viscoelastic response in compressed emulsions exhibits a -dependence, attributed to viscous flow along randomly oriented slip planes Liu et al. (1996); this results in a contribution that scales as . The high frequency linear response of our system shows the same behavior, as shown by the dashed line in Fig. 1(a). We thus subtract a component from each of the data sets, where the constant is determined from a fit to the high response; a single value of is used for all the data, independent of . The resultant loss moduli now exhibit well defined peaks, as shown in Fig. 4(a); the component subtracted is also shown as the dashed line.
The shapes of the resulting relaxation peaks are remarkably similar at each value of . To highlight this, we scale all the data onto a single master curve by rescaling the frequency, as shown by the uppermost data set in Fig. 4(b); because we have subtracted the component, we do not need to scale the amplitude. The scaling of the data suggests that the shape of the relaxation spectrum remains unchanged as the strain rate amplitude is varied. This should provide important new insight about the nature of the relaxation and the distribution of time scales that make up the peak.

The observed scaling suggests that can be expressed as a function of frequency and strain amplitude:
| (2) |
where describes the functional form of the linear viscoelastic behavior due to the structural relaxation process, and describes high frequency contributions that are independent of ; caution must be used for , where the slowest relaxation must dominateWyss (2006). This expression for reflects both the linear and the incipient nonlinear response of the system. For low enough values of strain, Eq. (2) describes the complex modulus in the linear viscoelastic regime, with . At larger strains, the structural relaxation shifts towards higher frequencies, scaling as . This allows us to establish a direct link between linear and nonlinear rheology through the strain-rate dependence of the structural relaxation time. To further illustrate the physical origin of this link, we provide a schematic movie in the supplemental informationWyss (2006).
Our results provide an important new measurement technique for probing the rheological properties of soft materials. By maintaining a constant strain-rate amplitude during our measurement, we can isolate the structural relaxation; by varying the amplitude of the strain rate, we force the frequency of this structural relaxation into a regime accessible to the rheometer. This allows us to directly probe this structural relaxation, even if it is at a frequency too low to be easily accessible. By scaling the data, we highlight the low-frequency contributions of the structural relaxation. A wide variety of soft materials exhibit such a low-frequency structural relaxation; thus, this method should be very broadly applicable. To illustrate this generality, we perform similar experiments on several representative samples of soft materials, and isolate the structural relaxation by scaling the peak data onto master curves. Similar behavior is observed for all samples as shown in Fig. 4(b), where we plot master curves obtained for a compressed emulsion (80% silicon oil drops of m dia in water, stabilized by 10 mM SDS), a foam (Gillette Foamy), and a hard-sphere colloidal suspension (PMMA in cycloheptylbromide/decalin). In all cases, good scaling is observed; moreover, differences in shape are also apparent, reflecting different contributions to the relaxation spectrum.
The scaling employed here is reminiscent of an approach that has been successfully employed for polymer melts. Rheological measurements of and for different temperatures are shifted onto a single master curve that reflects the viscoelastic behavior in a dramatically extended range of frequencies. This technique is called time-temperature superposition (TTS) Heijboer (1956); Ferry (1980). By analogy, we call our approach strain-rate frequency superposition (SRFS). With SRFS, we can obtain detailed information on the strain rate dependence of the slow relaxation process. Our picture combines linear and nonlinear oscillatory rheology into a unified picture, thereby accounting for the unusual behavior typically observed in many soft materials. Our experimental results show that nonlinear viscoelastic measurements contain useful information on the slow relaxation dynamics of these systems. Their yielding behavior directly probes the structural relaxation process itself, shifted towards higher frequencies by an applied strain rate. Physically, this suggests that this structural relaxation, driven by an imposed strain rate, results in the same response as the equilibrium structural relaxation at a much lower frequency. This is a surprising result, as for the steady shear case theoryfuchs2002 suggests a rate-dependent change of the high frequency flank of the relaxation; for the systems studied we do not observe this in our oscillatory measurements. By exploiting this behavior, SRFS isolates the shape of the structural relaxation, even if it is too slow to be accessed with conventional oscillatory rheology. Thus, SRFS will provide new insight into the physical mechanisms that govern the viscoelastic response of a wide range of soft materials.
This work was supported by the NSF (DMR-0507208, DMR-0602684, CHE-0134969), the Harvard MRSEC (DMR-0213805), the Hans Werthén, the Wenner-Gren, and the Knut, and Alice Wallenberg Foundations.
References
- Mason and Weitz (1995) T. G. Mason and D. A. Weitz, Phys. Rev. Lett. 75, 2770 (1995).
- Cloitre et al. (2000) M. Cloitre, R. Borrega, and L. Leibler, Phys. Rev. Lett. 85, 4819 (2000).
- Mason et al. (1995) T. G. Mason, J. Bibette, and D. A. Weitz, Phys. Rev. Lett. 75, 2051 (1995).
- Cohen-Addad et al. (1998) S. Cohen-Addad, H. Hoballah, and R. Höhler, Phys. Rev. E 57, 6897 (1998).
- Daniel et al. (2001) C. Daniel, I. W. Hamley, M. Wilhelm, and W. Mingvanish, Rheologica Acta 40, 39 (2001).
- Hyun et al. (2002) K. Hyun, S. H. Kim, K. H. Ahn, and S. J. Lee, J. Non-Newtonian Fluid Mech. 107, 51 (2002).
- Robertson et al. (2005) C. G. Robertson, X. Wang, Phys. Rev. Lett. 95, 075703 (2005).
- Sollich et al. (1997) P. Sollich, F. Lequeux, P. Hébraud, and M. E. Cates, Phys. Rev. Lett. 78, 2020 (1997).
- Miyazaki et al. (2006) K. Miyazaki, H. M. Wyss, D. A. Weitz, and D. R. Reichman, Europhys. Lett. 75, 915 (2006).
- (10) R. Yamamoto and A. Onuki, Phys. Rev. E 58, 3515 (1998).
- (11) L.. Berthier and J. -L. Barrat, J. Chem. Phys. 116, 6228 (2002).
- (12) M. Fuchs and M. E. Cates, Phys. Rev. Lett. 89, 248304 (2002); Faraday Discuss.123, 267 (2003).
- (13) K. Miyazaki and D. R. Reichman, Phys. Rev. E 66, 050501(R) (2002); K. Miyazaki, D. R. Reichman, R. Yamamoto, Phys. Rev. E 70, 011501 (2004).
- Hu and Xia (2004) Z. Hu and X. Xia, Advanced Materials 16, 305 (2004).
- Xia and Hu (2004) X. Xia and Z. Hu, Langmuir 20, 2094 (2004).
- Liu et al. (1996) A. J. Liu, S. Ramaswamy, T. G. Mason, H. Gang, and D. A. Weitz, Phys. Rev. Lett. 76, 3017 (1996).
- Wyss (2006) H. M. Wyss et al., to be published.
- Wyss (2006) See EPAPS Document No. […..] for supplemental information. For more information on EPAPS, see http://www.aip.org/pubservs/epaps.html.
- Heijboer (1956) J. Heijboer, Kolloid Zeitschrift 148, 36 (1956).
- Ferry (1980) J. D. Ferry, Viscoelastic Properties of Polymers, 3rd Edition (Wiley, New York, 1980).