Electronic structure and band characteristics for zinc monochalcogenides with zinc-blende- and wurtzite-type structures are studied by first-principles density-functional-theory calculations with different approximations. It is shown that the local-density approximation underestimates the band gap and energy splitting between the states at the top of the valence band, misplaces the energy levels of the Zn-3 states, and overestimates the crystal-field-splitting energy. The spin-orbit-coupling energy is found to be overestimated for both variants of ZnO, underestimated for ZnS with wurtzite-type structure, and more or less correct for ZnSe and ZnTe with zinc-blende-type structure. The order of the states at the top of the valence band is found to be anomalous for both variants of ZnO, but is normal for the other zinc monochalcogenides considered. It is shown that the Zn-3 electrons and their interference with the O-2 electrons are responsible for the anomalous order. The effective masses of the electrons at the conduction-band minimum and of the holes at the valence-band maximum have been calculated and show that the holes are much heavier than the conduction-band electrons in agreement with experimental findings. The calculations, moreover, indicate that the effective masses of the holes are much more anisotropic than the electrons. The typical errors in the calculated band gaps and related parameters for ZnO originate from strong Coulomb correlations, which are found to be highly significant for this compound. The local-density-approximation with multiorbital mean-field Hubbard potential approach is found to correct the strong correlation of the Zn-3 electrons, and thus to improve the agreement between the experimentally established location of the Zn-3 levels and that derived from pure LDA calculations.
Coulomb correlation effects in zinc monochalcogenides
pacs:
71.15.-m; 71.22.+iI Introduction
Wide band-gap semiconductors are very important for applications in optical devices such as visual displays, high-density optical memories, transparent conductors, solid-state laser devices, photodetectors, solar cells etc. The functional usefulness of such devices of the zinc monochalcogenides depends on electronic properties at the point at the valence-band (VB) maximum and conduction-band (CB) minimum (recalling that these compounds have direct band gaps). Therefore, first-principles calculations for these compounds are of considerable importance.
Up to now, most ab initio studies have been based on the density-functional theory (DFT)Hohenberg and Kohn (1964) in the local-density approximation (LDA).Kohn and Sham (1965) For many materials, the theory provides a good description of ground-state properties. However, problems arise when the DFT–LDA approach is applied to materials with strong Coulomb correlation effects,Anisimov et al. (1993); Dudarev et al. (1998); Bengone et al. (2000) traceable back to the mean-field character of the Kohn–Sham equations as well as to the poor description of strong Coulomb correlation and exchange interaction between electrons in the narrow band. One of the problems is that the LDA error in calculation of the band gap becomes larger than the common LDA error. Several attempts have been made to include the correlation effects in the DFT–LDA calculations. The LDA plus self-interaction correction (LDA+)Svane and Gunnarsson (1990); Lambrecht et al. (2002); Vogel et al. (1995, 1996); Dong et al. (2004) eliminates the spurious interaction of an electron with itself as occurring in the conventional DFT–LDA. This approach has been widely used to study compounds with completed semicore- shells,Lambrecht et al. (2002); Vogel et al. (1995, 1996); Qteish (2000); Persson and Zunger (2003); Dong et al. (2004) and it is found to lower the Zn-3 levels derived from the simple LDA, thus giving better agreement with the measured X-ray emission spectra (XES) and effective masses of carriers.Lambrecht et al. (2002); Vogel et al. (1995, 1996); Persson and Zunger (2003) The calculated value of the band gap () then falls within the established error limits for the LDA.Lambrecht et al. (2002); Vogel et al. (1995, 1996); Agrawal et al. (1994); Dong et al. (2004)
Another promising approach for correlated materials is the so-called LDA plus multiorbital mean-field Hubbard potential (LDA+),Anisimov et al. (1993); Dudarev et al. (1998); Bengone et al. (2000) which includes the on-site Coulomb interaction in the LDA Hamiltonian. After adding the on-site Coulomb interaction to the L(S)DA Hamiltonian, the potential becomes spin and orbital dependent. The LDA+, although being a mean-field approach, has the advantage of describing both the chemical bonding and the electron–electron interaction. The main intention of the LDA+ approach is to describe the electronic interactions of strongly correlated states. Such a computational procedure is widely used to study materials with ions that contain incomplete or shells, e.g., transition-metal oxides, heavy fermion systems etc.Anisimov et al. (1993); Dudarev et al. (1998); Bengone et al. (2000) Recently, such approach has been applied to ZnOJanotti and Van de Walle (2006); Park and Min (2003); Feng (2004); Karazhanov et al. (2006) with completed semicore-Zn-3 valence shell. However, it is concluded in Refs. Park and Min, 2003; Feng, 2004 that LDA+ calculations, in principle, should not have improved the size of the because the Zn-3 bands are located well below the Fermi level ().
Despite the required large sized computations, different versions of the GW approximationHedin (1965); Hybertsen and Louie (1985) have also been used to study zinc monochalcogenides.Usuda et al. (2002); Luo et al. (2002); Oshikiri and Aryasetiawan (2000); Rinke et al. (2005) (“G” stands for one-particle Green’s function as derived from many-body perturbation theory and “W” for Coulomb screened interactions.) This approximation can take into account both non-locality and energy-dependent features of correlations in many-body system and can correctly describe excited-state properties of a system by including its ionization potential and electron affinity. Band-structure studies using the the GW correction show that is underestimated by 1.2 eV for ZnO,Usuda et al. (2002) by 0.53 eV for ZnS,Luo et al. (2002) and by 0.55 eV for ZnSe.Luo et al. (2002) However, the GW calculations in Ref. Oshikiri and Aryasetiawan, 2000 overestimated for ZnO by . Recent studiesFleszar and Hanke (2005) of Zn, Cd, and Hg monochalcogenides by the GW approach has shown that the band-gap underestimation is in the range 0.3–0.6 eV. Incorporation of the plasmon–pole model for screening has lead to systematic errors. Combination of exact exchange (EXX) DFT calculations in the optimized-effective-potential approach with GW is foundRinke et al. (2005) to give better agreement with the experimental band gaps and the location of the Zn-3 levels. Recently, excellent agreement with experiment was achieved by all-electron full-potential EXX calculationsSharma et al. (2005) for locations of the bands for a number of semiconductors and insulators (Ge, GaAs, CdS, Si, ZnS, C, BN, Ne, Ar, Kr, and Xe), although the band gap was not as close to experimental data as found in other pseudopotential EXX calculations.
Despite intense studies, many of the fundamental properties of these materials are still poorly understood and further experimental and theoretical studies are highly desirable. One target is the so-called eigenvalue problem. For example, LDA underestimates Eg for ZnO,Oshikiri and Aryasetiawan (2000); Usuda et al. (2002); Park and Min (2003); Feng (2004); Karazhanov et al. (2006) ZnS,Luo et al. (2002) and ZnSe,Luo et al. (2002) by more (in fact by ) than expected for a typical LDA error. Also, the actual positions of the Zn-3 levels,Oshikiri and Aryasetiawan (2000); Usuda et al. (2002); Park and Min (2003); Feng (2004); Karazhanov et al. (2006); Luo et al. (2002) the band dispersion, crystal-field splitting (), and spin-orbit coupling splitting ()Lambrecht et al. (2002); Karazhanov et al. (2006) are not reproduced correctly. Neither the use of the generalized-gradient approximation (GGA) nor the inclusion of SO coupling into the calculations seems able to remedy the above shortcomings.Jaffe et al. (2000); Park and Min (2003); Karazhanov et al. (2006)
The effective masses of the charge carriers are more indefinite parameters for the zinc monochalcogenides. Owing to low crystal quality only a few cyclotron resonance experiments have been performed for ZnO,Imanaka et al. (2001); Oshikiri et al. (1996) ZnS,Madelung (1992); Xu and Ching (1993) and ZnTe.Clerjaud et al. (1979) The status for the present situation is that effective masses from different ab initio packages and experiments scatter appreciably in publications on ZnO (Refs. Lambrecht et al., 2002; Xu and Ching, 1993; Imanaka et al., 2001; Oshikiri et al., 1996; Lew Yan Voon et al., 1996; Hümmer, 1973; Oshikiri et al., 2002) and ZnTe (Refs. Madelung, 1992; Clerjaud et al., 1979; Nahory and Fan, 1967).
In this work zinc monochalcogenides (Zn= O, S, Se, Te) in the zinc-blende-(z-) and wurtzite-(w-)type structural arrangements are studied by first-principles calculations within the LDA, GGA, and LDA+ approaches with and without SO coupling.
II Computational details
The electronic band structure of the Zn-z and -w phases is studied using the VASP–PAW packageKresse and Furthmüller (1996), which calculates the Kohn–Sham eigenvalues within the framework of DFT.Hohenberg and Kohn (1964) The calculations have been performed with the use of the LDA,Kohn and Sham (1965) GGA,Perdew et al. (1996) and simplified rotationally invariant LDA+Anisimov et al. (1993); Dudarev et al. (1998) approaches. The exchange- and correlation-energy per electron have been described by the Perdew–Zunger parametrizationPerdew and Zunger (1981) of the quantum Monte Carlo procedure of Ceperley–Alder.Ceperley and Alder (1980) The interaction between electrons and atomic cores is described by means of non-norm-conserving pseudopotentials implemented in the VASP package.Kresse and Furthmüller (1996) The pseudopotentials are generated in accordance with the projector-augmented-wave (PAW) method.Blöchl (1994); Kresse and Joubert (1999) For the PAW method, high-precision energy cutoffs have been chosen for all the Zn phases considered. The use of the PAW pseudopotentials addresses the problem of the inadequate description of the wave functions in the core region common to other pseudopotential approaches.Adolph et al. (2001) The application allows us to construct orthonormalized all-electron-like wave functions for the Zn-3, -4 and anion- and - valence electrons of the zinc monochalcogenides under consideration.
Self-consistent calculations were performed using a mesh frame according to Monkhorst–Pack scheme for z-type structures and a similar density of points in the -centered grids for w-type phases. The completly filled semicore-Zn-3 states have been considered as valence states.
For band-structure calculations we used the experimentally determined crystal-structure parameters (Table 1) for all phases considered. The ideal positional parameter for in the w-type structures is calculated on the assumption of equal nearest-neighbor bond lengths:Lew Yan Voon et al. (1996)
| (1) |
The values of for the ideal case agree well with the experimental values (see Table 1). The unit-cell vectors of the z-type structures are , is the cubic lattice constant, and there are four Zn formula units per unit cell specified by Zn at and at . In the w-type structure, the lattice vectors are , is the axial ratio, and there are two Zn formula units per hexagonal unit cell, Zn at and and at and .
The values of the and parameters were calculated within the constrained DFT theory.Pickett et al. (1998) Furthermore, the position of the Zn-3 bands was calculated as a function of using the LDA+ method, and was derived semiempirically on forcing match to the experimentally establishedRuckh et al. (1994) location of the Zn-3 bands. The thus obtained empirical values of were used to explore further the electronic structure within the LDA procedure.
Values of , , and the average band gap for ZnO (with anomalous order of the states at the top of the VB) are calculated from the expressions:Hopfield (1960); Mang et al. (1995)
| (2) | |||||
| (3) |
where and are energy gaps determined from ab initio calculations and , and . To calculate these parameters for the other Zn phases, and for ZnO with normal order of the states at the top of the VB, and in Eq. 3 have been exchanged.
For investigation of the order of the states at the top of the VB for ZnO in z- and w-type structural arrangements, band-structure calculations have been performed using the MindLab package,Savrasov (1996) which uses the full potential linear miffin-tin orbital (FP-LMTO) method, and by the WIEN2K code,Blaha et al. (2001) which is based on a full-potential linearized-augmented plane-wave method.
III Results and discussions
III.1 The electronic structure at the top of VB
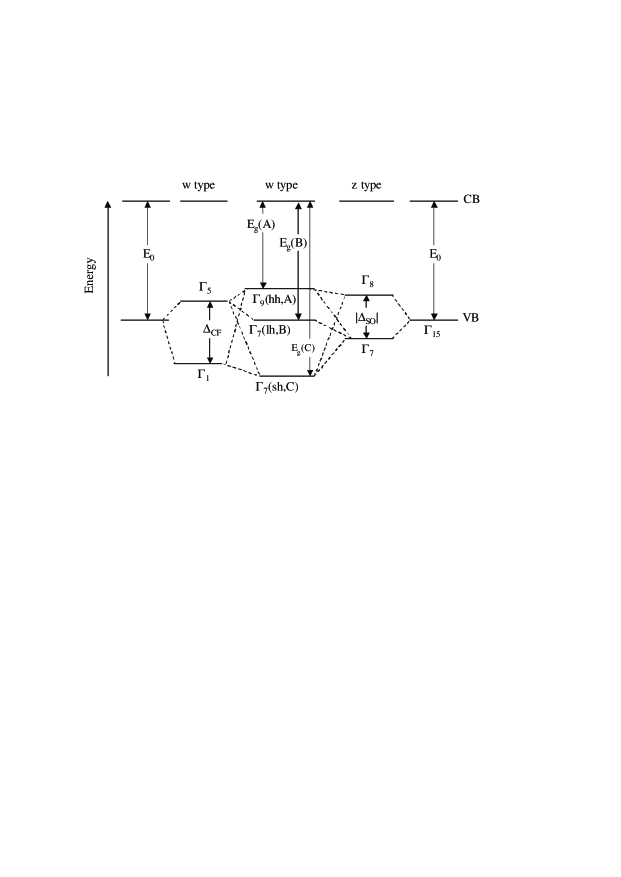
Important optical and transport properties for semiconductors are determined by the carriers close to in the vicinity of the point. The VB spectrum near the point is different for z- and w-type materials. Without SO coupling the top of the VB for phases with w-type structure is split into a doublet and a singlet state by the crystal field (Fig. 1). The is a -like state, while is a -like state. Inclusion of SO coupling gives rise to three twofold degenerate bands in the VB, which are denoted as (heavy holes), (light holes), and (spin-split-off holes) (Fig. 1). These states correspond to , , and exciton lines in photoluminescence experiments.Mang et al. (1995) The symmetry of two of these three bands are of character and one of character. The state derived from will obtain a slight admixture of while stays unmixed and like. For ZnO, these bands calculated within LDA, GGA, and LDA+ for eV, are in the order of decreasing energy , and , which is referred to as anomalous order, resulting from a negative .Rowe et al. (1968) For eV the lower state interchanges with , so the order becomes , and . For the other Zn-w phases the sequence is , named as normal order,Thomas and Hopfield (1959) and the order was not changed by LDA+. Without SO coupling the VB spectrum near the point for the Zn-z phases originates from the sixfold degenerate state. The SO interaction splits the level into fourfold degenerate ( and ) and doubly degenerate () levels.
III.2 Band structure
Initial band-structure calculations have been performed for ZnO-w using three different pseudopotentials for the oxygen atom supplied with the VASP package: ordinary, soft, and high-accuracy oxygen pseudopotentials. Band dispersion, band gaps and , , and corresponding to these oxygen pseudopotentials do not differ significantly from each other and the subsequent calculations were performed using the ordinary oxygen pseudopotential.
Band-parameter values calculated with or without taking SO couplings into consideration are listed in Table LABEL:band-gap. Band gaps and the mean energy level of Zn-3 electrons from LDA calculations are underestimated, while is overestimated compared to the experimental data. The DFT-LDA error is quite pronounced for ZnO compared to the other Zn phases and the discrepancy exceeds the usual error for LDA calculations. The discrepancies in the calculated values for ZnO compared to experimental values are unacceptably large. Except for ZnO, the calculated values within the different approaches do not differ much, emphasizing that Coulomb correlation effects are more pronounced for ZnO than ZnS, ZnSe, and ZnTe.
The calculations show (Table LABEL:band-gap) that is much smaller than 1.0 eV for all phases except ZnSe-z ( eV) and ZnTe-z ( eV). The SO coupling energy calculated for ZnO-z and -w within LDA and GGA, is negative, while it is positive for the other Zn phases. The numerical value of calculated within the three approaches considered came out close to each other for all Zn phases. The numerical value of is severely underestimated for ZnO-w and ZnS-w compared to experimental data. Our values for the other Zn-z phases in Table LABEL:band-gap are in good agreement with theoretical calculationsCarrier and Wei (2004) by the LAPW method and the available experimental data.
III.3 Density of states
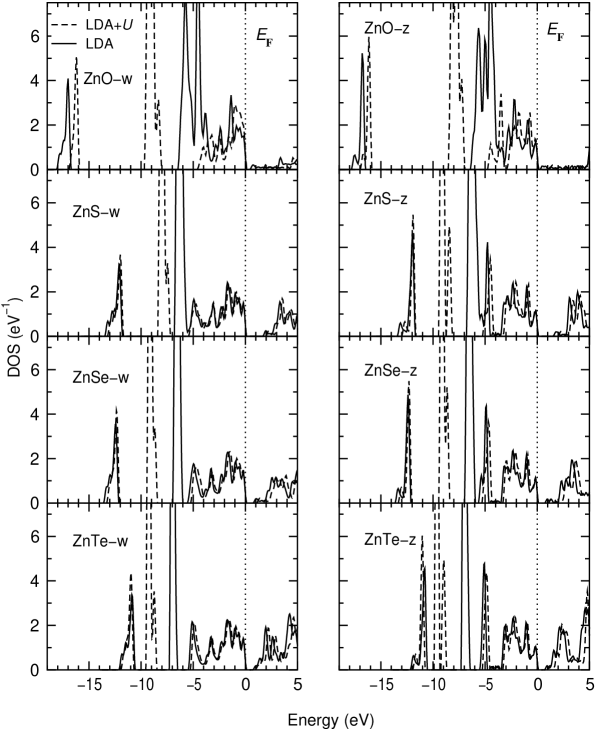
Analysis of the density of states (DOS) for the Zn phases (Fig. 2), calculated within the LDA, shows that the Zn-3 states are inappropriately close to the CB, which contradicts the findings from XPS, XES, and UPS experiments.Ley et al. (1974); Vesely and Langer (1971); Ruckh et al. (1994) Furthermore, these states and the top of the VB are hybridized. Distinct from the other Zn phases considered, ZnO in both z- and w-type structure shows artificially widened Zn-3 states. These discrepancies indicate strong Coulomb correlation between narrow Zn-3 states which is not accounted for correctly in the LDA calculations. As a consequence, the interactions of the semicore-Zn-3 states with O-2 in VB are artificially enlarged, the band dispersions are falsified, the widths of the O- and Zn-3 bands are altered, and the latter are shifted inappropriately close to the CB. These findings indicate that correlation effects of the Zn-3 states should be taken into account to obtain a more proper description of the electronic structure for the Zn phases, especially for the z- and w-type variants of ZnO.
The simplified rotationally invariant LDA approachAnisimov et al. (1993); Dudarev et al. (1998) has been used to correct the strong correlation of the Zn-3 electrons. This approach uses and to describe the strong Coulomb correlation, but since these parameters do not explicitly take into account the final state, we did not regard the regular LDA+ approach as sufficiently rigorous, and we therefore rather preferred empirically assigned and values. For comparison, the values of and have been calculated for some of the compounds within the constrained DFTPickett et al. (1998) (Table 3), showing that the calculated values to some extent agrees with those extracted semiempirically.
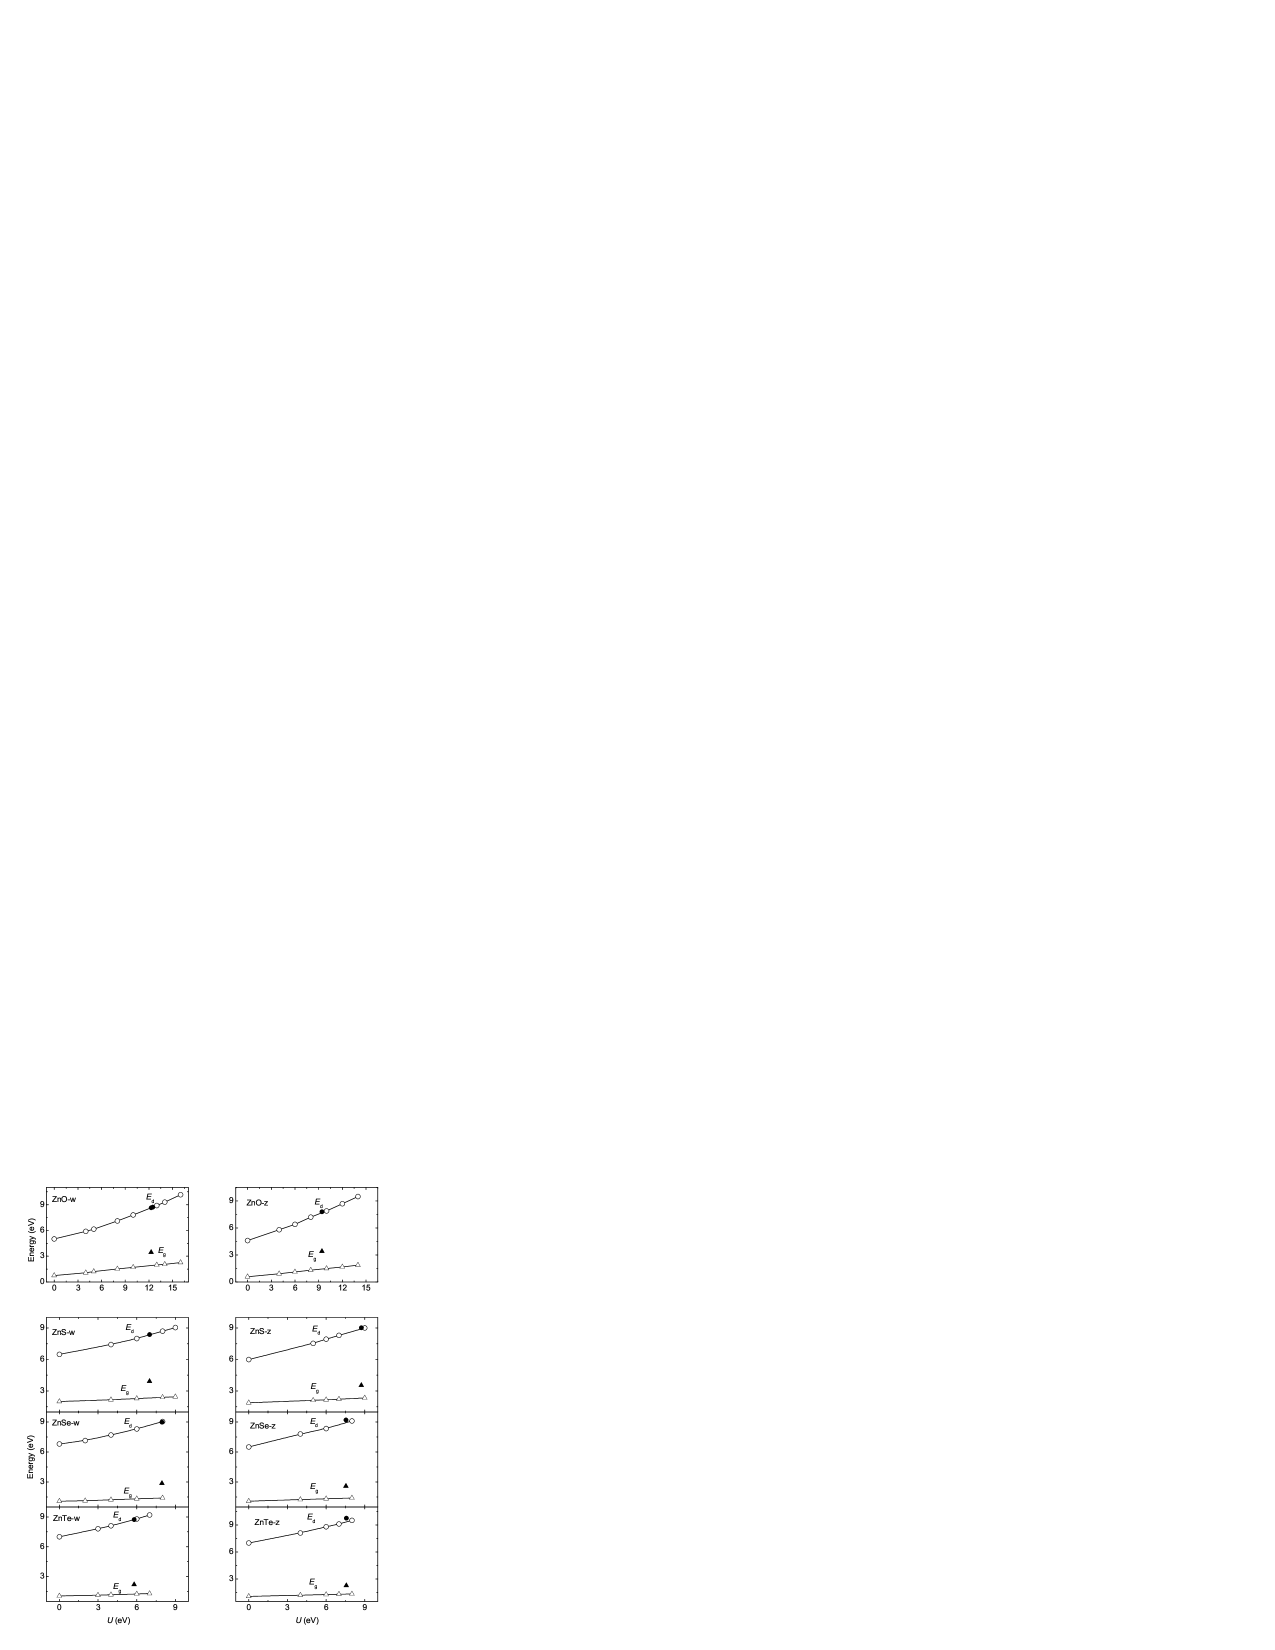
Using the semiempirical values for the parameters and , band-structure calculations have been performed within LDA+. Figure 3 shows the dependence of the Zn-3 mean level () and of the Zn phases on . Analysis of the illustrations show that the LDA+-derived band gaps are more reasonable than the pure LDA-derived band gaps (see also Table LABEL:band-gap). Moreover, the deviation of the values obtained using LDA+ from those obtained by experiments are much smaller than those calculated using the pure LDA (Fig. 2 and Table LABEL:band-gap).
The values of the peaks in the DOS (Fig. 2), corresponding to the Zn-3 states calculated by the LDA+, are much larger than those calculated using the pure LDA. This indicates that according to the LDA+ the semicore-Zn-3 electrons become more localized than according to the pure LDA. Distinct from the other Zn phases considered, the width of the Zn-3 bands for ZnO calculated by LDA+ become much narrower than that calculated by LDA (Fig. 2). However, LDA+ only slightly changed the width of the Zn-3 bands of the other Zn phases, which leads one to conclude that the Coulomb correlation effects for ZnO is more pronounced than for the other compounds considered.
III.4 Order of states at the top of VB
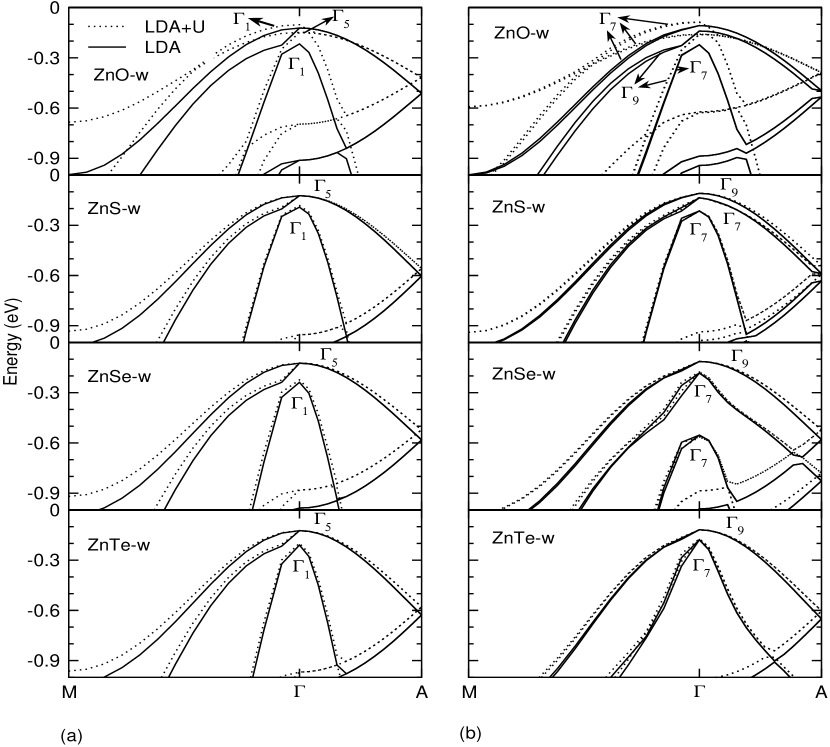
The order of states at the top of VB in ZnO-w is a frequently debated topic at present (see, e.g., Refs. Reynolds et al., 1999; Lambrecht et al., 2002; Reynolds et al., 2001). The present project has addressed this problem for the Zn phases by LDA, GGA, and LDA+ calculations within the VASP, MindLab, and WIEN2K packages with and without including the SO couplings. The results obtained by LDA and LDA+ within VASP are presented in Figs. 4 and 5. By inspection of the degeneracy of the eigenvalues it is found that the normal order of the states at the top of VB is obtained by LDA without SO coupling for all Zn-w phases. The same order was obtained by calculations within GGA. However, upon using the LDA+ approach with the semiempirical values for the parameter (Table 3) the order of the states at the top of VB for the ZnO-w is changed, while there appears no changes for the other Zn phases.
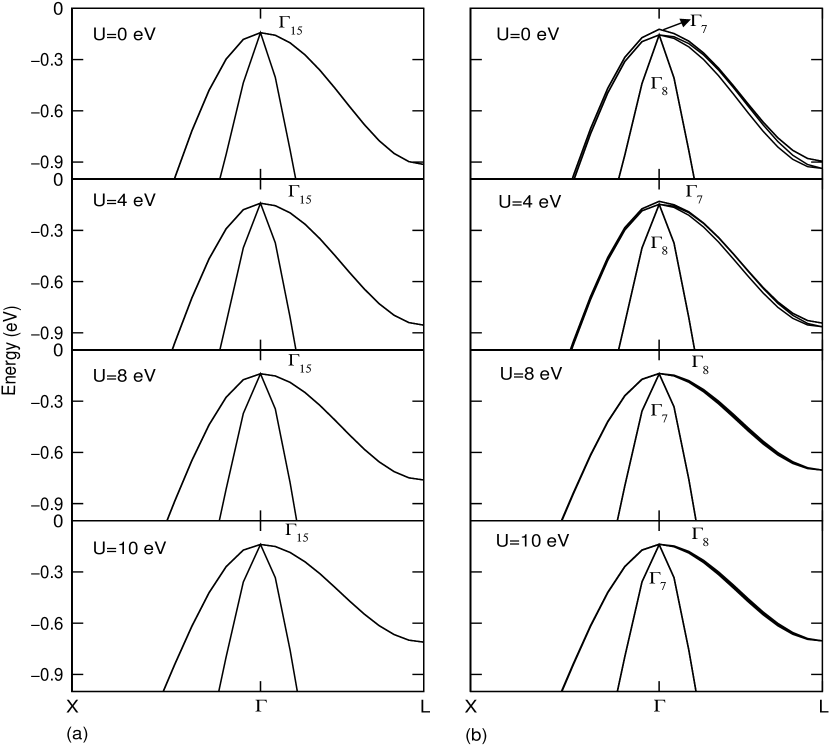
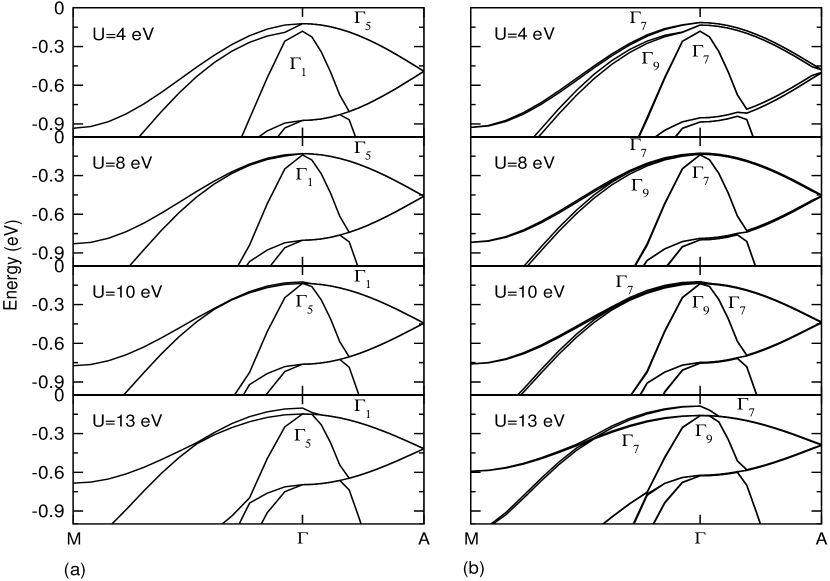
The variations in the order of the states at the top of the VB on are systematically studied for the ZnO-z (Fig. 6) and ZnO-w (Fig. 7) phases, with and without including SO coupling. It is found that at eV, the LDA+ without SO coupling interchanges the sequence of the VB states from to .
Since one can treat the semicore-Zn-3 electrons as core electrons and freeze their interaction with VB in theoretical calculations, we studied the VB structure of ZnO using the MindLab packageSavrasov (1996) including the semicore-Zn-3 electrons in the core. On this assumption one obtains the order at the top of the VB for ZnO-w. Hence, the order of the states in this case can be traced back to the treatment of the Zn-3 electrons. On comparing the structures at the top of the VB calculated within the LDA and GGA approaches it is found that only quantitatively small changes have occurred. Hence, inhomogeneities in the electron gas do not affect the order of the states at the top of VB, and only slightly change the band dispersion.
On the involvement of the SO coupling, the and states of ZnO-w are split into two and one states (see Fig. 1). Orbital decomposition analysis was performed to establish the origin and order of these states using the band structure calculated according to the WIEN2K package.Blaha et al. (2001) The order of the states was found to be (LDA, GGA, and LDA+ ( eV) calculations), viz. “anomalous” order.Rowe et al. (1968); Lambrecht et al. (2002); Lew Yan Voon et al. (1996); Thomas (1960); Shindo et al. (1965)
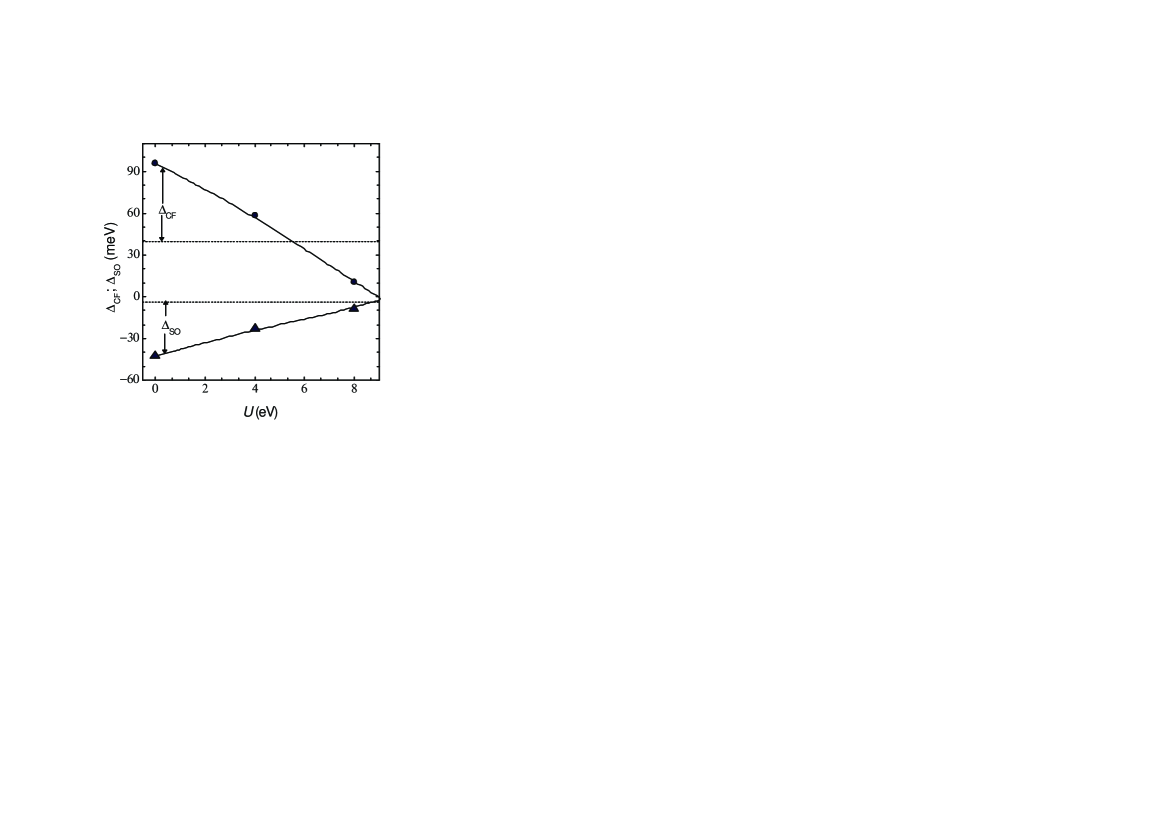
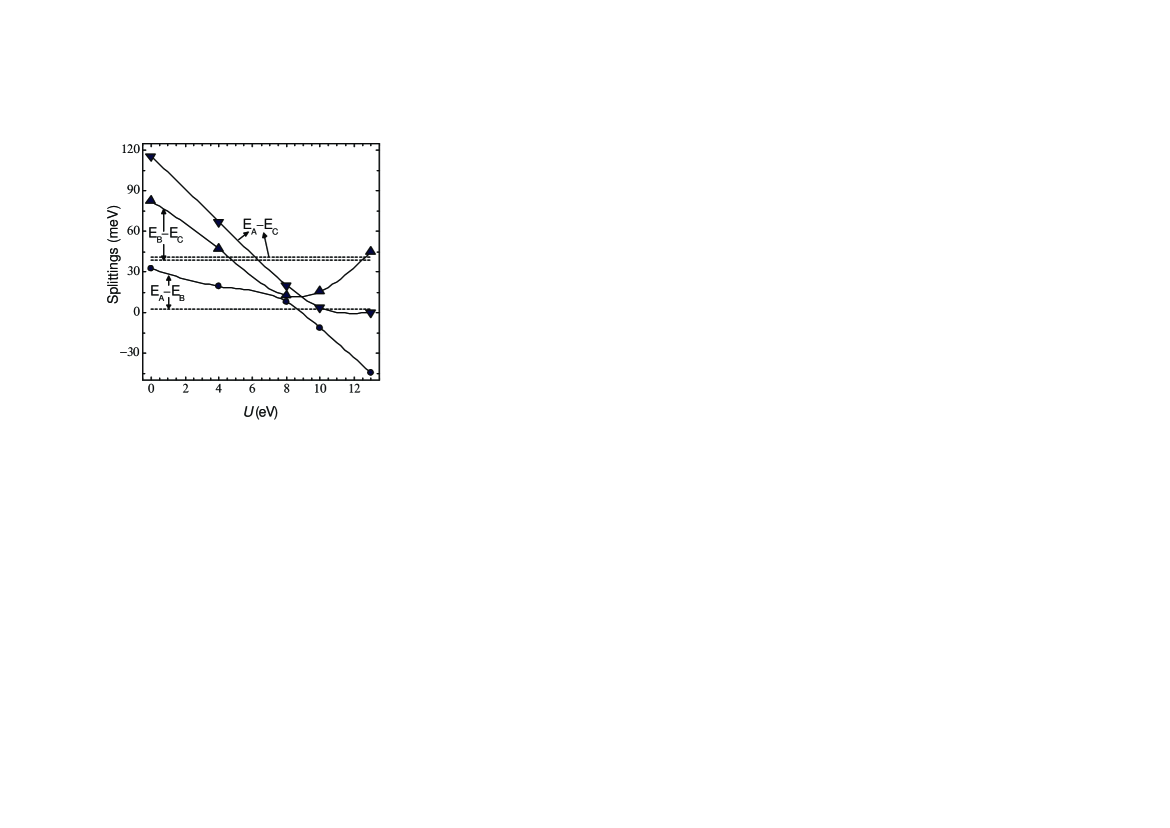
The above analysis shows that among the Zn phases considered, ZnO are most sensitive to Coulomb correlation effects. The values for extracted from the – splitting according to the LDA without SO coupling are positive and decrease with increasing (Fig. 8). Correspondingly, obtained on including the SO coupling came out negative and increased in size with increasing . The order of the states is in this case anomalous (), thus supporting findings according to the model of Thomas (see Refs. Rowe et al., 1968; Lambrecht et al., 2002; Lew Yan Voon et al., 1996; Shindo et al., 1965; Thomas, 1960).
At high values of ( eV), becomes negative, which indicates inversion from to in the order of the states at the top of VB without the SO coupling. Upon inclusion of the SO coupling the order becomes , which does not agree with either of the two models for the order of states. At present the safest conclusion is that the parameter takes a value below 9.0 eV and that the order of the states at the top of VB consequently must be classified as anomalous.
The variation of the energy splitting of the and states, expressed by and in the VB for ZnO-z and -w as a function of is displayed in Fig. 8. For values of below eV the energy splitting decreases with increasing . At higher values of becomes negative and decreases, increases, while stays more or less constant.
Distinct from ZnO-w, the other Zn-w phases exhibit a normal order of the states at the top VB ( and without and with the SO coupling, respectively). This order does not change upon variation of the value of in the LDA+ calculations.
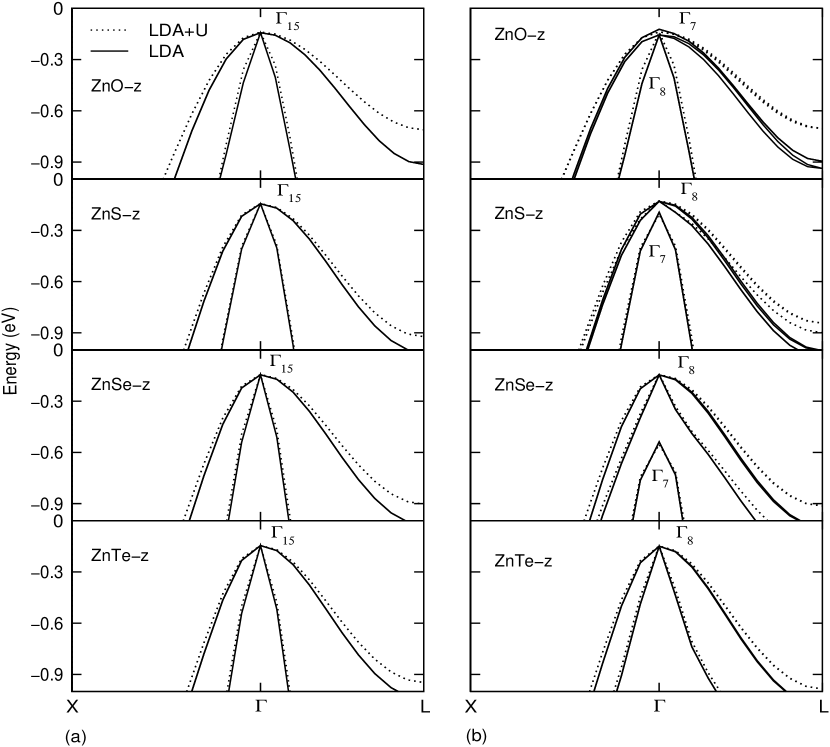
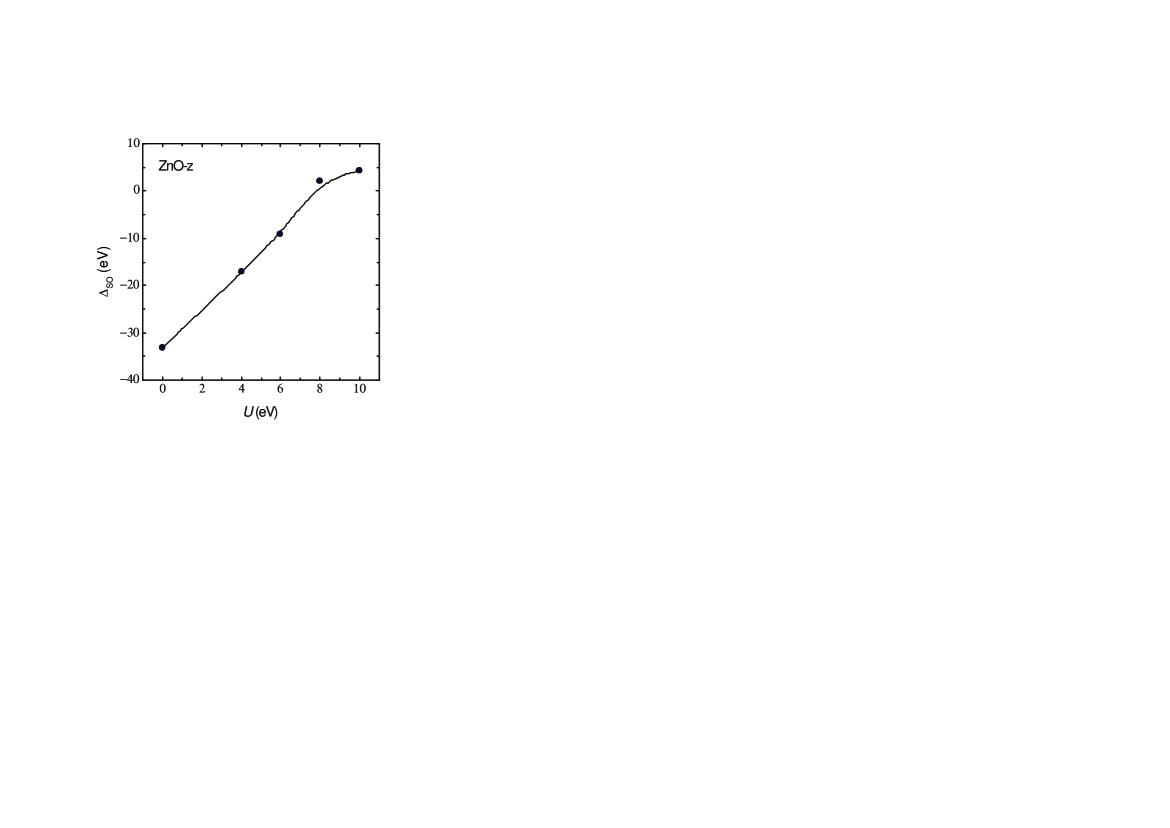
Without introduction of the SO coupling, the top of the VB for the Zn-z phases is triple degenerate (see Figs. 1 and 5). When the SO coupling is included in the consideration, the VB maximum is split in fourfold () and twofold () states with the normal order for = S, Se, and Te. However, the order is anomalous for ZnO-z () and in addition becomes negative. The dependence of on is shown in Fig. 10, revealing that for eV becomes positive, and consequently that normal order is restored for the states at the top of VB. So, one can ascribe the anomalous order of the states at the top of VB in ZnO-z to Coulomb correlation effects related to the Zn-3 electrons.
For all cases considered, the GGA approximation did not influence the order. Hence, inhomogeneities in the distribution of the electron gas do not play a significant role for the order of the states at the top of VB.
IV Effective masses
The CB states with short wave vectors () are doubly degenerate with respect to spin and can be characterized by one or two energy-independent effective masses for the z- and w-type arrangements. The effective masses are calculated along the directions , and within the LDA, GGA, and LDA+ approaches with and without including the SO couplings (Tables LABEL:wem and LABEL:zem). According to the conventional notations carrier effective masses for the Zn-z phases are distinguished by the indices , , , and , corresponding to , and and to . The carrier masses for the Zn-w phases are distinguished by the indices , , , and .
The calculated for the Zn-z phases are more isotropic than those for the Zn-w phases. The numerical values of for ZnO-w, ZnS-w, ZnSe-z, and ZnTe-z obtained by the LDA are underestimated by about 50 compared to experimental findings,Hümmer (1973); Madelung (1992); Oshikiri et al. (1996); Imanaka et al. (2001) while those for the other Zn phases agree fairly well with experimental data. GGA and LDA+ calculations only slightly improved the LDA-derived values for all Zn phases except ZnO, whereas the latter showed much better agreement with LDA+. This indicates once again that correlation effects are more pronounced for ZnO than for the other phases considered.
The electron effective mass is smaller along the direction than along and . This feature can be important in film and superlattice constructions of these phases.Xu and Ching (1993) The heavy holes along all directions (see Tables LABEL:wem and LABEL:zem) and light holes along the direction are much heavier than other holes and, in particular, CB electrons. For example, the carrier transport in ZnO is dominated by electrons, while that by holes can in practice be ruled out. This in turn explains the experimentally established large disparityMadelung (1992) between electron and hole mobilities, and also may explain the large optical non-linearity in ZnO.Xu and Ching (1993) The effective masses of the holes are more anisotropic than those of electrons, which can be traced back to states at the top of VB associated with O- orbitals, and this can give rise to anisotropy in parameters like carrier mobility.Šantić (2003)
On comparison of the values in Tables LABEL:wem and LABEL:zem one sees that the influence of SO coupling on is very important for ZnSe-z and ZnTe-z, while for the other phases its effect is small. The present values for ZnO are in reasonable agreement with the experimental values,Imanaka et al. (2001); Madelung (1992); Hümmer (1973); Oshikiri et al. (1996) except for , and (the latter discrepancies being not understood) and in good agreement with those obtainedLambrecht et al. (2002) by the FP-LMTO method.
V Conclusions
Electronic structure and band characteristics for Zn-z and -w phases are studied by first-principles calculations within the LDA, GGA, and LDA+ approaches. It is found that LDA underestimates the band gaps, the actual positions of the energy levels of the Zn-3 states, and splitting energies between the states at the top of the valence band, but overestimates the crystal-field splitting energy. Spin-orbit coupling energy is overestimated for ZnO-w, underestimated for ZnS-w, and comes out more or less accurate for ZnS-z, ZnSe-z, and ZnTe-z.
The LDA+ approach has been used to account properly for the strong correlation of the Zn-3 electrons. The value of the Hubbard potential was varied to adjust the Zn-3 band derived from LDA toward lower energies and thus provide better agreement with the experimentally established location of the Zn-3 levels from X-ray emission spectra. Using the values obtained by this approach the calculated band gaps and band parameters are improved according to the LDA+ procedure compared to the pure LDA approach.
The order of the states at the top of the valence band is systematically examined for Zn phases. It is found that the ZnO-z and -w phases exhibit negative SO splitting and anomalous order of the states within LDA, GGA, and LDA+ for eV, and the model of ThomasRowe et al. (1968); Lew Yan Voon et al. (1996); Thomas (1960); Lambrecht et al. (2002) is supported for these two Zn phases. It is found that in the LDA+ calculations the anomalous order is maintained up to eV for ZnO-z and eV for ZnO-w. For values of above these limits, the order is inverted. For ZnO-w, goes from positive to negative, whereas converts to a complex quantity, and becomes thus meaningless. Based on these analyses it is concluded that the Zn-3 electrons are responsible for the anomalous order of the states at the top of the valence band in ZnO. In the other Zn phases considered, the order is normal for all values of used in the calculations. For the three approaches considered, our findings confirm the model of ThomasThomas (1960) regarding the order of the states in the valence band of ZnO.
Effective masses of electrons at the conduction band minimum and of holes at the valence band maximum have been calculated along the symmetry axis , and for the w-type phases and along , and for the z-type phases. Along the axis of the w-type phases the light- and heavy-hole bands are degenerate, but the degeneracy is broken when spin-orbit coupling is included. The heavy holes in the valence band are found to be much heavier than the conduction band electrons in agreement with experimental findings which show higher electron mobility than hole mobility. The calculations, moreover, reveal that effective masses of the holes are much more anisotropic than those of the electrons. Conduction band electron masses for ZnO-w, ZnS-w, ZnSe-z, and ZnTe-z calculated within LDA are underestimated by about 50 compared to experimental data, while those for the other Zn phases are considered to agree with experimental data.
The GGA approach did not remedy the DFT-LDA derived error in the calculated energy gaps and band parameters. We found that spin–orbit coupling is important for calculation of the parameters for ZnSe-z and ZnTe-z, while it is not significant for the other zinc monochalcogenides.
It should be noted that electronegativity difference (according to the Pauling scale) 1.9 for ZnO is much larger than 0.9, 0.8, and 0.5 for ZnS, ZnSe, and ZnTe, respectively, which reflects that ZnO is more ionic than the other Zn compounds. Consequently, our calculated DOS for the topmost valence band is relatively narrow for ZnO, which accordingly shows stronger correlation effects than the other Zn.
It is established that the unusually large errors in calculated (according to DFT within LDA) band gaps and band parameters are owing to strong Coulomb correlations, which are found to be most significant in ZnO among the Zn phases considered. Also, because of the increase in ionic radii of with increasing atomic number the Zn– bond length systematically increases from ZnO to ZnTe. As a result, the Zn-3 band moves toward lower energies (see Fig. 2) and behaves like core electrons. In contrast, the relatively short Zn–O distance further confirms that the interaction of the Zn-3 electrons with the valence band is stronger in ZnO than in the other Zn compounds. Consistent with the above view point, the Zn-3 band of ZnO-w and ZnO-z is located closer to the topmost valence band, thus increasing the influence of the Coulomb correlation effects to the electronic structure compared to the other Zn-w and Zn-z phases. The present conclusion is consistent with the results in Ref. Sharma et al., 2005, which report that locations of the bands of a number of semiconductors and insulators (Ge, GaAs, CdS, Si, ZnS, C, BN, Ne, Ar, Kr, and Xe), determined from all-electron full-potential exact-exchange-DFT calculations, are in excellent agreement with experiment.
Acknowledgments
This work has received financial and supercomputing support from FUNMAT. SZK has obtained partial financial support from the Academy of Sciences of Uzbekistan (Project N31-36). SZK also thanks R. Vidya, P. Vajestoon, and A. Klaveness (Department of Chemistry, University of Oslo, Oslo, Norway) for discussions and assistance. The authors thank Professor M.A. Korotin (Institute of Metal Physics, Ekaterinburg, Russia) for help with the computations of the values of the parameters and within the constrain DFT and Dr. Karel Knizek (Institute of Physics ASCR, Prague, Czech Republic) for assistance with calculations according to the WIEN2K package.
References
- Hohenberg and Kohn (1964) P. Hohenberg and W. Kohn, Phys. Rev. 136, B864 (1964).
- Kohn and Sham (1965) W. Kohn and L. J. Sham, Phys. Rev. 140, A1133 (1965).
- Anisimov et al. (1993) V. I. Anisimov, I. V. Solovyev, M. A. Korotin, M. T. Czyzyk, and G. A. Sawatzky, Phys. Rev. B 48, 16 929 (1993).
- Dudarev et al. (1998) S. L. Dudarev, G. A. Botton, S. Y. Savrasov, C. J. Humphreys, and A. P. Sutton, Phys. Rev. B 57, 1505 (1998).
- Bengone et al. (2000) O. Bengone, M. Alouani, B. Blöchl, and J. Hugel, Phys. Rev. B 62, 16 392 (2000).
- Svane and Gunnarsson (1990) A. Svane and O. Gunnarsson, Phys. Rev. Lett. 65, 1148 (1990).
- Lambrecht et al. (2002) W. R. L. Lambrecht, A. V. Rodina, S. Limpijumnong, B. Segall, and B. K. Meyer, Phys. Rev. B 65, 07 5207 (2002).
- Vogel et al. (1995) D. Vogel, P. Krüger, and J. Pollmann, Phys. Rev. B 52, 14 316 (1995).
- Vogel et al. (1996) D. Vogel, P. Krüger, and J. Pollmann, Phys. Rev. B 54, 5495 (1996).
- Dong et al. (2004) C. L. Dong, C. Persson, L. Vayssieres, A. Augustsson, T. Schmitt, M. Mattesini, R. Ahuja, C. L. Chang, and J.-H. Guo, Phys. Rev. B 70, 19 5325 (2004).
- Qteish (2000) A. Qteish, J. Phys.: Condens. Matter 12, 5639 (2000).
- Persson and Zunger (2003) C. Persson and A. Zunger, Phys. Rev. B 68, 07 3205 (2003).
- Agrawal et al. (1994) B. K. Agrawal, P. S. Yadav, and S. Agrawal, Phys. Rev. B 50, 14 881 (1994).
- Janotti and Van de Walle (2006) A. Janotti and C. G. Van de Walle, J. Cryst. Growth 287, 58 (2006).
- Park and Min (2003) M. S. Park and B. I. Min, Phys. Rev. B 68, 22 4436 (2003).
- Feng (2004) X. Feng, J. Phys.: Condens. Matter 16, 4251 (2004).
- Karazhanov et al. (2006) S. Zh. Karazhanov, P. Ravindran, U. Grossner, A. Kjekshus, H. Fjellvåg, and B. G. Svensson, J. Cryst. Growth 287, 162 (2006).
- Hedin (1965) L. Hedin, Phys. Rev. 139, A796 (1965).
- Hybertsen and Louie (1985) M. S. Hybertsen and S. G. Louie, Phys. Rev. Lett. 55, 1418 (1985).
- Usuda et al. (2002) M. Usuda, N. Hamada, T. Kotani, and M. Schilfgaarde, Phys. Rev. B 66, 12 5101 (2002).
- Luo et al. (2002) W. Luo, S. Ismail-Beigi, M. L. Cohen, and S. G. Louie, Phys. Rev. B 66, 19 5215 (2002).
- Oshikiri and Aryasetiawan (2000) M. Oshikiri and F. Aryasetiawan, J. Phys. Soc. Jpn. 69, 2113 (2000).
- Rinke et al. (2005) P. Rinke, A. Qteish, J. Neugebauer, C. Freysoldt, and M. Scheffler, arXiv:cond-mat/0502404 1, 1 (2005).
- Fleszar and Hanke (2005) A. Fleszar and W. Hanke, Phys. Rev. B 71, 045207 (2005).
- Sharma et al. (2005) S. Sharma, J. K. Dewhurst, and C. Ambrosch-Draxl, Phys. Rev. Lett. 95, 136402 (2005).
- Jaffe et al. (2000) J. E. Jaffe, J. A. Snyder, Z. Lin, and A. C. Hess, Phys. Rev. B 62, 1660 (2000).
- Imanaka et al. (2001) Y. Imanaka, M. Oshikiri, K. Takehana, T. Takamasu, and G. Kido, Physica B 298, 211 (2001).
- Oshikiri et al. (1996) M. Oshikiri, K. Takehana, T. Asano, and G. Kido, Physica B 216, 351 (1996).
- Madelung (1992) Data in Science and Technology. Semiconductors: Other than Group IV Elements and III-V Compounds, edited by O. Madelung (Springer, Berlin, 1992).
- Xu and Ching (1993) Y.-N. Xu and W. Y. Ching, Phys. Rev. B 48, 4335 (1993).
- Clerjaud et al. (1979) B. Clerjaud, A. Gélineau, D. Galland, and K. Saminadayar, Phys. Rev. B 19, 2056 (1979).
- Lew Yan Voon et al. (1996) L. C. Lew Yan Voon, M. Willatzen, and M. Cardona, Phys. Rev. B 53, 10 703 (1996).
- Hümmer (1973) K. Hümmer, Phys. Status Solidi B 56, 249 (1973).
- Oshikiri et al. (2002) M. Oshikiri, F. Aryasetiawan, Y. Imanaka, and G. Kido, Phys. Rev. B 66, 12 5204 (2002).
- Nahory and Fan (1967) R. E. Nahory and H. Y. Fan, Phys. Rev. B 156, 825 (1967).
- Kresse and Furthmüller (1996) G. Kresse and J. Furthmüller, Phys. Rev. B 54, 11 169 (1996).
- Perdew et al. (1996) J. P. Perdew, K. Burke, and M. Ernzerhof, Phys. Rev. Lett. 77, 3865 (1996).
- Perdew and Zunger (1981) J. P. Perdew and A. Zunger, Phys. Rev. B 23, 5048 (1981).
- Ceperley and Alder (1980) D. M. Ceperley and B. J. Alder, Phys. Rev. Lett. 45, 566 (1980).
- Blöchl (1994) P. E. Blöchl, Phys. Rev. B 50, 17 953 (1994).
- Kresse and Joubert (1999) G. Kresse and D. Joubert, Phys. Rev. B 59, 1758 (1999).
- Adolph et al. (2001) B. Adolph, J. Furthmüller, and F. Bechstedt, Phys. Rev. B 63, 12 5108 (2001).
- ICS (2001) Inorganic Crystal Structure Database (Gmelin Institut, Karlsruhe, 2001).
- Weber (1986) Handbook of Laser Science and Technology, vol. III, edited by M. J. Weber (CRC, Cleveland, 1986).
- Zakharov et al. (1994) O. Zakharov, A. Rubio, X. Blase, M. L. Cohen, and S. G. Louie, Phys. Rev. B 50, 10 780 (1994).
- Lakshmi et al. (2003) N. Lakshmi, N. M. Rao, R. Venugopal, D. R. Reddy, and B. K. Reddy, Mater. Chem. Phys. 82, 764 (2003).
- Tomashik et al. (1978) V. N. Tomashik, G. S. Oleinik, and I. B. Mizetskaya, Inorg. Mater. 14, 1119 (1978).
- Bragg and Darbyshire (1954) W. H. Bragg and J. A. Darbyshire, J. Met. 6, 238 (1954).
- Hellwege and Madelung (1982) Numerical Data and Functional Relationships in Science and Technology, vol. 17a and 22a of Landolt-Börnstein, New series. Group III, edited by K.-H. Hellwege and O. Madelung (Springer, New York, 1982).
- Weast et al. (1990) CRC Handbook of Chemistry and Physics, 70th ed., edited by R. C. Weast, D. R. Lide, M. J. Astle, and W. H. Beyer (Chemical Rubber, Boca Raton, 1990).
- Pickett et al. (1998) W. E. Pickett, S. C. Erwin, and E. C. Ethridge, Phys. Rev. B 58, 1201 (1998).
- Ruckh et al. (1994) M. Ruckh, D. Schmid, and H. W. Schock, J. Appl. Phys. 76, 5945 (1994).
- Hopfield (1960) J. J. Hopfield, J. Phys. Chem. Solids 15, 97 (1960).
- Mang et al. (1995) A. Mang, K. Reimann, and S. Rübenacke, Solid State Commun. 94, 251 (1995).
- Savrasov (1996) S. Y. Savrasov, Phys. Rev. B 54, 16470 (1996).
- Blaha et al. (2001) P. Blaha, K. Schwarz, G. Madsen, D. Kvasnicka, and J. Luitz, WIEN2K, An Augmented Plane-Wave Local Orbitals Program for Calculating Crystal Properties (Techn. Universtät Wien, Austria, 2001).
- Rowe et al. (1968) J. E. Rowe, M. Cardona, and F. H. Pollak, Solid State Commun. 6, 239 (1968).
- Thomas and Hopfield (1959) D. G. Thomas and J. J. Hopfield, Phys. Rev. 116, 573 (1959).
- Madelung and Schulz (1982) Numerical Data and Functional Relationships in Science and Technology. New Series. Group III: Crystal and Solid State Physics. Semiconductors. Supplements and Extensions to Volume III/17. Intrinsic Properties of Group IV Elements and III–V, II–VI and I–VII Compounds, vol. 22a, edited by O. Madelung and M. Schulz (Springer, Berlin, 1982).
- Zidon et al. (2002) Y. Zidon, J. Yang, and Y. Shapira, Appl. Phys. Lett. 81, 436 (2002).
- Carrier and Wei (2004) P. Carrier and S.-H. Wei, Phys. Rev. B 70, 03 5212 (2004).
- Ley et al. (1974) L. Ley, R. A. Pollak, F. R. McFeely, S. P. Kowalczyk, and D. A. Shirley, Phys. Rev. B 9, 600 (1974).
- Vesely and Langer (1971) C. J. Vesely and D. W. Langer, Phys. Rev. B 4, 451 (1971).
- Hellwege and Madelung (1987) Numerical Data and Functional Relationships in Science and Technology, vol. 22a of Landolt-Börnstein, New series. Group III, edited by K.-H. Hellwege and O. Madelung (Springer, Berlin, 1987).
- Reynolds et al. (1999) D. C. Reynolds, D. C. Look, B. Jogai, C. W. Litton, G. Cantwell, and W. C. Harsch, Phys. Rev. B 60, 2340 (1999).
- Reynolds et al. (2001) D. C. Reynolds, D. C. Look, B. Jogai, and T. C. Collins, Appl. Phys. Lett. 79, 3794 (2001).
- Thomas (1960) D. G. Thomas, J. Phys. Chem. 15, 86 (1960).
- Shindo et al. (1965) K. Shindo, A. Morita, and H. Kamimura, J. Phys. Soc. Jpn. 20, 2054 (1965).
- Šantić (2003) B. Šantić, Semicond. Sci. Technol. 18, 219 (2003).
| Phase | (Å) | (Å) | (Å3) | ||
|---|---|---|---|---|---|
| ZnO-w111Experimental value from Ref. ICS, 2001. | |||||
| ZnS-w222Experimental value from Refs. Weber, 1986; Xu and Ching, 1993. | |||||
| ZnSe-w333Experimental value from Refs. ICS, 2001; Zakharov et al., 1994. | |||||
| ZnTe-w444Experimental value from Refs. Lakshmi et al., 2003; Tomashik et al., 1978. | |||||
| ZnO-z555Experimental value from Ref. Bragg and Darbyshire, 1954. | |||||
| ZnS-z666Experimental value from Refs. Hellwege and Madelung, 1982; Weast et al., 1990. | |||||
| ZnSe-z111Experimental value from Ref. ICS, 2001. | |||||
| ZnTe-z777Experimental value from Refs. Agrawal et al., 1994; Weast et al., 1990. |
| Phase | Method | |||||||||
|---|---|---|---|---|---|---|---|---|---|---|
| ZnO-w | LDA | 0.744 | 0.724 | 0.756 | 0.839 | 0.773 | 5.00 | 0.095 | 0.093 | -0.043 |
| GGA | 0.804 | 0.783 | 0.817 | 0.900 | 0.833 | 5.00 | 0.097 | 0.094 | -0.044 | |
| LDA+ | 1.988 | 2.008 | 2.053 | 2.053 | 2.038 | 10.00 | ||||
| Expt.111Experimental value from Ref. Mang et al., 1995. | 3.441 | 3.443 | 3.482 | 3.455 | 0.039 | -0.004 | ||||
| ZnS-w | LDA | 1.990 | 1.968 | 1.995 | 2.073 | 2.012 | 6.50 | 0.069 | 0.052 | 0.027 |
| GGA | 2.232 | 2.211 | 2.236 | 2.310 | 2.253 | 6.00 | 0.066 | 0.049 | 0.025 | |
| LDA+ | 2.283 | 2.260 | 2.286 | 2.366 | 2.304 | 8.20 | 0.059 | 0.055 | 0.026 | |
| Expt.222Experimental value from Ref. Madelung and Schulz, 1982. | 3.864 | 3.893 | 3.981 | 0.058 | 0.086 | |||||
| Expt.222Experimental value from Ref. Madelung and Schulz, 1982. | 3.872 | 3.900 | 0.006 | 0.092 | ||||||
| ZnSe-w | LDA | 1.070 | 0.939 | 1.008 | 1.379 | 1.109 | 6.50 | 0.114 | 0.324 | 0.047 |
| GGA | 1.327 | 1.200 | 1.268 | 1.624 | 1.364 | 6.50 | 0.112 | 0.311 | 0.046 | |
| LDA+ | 1.404 | 1.271 | 1.334 | 1.721 | 1.442 | 9.30 | 0.101 | 0.347 | 0.041 | |
| Expt.333Experimental value from Refs. Madelung and Schulz, 1982; Madelung, 1992. | 2.860 | 2.876 | 2.926 | 9.20 | ||||||
| ZnTe-w | LDA | 1.052 | 0.760 | 0.820 | 1.691 | 1.091 | 7.50 | 0.086 | 0.838 | 0.033 |
| GGA | 1.258 | 0.974 | 1.032 | 1.875 | 1.294 | 7.20 | 0.084 | 0.812 | 0.032 | |
| LDA+ | 1.283 | 0.990 | 1.043 | 1.882 | 1.305 | 9.50 | 0.075 | 0.809 | 0.030 | |
| Expt.444Experimental value from Ref. Zidon et al., 2002. | 2.260 | |||||||||
| ZnO-z | LDA | 0.573 | 0.555 | 0.588 | 0.577 | 4.60 | -0.033 | |||
| GGA | 0.641 | 0.615 | 0.649 | 0.638 | 4.60 | -0.034 | ||||
| LDA+ | 1.486 | 1.495 | 1.497 | 1.496 | 7.90 | 0.002 | ||||
| Empirical | 3.300 | |||||||||
| ZnS-z | LDA | 1.875 | 1.852 | 1.916 | 1.873 | 6.10 | 0.064 | |||
| GGA | 2.113 | 2.092 | 2.151 | 2.112 | 6.00 | 0.059 | ||||
| LDA+ | 2.332 | 2.310 | 2.389 | 2.336 | 9.00 | 0.079 | ||||
| Expt.222Experimental value from Ref. Madelung and Schulz, 1982. | 3.680 | 3.740 | 9.00 | 0.067 | ||||||
| Expt.222Experimental value from Ref. Madelung and Schulz, 1982. | 3.780 | 3.850 | ||||||||
| ZnSe-z | LDA | 1.079 | 0.948 | 1.341 | 1.079 | 6.60 | 0.393 | |||
| GGA | 1.335 | 1.209 | 1.586 | 1.335 | 6.50 | 0.377 | ||||
| LDA+ | 1.421 | 1.291 | 1.700 | 1.427 | 9.05 | 0.409 | ||||
| Expt.222Experimental value from Ref. Madelung and Schulz, 1982. | 2.700 | 9.20 | 0.400 | |||||||
| Expt.222Experimental value from Ref. Madelung and Schulz, 1982. | 2.820 | 0.400 | ||||||||
| ZnTe-z | LDA | 1.061 | 0.772 | 1.668 | 1.070 | 7.10 | 0.897 | |||
| GGA | 1.267 | 0.986 | 1.853 | 1.275 | 7.05 | 0.867 | ||||
| LDA+ | 1.329 | 1.046 | 1.956 | 1.349 | 9.90 | 0.911 | ||||
| Expt.222Experimental value from Ref. Madelung and Schulz, 1982. | 2.394 | 9.84 | 0.970 | |||||||
| Expt.222Experimental value from Ref. Madelung and Schulz, 1982. | 10.30 | |||||||||
| Method | ZnO-w | ZnS-w | ZnSe-w | ZnTe-w | ZnO-z | ZnS-z | ZnSe-z | ZnTe-z | |
|---|---|---|---|---|---|---|---|---|---|
| LDA+ | |||||||||
| Constrain DFT | |||||||||
| Phase | Method | ||||||||
|---|---|---|---|---|---|---|---|---|---|
| Without SO coupling | |||||||||
| ZnO-w | LDA | ||||||||
| GGA | |||||||||
| LDA+ | |||||||||
| ZnS-w | LDA | ||||||||
| GGA | |||||||||
| LDA+ | |||||||||
| ZnSe-w | LDA | ||||||||
| GGA | |||||||||
| LDA+ | |||||||||
| ZnTe-w | LDA | ||||||||
| GGA | |||||||||
| LDA+ | |||||||||
| With SO coupling | |||||||||
| ZnO-w | LDA | ||||||||
| GGA | |||||||||
| LDA+ | |||||||||
| FP LMTO111Theoretical value from Ref. Lambrecht et al., 2002. | |||||||||
| Expt.222Experimental value from Ref. Hümmer, 1973. | |||||||||
| LCAO333Theoretical value from Ref. Xu and Ching, 1993. | |||||||||
| ZnS-w | LDA | ||||||||
| GGA | |||||||||
| LDA+ | |||||||||
| Expt.444Experimental value from Ref. Madelung, 1992. | |||||||||
| LCAO333Theoretical value from Ref. Xu and Ching, 1993. | |||||||||
| ZnSe-w | LDA | ||||||||
| GGA | |||||||||
| LDA+ | |||||||||
| ZnTe-w | LDA | ||||||||
| GGA | |||||||||
| LDA+ | |||||||||
| Expt.444Experimental value from Ref. Madelung, 1992. | |||||||||
| Phase | Method | ||||||||||
|---|---|---|---|---|---|---|---|---|---|---|---|
| Without SO coupling | |||||||||||
| ZnO-z | LDA | ||||||||||
| GGA | |||||||||||
| LDA+ | |||||||||||
| ZnS-z | LDA | ||||||||||
| GGA | |||||||||||
| LDA+ | |||||||||||
| ZnSe-z | LDA | ||||||||||
| GGA | |||||||||||
| LDA+ | |||||||||||
| ZnTe-z | LDA | ||||||||||
| GGA | |||||||||||
| LDA+ | |||||||||||
| With SO coupling | |||||||||||
| ZnO-z | LDA | ||||||||||
| GGA | |||||||||||
| LDA+ | |||||||||||
| ZnS-z | LDA | ||||||||||
| GGA | |||||||||||
| LDA+ | |||||||||||
| Expt.111Experimental value from Ref. Madelung, 1992. | |||||||||||
| Expt.111Experimental value from Ref. Madelung, 1992. | |||||||||||
| ZnSe-z | LDA | ||||||||||
| GGA | |||||||||||
| LDA+ | |||||||||||
| Expt.111Experimental value from Ref. Madelung, 1992. | |||||||||||
| Expt.111Experimental value from Ref. Madelung, 1992. | |||||||||||
| ZnTe-z | LDA | ||||||||||
| GGA | |||||||||||
| LDA+ | |||||||||||
| Expt.111Experimental value from Ref. Madelung, 1992. | |||||||||||
Figure captions