[
Monoclinic and Correlated Metal Phase in VO2 as Evidence of the Mott Transition: Coherent Phonon Analysis
Abstract
In femtosecond pump-probe measurements, the appearance of coherent phonon oscillations at 4.5 THz and 6.0 THz indicating the rutile metal phase of VO2 does not occur simultaneously with the first-order metal-insulator transition (MIT) near 68∘C. The monoclinic and correlated metal(MCM) phase between the MIT and the structural phase transition (SPT) is generated by a photo-assisted hole excitation which is evidence of the Mott transition. The SPT between the MCM phase and the rutile metal phase occurs due to subsequent Joule heating. The MCM phase can be regarded as an intermediate non-equilibrium state.
PACS numbers: 71.27. +a, 71.30.+h, 78.47.+p
]
New physical phenomena such as high- superconductivity, colossal magnetoresistance and dilute magnetism occur when strongly correlated materials are doped with hole charges. These phenomena may be caused by a strongly correlated Mott first-order metal-insulator transition (MIT) with a change in on-site Coulomb interaction without the accompanying structural phase transition (SPT) [2]. The Mott MIT is still under intense debate, even though many scientists have tried to clarify the MIT mechanism [3]. We expect that studies on the MIT may provide a decisive clue in understanding these new phenomena.
VO2 (paramagnetic , 3) had monoclinic M1, transient triclinic T, monoclinic M2, and rutile R phases [4]. The monoclinic phase has two electronic structures, which are one-half of the V chains of the R phase being paired without twisting, while the other half twist but do not pair [4, 5, 6]. The M2 phase, consisting of equally spaced V chains, was defined as a monoclinic Mott-Hubbard insulator phase and the M1 phase, insulating monoclinic phase, may be a superposition of two M2-type lattice distortions [4, 5]. The first-order MIT was considered to be due to a change in atom position [4, 5]. More recently, Laad calculated, using the local-density approximation + dynamical mean field multiorbital iterated-perturbation theory scheme, that the MIT from R to M1 phases was accompanied by a large spectral weight transfer due to changes in the orbital occupations [7]. This supported the Mott-Hubbard picture of the MIT in VO2, where the Peierls instability arises subsequent to the MIT [8, 9].
For SPT in VO2, in contrast, it has also been proposed that the MIT near 68∘C is the Peierls transition caused by electron-phonon interaction. For example, it has been argued that VO2 is an ordinary band (or Peierls like) insulator on the basis of the -bonding combination of the 3 electron, resulting in a Peierls-like band gap [11]. The same conclusion was also reached by band structure calculations based on the local density approximation [12], an orbital-assisted MIT model [13], a structure-driven MIT [14], and experimental measurements of a structural bottleneck with a response time of 80 fs [15]. This has been also supported by other models including electron-electron interaction and electron-phonon interaction [17, 18].
These controversial argue on the electronic structure of VO2 is largely due to preconception that the MIT and the SPT occur simultaneously even though there may only be a causal relation between the SPT and the MIT.
We developed theoretically the hole-driven MIT theory (an extension of the Brinkman-Rice picture [19]) with a divergence for an inhomogeneous system [20, 21], and have reported the MIT with an abrupt first-order jump in current-voltage measurements below 68∘C, the SPT temperature [8, 9, 10, 21]. We have demonstrated that the Mott MIT occurs when the valence band is doped with hole charges of a very low critical density [8, 20, 21].
In this letter, we report time-resolved pump-probe measurements for VO2 and demonstrate the causality between the MIT and the SPT by analyzing coherent phonon oscillations that reveal different active modes across the critical temperature. We also simultaneously measure the temperature dependence of the resistance and crystalline structure to confirm the optical results. To our knowledge, this letter is the first to report the simultaneous analysis of MIT and SPT of VO2. We newly define a onoclinic and orrelated etal(MCM) phase between the MIT and the SPT, which is different to Pouget’s M2 definition [4, 5], on the grounds that the MIT occurs without an intermediate step. Photo-assisted temperature excitation measurements that were used to induce a new MCM phase as evidence of the Mott transition are also presented. The origin of the MCM phase is discussed on the basis of the hole-driven MIT theory [19, 20, 21]. The use of this theory is valid because the increase of conductivity near 68∘ was due to inhomogeneity [22] and inhomogeneity in VO2 films was observed [8, 9, 10, 21].
High quality VO2 films were deposited on both-side polished Al2O3(1010) substrates by the sol-gel method [23]. The thickness of the films is approximately 100 nm. The crystalline structure of the films was measured by x-ray diffraction (XRD). For coherent phonon measurements, time-resolved transmissive pump-probe experiments were performed using a Ti:sapphire laser which generated 20 fs pulses with a 92 MHz repetition rate centered on a wavelength of 780 nm. The diameter of the focused laser beam was about 30m.
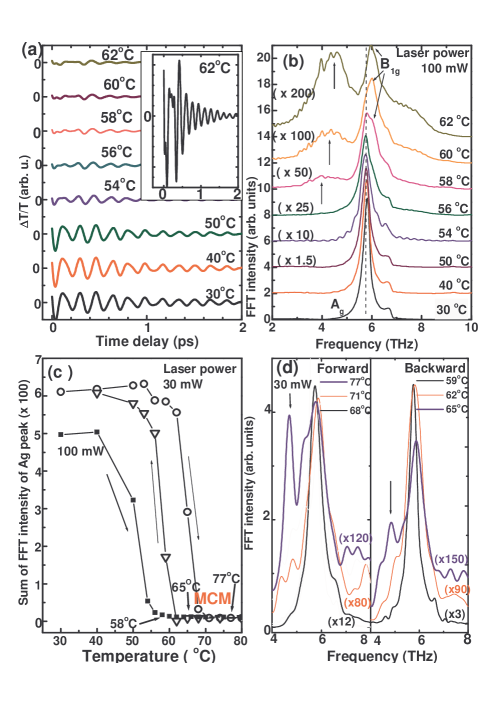
The coherent phonon measurement has many advantages over conventional continuous wave spectroscopy, such as the amplification effect of coherent phonons and a very low level background in the low wavenumber range [24]. Figure 1(a) shows the temperature dependence of coherent phonon oscillations measured at a pump laser power of 100mW. The enlarged oscillation trace measured at 62∘C is shown in the inset. The oscillation traces below 54∘C are clear, while for temperatures of 54∘C and above the oscillation amplitude is weakened since the MIT has already occurred.
Figure 1(b) shows the temperature dependence of coherent phonon peaks obtained by taking a fast Fourier transform (FFT) of the time-domain oscillations in Fig. 1(a). The intense monoclinic Ag peak near 5.8 THz decreases in intensity as the temperature increases. The Ag peak finally disappears at 58∘C. A new broad peak near 4.5 THz (150 cm-1) and a sharp peak at 6.0 THz (202 cm-1) appear at 58∘C and over, as denoted by the arrows in Fig. 1(b). The intense peak at 6.0 THz is identified as the B1g (208 cm-1) Raman active mode of the R phase [25], but the broad peak near 4.5 THz (150 cm-1) is not assignable, because this mode is excluded from allowable Raman active modes of the rutile structure [25, 26]. We suggest that this peak belongs to an active mode of the R phase because it appears at the same time as the B1g mode. Moreover, it is obvious that the large decrease of the Ag peak is attributed not to the SPT but rather to the MIT approximately between 50 and 58∘C.
Figure 1(c) shows the temperature dependence of the sum of the Ag peak spectral intensity centered at 5.8 THz from FFT spectra in Fig. 1(b). These measurements were performed with pump powers of 30 mW and 100 mW, respectively. The temperature dependence of the spectral intensity shows a similar trend irrespective of pump power. The hysteresis curve at 30 mW is denoted by circles (heating: forward) and triangles (cooling: backward). The circle curve with the intensity drop near 68∘C is similar to the resistance curve of VO2. This result indicates that the heating effect due to a focused laser beam at 30mW is negligible. Conversely, the transition temperature observed for a pump power of 100 mW (black filled squares) is 12∘C lower than that observed for the 30 mW case (Fig. 1 (c)). This is due to a local heating effect by laser spot [27]. Thus, the true temperature of 58∘C shown in Fig. 1(b) is likely to be =70∘C.
Figure 1(d) shows the coherent phonon spectra obtained for forward (heating) and backward directions at 30 mW. Remarkably, the coherent phonon peak at 4.5 THz appears at 77∘C (left side in Fig. 1(d)). The phonon peaks near 71∘C indicate an intermediate state for the SPT. The phonon peaks at 74∘C (not displayed in the figure) showed the same behavior as those at 71∘C. The SPT temperature is regarded as 77∘C. Thus, the MCM phase is in a temperature range from 62 to 77∘C (Fig. 1(c) and 1(d)). Although a temperature increase due to the low pump power is insignificant, the laser can still excite holes in the film [16]. The photo-induced holes cause the transition to the MCM phase, which will be discussed in a following section. In the backward direction of the hysteresis curve (denoted by triangles in Fig. 1(c) and right side in Fig. 1(d)), the peak at 4.5 THz is recovered at 65∘C and the intermediate structure also appears at 59∘C. The corresponding in the cooling cycle is then regarded as being 65∘C. Such a decreased (7765∘C) is due to a residual heating effect from the high temperature increase up to 80∘C. For the cooling process, the MCM phase is likely present in a temperature range between 56 and 62∘C.
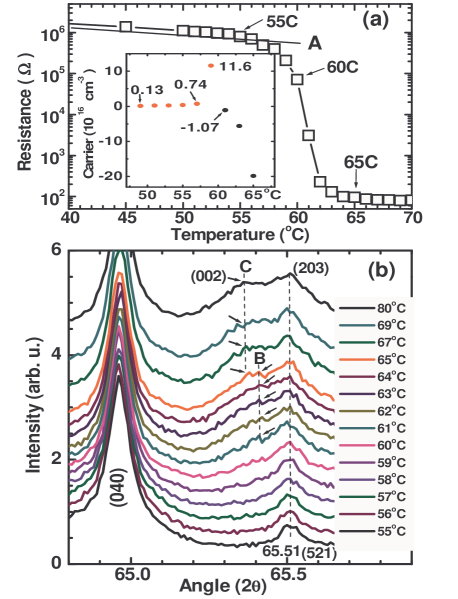
In order to confirm the above optical results, we simultaneously measured the temperature dependence of the resistance and XRD pattern for the VO2 (521)/Al2O3(1010) films. The temperature range shown in Fig. 2(a) corresponds to the temperatures of the XRD measurement in Fig. 2(b) and is performed at 1∘C intervals. At 56∘C, the resistance begins to deviate from the linear fit denoted by line A. can be regarded as 56∘C. The (521) plane (2 =65.42∘) in Fig. 2(b) has a single peak at 55∘C. A shoulder on the (521) plane peak appears at 61∘C, as indicated by dot-line B in Fig. 2 (b). The peaks indicated by line B denote an intermediate structure and not the R metal phase. The peak related to the (002) plane appears at 65∘C and represents the R metal phase, as indicated by dot-line C in Fig. 2 (b). It is likely that the SPT begins at 65∘C and is continuous with temperature. This is the same result as in previous work [28]. As shown in Fig. 2(a), the resistance at 65∘C is as small as about 100 above 65∘C. This is four orders of magnitude lower than the resistance of the insulating phase. These results clearly show that is different to and that the MCM phase exists between 56 and 65∘C as an intermediate state.
Furthermore, the inset in Fig. 2(a) shows a Hall measurement in which a change of carriers from holes (red bullets) to electrons (black bullet) is observed near 60∘C. This indicates that the type of carrier in the metal phase is an electron. This shows that the MIT has already occurred at 60∘C lower than , and that hole carriers drive the first-order MIT [8]. It should be noted that the hole-driven MIT is quite different from the well-known original Mott transition idea where a first-order MIT from a metal to an insulator occurs when electron carriers in the metal are reduced to a critical density. This is caused by a reduction of the screened long range Coulomb potential energy. However, there is no change of carrier type in Mott’s idea.
A femtosecond X-ray study for the SPT showed a slow response time (as long as 1 ps) with an intermediate structure displaying peaks at 13.75∘ and 13.8∘ [14]. In this study the metal phase peak at 13.8∘ appeared after times longer than 300 fs after a 50 fs x-ray irradiation. This indicated that the SPT is continuous. As for the MIT, the rate of change in the reflectivity due to the increased free carriers was observed to be as short as 80 fs at the most [15, 16]. It was suggested that this shorter response time might be due to a structural bottleneck since the authors of the works had assumed the concurrence of the MIT with the SPT [14, 15]. The response time difference between 300 fs and 80 fs supports the idea that the MIT and the SPT cannot occur simultaneously. This is consistent with the results shown in the present work.
We will now explain the origin of the MCM phases in Fig. 1. The critical hole density required to induce the MIT in VO2 was theoretically predicted by the hole-driven MIT theory [20, 21], and has been known as n0.018 [8]. The critical hole density is given by nc(T,Photo)=n(T)+n(Photo) where nc(T,Photo) is the hole density excited by both light and temperature, and n(T) and n(Photo) are the hole carrier densities excited by temperature and light, respectively. External excitations by temperature, pressure, chemical doping and light generate the transition to the MCM phase according to the MIT condition. If there is no external excitation, only n(T) can induce the MCM phase.
This scenario is based on the hole-driven MIT theory, which explains the breakdown of the critical on-site Coulomb energy by hole doping doping of a low concentration into the valence band of the Mott insulator [20, 21]. It predicts that the MIT can be switched on or off by the doping or de-doping of the valence band with a low concentration of holes [21]. Recently there have been several experimental reports confirming that the abrupt MIT is induced by holes [8, 15, 29, 30]. We have experimentally demonstrated that the first-order MIT occurs with the doping of the valence band to a critical hole density [8]. The MIT induced by temperature is identical to the abrupt first-order MIT observed by an external electric field [8], since MITs can be driven only by holes, irrespective of the method of excitation. Moreover, the MIT differs from the transition driven by the SPT, which has lead us to believe that VO2 is a Peierls insulator [11, 12, 13, 15]. The first-order MIT is quite different from the Mott-Hubbard continuous MIT in which the density of states on the Fermi surface gradually decreases as the on-site Coulomb potential increases [31].
The MCM phase is supposed to have a maximum conductivity, related to the maximum effective mass, , near the MIT as [8, 20, 21]. The maximum effective mass can be regarded as a diverging true effective mass in the Brinkman-Rice picture [19]. It was suggested that the metal phase is correlated by I-V measurement [21] and optical measurements [32]. The monoclinic T phase instead of M2 in VO2 [4, 5, 6] can be classified as a correlated paramagnetic Mott insulator with the equally spaced V-V chain, on the basis of the jump between the T and MCM phases. The T phase is defined as a semiconductor or insulator phase before the transition from insulator to metal occurs near 340 K.
In conclusion, the first-order MIT is driven not by the SPT but by hole carriers in VO2 and occurs between T and MCM. The monoclinic and correlated metal phase can be regarded as a non-equilibrium state because the MCM phase exists at the divergence in the hole-driven MIT theory and the Brinkman-Rice picture. The characteristics of the MCM phase need to be studied in more depth.
We acknowledge Prof. D. N. Basov and Dr. M. M. Qazilbash for valuable comments. This research was performed by a project of High Risk High Return in ETRI.
REFERENCES
- [1] htkim@etri.re.kr
- [2] N. F. Mott 1990 (Taylor and Frances Press,1990).
- [3] M. Imada, A. Fujimori, and Y. Tokura, Rev. Mod. Phys. 70, 1039 (1998).
- [4] J. P. Pouget, H. Launois, J. P. D’Haenens, P. Merender, and T. M. Rice, Phys. Rev. Lett. 35, 873 (1975).
- [5] T. M. Rice, H. Launois, J. P. Pouget, Phys. Rev. Lett. 73, 3042 (1994).
- [6] T. Mitsuishi, Jpn. J. Appl. Phys. 6, 1060 (1967).
- [7] M. S. Laad, L. Craco, and E. Euller-Hartmann, Phys. Rev. B 73, 195120 (2006).
- [8] H. T. Kim, B. G. Chae, D. H. Youn, S. L. Maeng, G. Kim, K.Y. Kang, and Y. S. Kim, New J. Phys. 6, 52 (2004).
- [9] H. T. Kim, B. G. Chae, D. H. Youn, G. Kim, K. Y. Kang, Appl. Phys. Lett. 86, 242101 (2005); Meeting Abstracts of Physical Society Japan 61 (2006) 575 (28aUE-6), cond-mat/0603546.
- [10] B. G. Chae, H. T. Kim, D. H. Youn, K. Y. Kang, Physica B 369, 76 (2005).
- [11] J. B. Goodenough, J. Solid State Chem. 5, 145 (1972).
- [12] R. M. Wentzcovitch, W. W. Schulz, and P. B. Allen, Phys. Rev. Lett. 72, 3389 (1994).
- [13] M. W. Haverkort, Z. Hu, A. Tanaka, W. Reichelt, S. V. Streltsov, M. A. Korotin, V. I. Anisimov, H. H. Hsieh, H.-.Lin, C. T. Chen, D. I. Khomskii, and L. H. Tjeng, Phys. Rev. Lett. 95, 196404 (2005).
- [14] A. Cavalleri, Cs. Toth, C. W. Siders, and J. A. Squier, F. Raksi, P. Forget, and J. C. Kieffer, Phys. Rev. Lett. 87, 237401 (2001).
- [15] A. Cavalleri, Th. Dekorsy, H. H. W. Chong, J. C. Kieffer, and R. W. Schoenlein, Phys. Rev. B 70, 161102 (2004).
- [16] M. Rini, A. Cavalleri, R. W. Schoenlein, R. Lopez, L. C. Feldman, R. F. Hanlund Jr., L. A. Boatner, and T. E. Haynes, Opt. Lett. 30, 558 (2005).
- [17] S. Biermann, A. Poteryaev, A. I. Lichtenstein, and A. Georges, Phys. Rev. Lett. 94, 26404 (2005).
- [18] K. Okazaki, H. Wadati, A. Fujimori, M. Onoda, Y. Muraoka, and Z. Hiroi, Phys. Rev. B69, 165104 (2004).
- [19] W. F. Brinkman, T. M. Rice, Phys. Rev. B2, 4302 (1970).
- [20] H. T. Kim, Physica C341-348 (2000) 259; ”New Trends in Superconductivity”, NATO Science Series Vol II/67 p 137 (Kluwer, 2002), cond-mat/0110112.
- [21] H. T. Kim, B. J. Kim, Y. W. Lee, B. G. Chae, S. J. Yun, K. Y. Kang, cond-mat/0607577.
- [22] H. S. Choi, J. S. Ahn, J. H. Jung, D. H. Kim, T. W. Noh, Phys. Rev. B 54, 4621 (1996).
- [23] B. G. Chae, H. T. Kim, S. J. Yun, Y. W. Lee, B. J. Kim, D. H. Youn, and K. Y. Kang, Electrochem. Solid-State Lett. 9, C12 (2006).
- [24] K. J. Yee, Y. S. Lim, T. Dekorsy, and D. S. Kim, Phys. Rev. Lett. 86, 1630 (2001).
- [25] R. Srivastava, L. Chase, Phys. Rev. Lett. 27, 727 (1971).
- [26] P. Schilbe, Physica B316-317, 600 (2002).
- [27] We observed a laser spot formed by a high laser power on a VO2 film below 68∘C in a micro-Raman experiment. The laser spot was not observed in a low laser power and is a cause of local heating decreasing the observed such as the case of 100 mW in Fig. 1 (c).
- [28] C. Leroux, G. Nihoul, and G. V. Tendeloo, Phys. Rev. B 57, 5111 (1998).
- [29] D. N. Basov, private communication.
- [30] Y. S. Lee, K. Sagawa, Z. Q. Li, W. J. Padilla, M. Dumm, S. V. Dordevic, C. C. Homes, Y. Ando, and D. N. Basov, Phys. Rev. B 72, 54529 (2005).
- [31] X. Y. Zhang, M. J. Rozenberg, and G. Kotlier, Phys. Rev. Lett. 70, 1666 (1993).
- [32] M. M. Qazilbash, K. S. Burch, D. Whisler, D. Schrekenhamer, B. G. Chae, H. T. Kim, and D. N. Basov, to be submitted.