Current address:]National Chiao Tung University, Taiwan
Microscopic evidence for field-induced magnetism in CeCoIn5
Abstract
We present NMR data in the normal and superconducting states of CeCoIn5 for fields close to T in the plane. Recent experiments identified a first-order transition from the normal to superconducting state for T, and a new thermodynamic phase below 290 mK within the superconducting state. We find that the Knight shifts of the In(1), In(2) and the Co are discontinuous across the first-order transition and the magnetic linewidths increase dramatically. The broadening differs for the three sites, unlike the expectation for an Abrikosov vortex lattice, and suggests the presence of static spin moments in the vortex cores. In the low-temperature and high-field phase the broad NMR lineshapes suggest ordered local moments, rather than a long wavelength quasiparticle spin density modulation expected for an FFLO phase.
pacs:
71.27.+a, 76.60.-k, 74.70.Tx, 75.20.HrOne of the most intriguing properties observed in Kondo lattice systems is the emergence of unconventional superconductivity near a quantum critical point (QCP). By varying some external parameter such as field or pressure, an antiferromagnetic ground state can be tuned such that the transition temperature goes to zero at the QCP. As the tuning parameter increases past the QCP, conventional Fermi-liquid behavior is recovered below a characteristic temperature Custers et al. (2003). Superconductivity often emerges as the ground state of the system for sufficiently low temperatures in the vicinity of the QCP Mathur et al. (1998). The heavy-fermion superconductor CeCoIn5 exhibits many properties typical of a Kondo lattice system at a QCP. In particular, appears to vanish at the superconducting critical field for fields along the c axis, suggesting the presence of a field-tuned QCP Bianchi et al. (2003a); Paglione et al. (2003). This interpretation has remained contentious because the ordered state associated with the QCP is superconductivity rather than antiferromagnetism. One explanation is that an antiferromagnetic (AFM) phase is hidden within the superconducting phase diagram, which is the genitor of both the QCP and non-Fermi liquid behavior in the vicinity of . However, when the superconductivity is suppressed with Sn doping, the QCP tracks , and no magnetic state emerges in the phase diagram, whereas pressure separates the QCP Bauer et al. (2005).
In fact, there is a field-induced state, which we will refer to as the B phase, in the phase diagram of CeCoIn5 that exists just below . The order parameter of the B phase could be either (1) a different symmetry of the superconducting order parameter, (2) a field-induced magnetic phase, or (3) a Fulde-Ferrell-Larkin-Ovchinnikov (FFLO) superconducting phase Bianchi et al. (2003b); Bianchi et al. (2002); Bianchi et al. (2003c); Radovan et al. (2003). The normal to superconducting transition in this system has a critical point at , separating a second to first order transition, and the B phase exists below a temperature mK and is bounded by . NMR experiments suggest the presence of excess quasiparticles associated with nodes in the superconducting FFLO wavefunction Fulde and Ferrell (1964); Larkin and Ovchinnikov (1965); Maki and Tsuneto (1964); Kakuyanagi et al. (2005). However, recent NMR work by Mitrović et al. disagrees with the original study, casting doubt on the interpretation of this ordered phase as an FFLO state Mitrović et al. (2006). In this Letter we report detailed NMR spectra of all three sites: the 115In(1), 115In(2) and 59Co, in the normal and superconducting phases. Our data agree with those of Mitrović et al. (2006), and by comparing our spectra at the three sites, we conclude that long-range order of local moments exists below . Therefore, the B phase is neither a different symmetry of the superconducting order parameter, nor simply the FFLO state, but rather a more complex field-induced magnetic state that may be responsible for the QCP point at .
We also find evidence for field-induced magnetism in the mixed state (A phase) between and . In this temperature and field range, we find that the NMR Knight shift is discontinuous across the first-order transition ( mK), and the spectra undergo a dramatic magnetic broadening nearly one order of magnitude larger than expected for orbital currents in a vortex lattice. The broadening is different for the Co and In(1) sites, suggesting that the origin of the magnetic broadening is a distribution of hyperfine rather than orbital fields. A likely source of hyperfine fields are quasi-static spin moments within the vortex cores.
All of the NMR measurements were made on a single crystal of CeCoIn5 mounted with . The orientation was verified to within by observing the resonance frequencies of the quadrupolar satellites of the In(1) (). The sample was mounted in the 3He-4He mixture of a dilution refrigerator, and the tank circuit was tuned by two fixed capacitors located close to the coil. Spectra were obtained by summing several individual spectra taken with low power at constant frequency intervals Clark et al. (1995). The temperature was monitored by a ruthenium oxide resistor mounted close to the sample. Heating of the sample was minimized by reducing the pulse power to within less than 200 mW for less than 20 s. The field of the magnet was not independently calibrated, so the Knight shift measurements were shifted so that the normal state values extrapolated to those measured previously Curro et al. (2001).
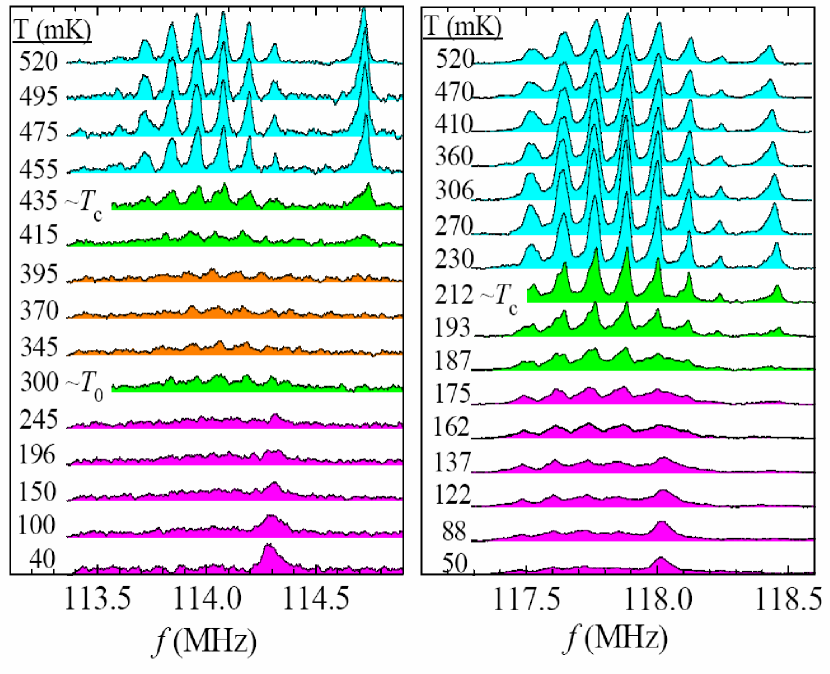
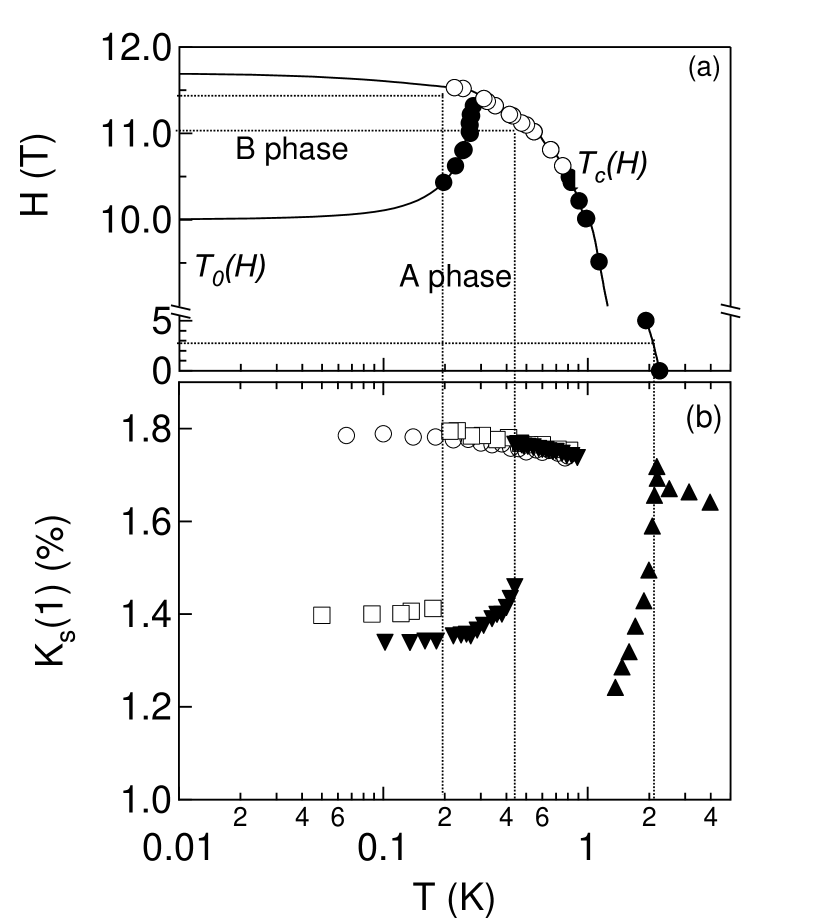
Figure 1 shows spectra of the Co and In(1) at two different fields as a function of temperature (see Fig. 3a). The In(1) transitions at 114.7 MHz and 118.5 MHz shift to lower frequency discontinuously at . We have confirmed that the resonances at and MHz for mK are indeed the In(1) by measuring several satellite transitions that show similar shifts in the superconducting state. The quadrupolar splitting between the Co and In(1) satellites remains temperature independent, indicating that the discontinuity in the resonance frequency has a magnetic origin, rather than a change in the charge configuration. The absolute intensity of the spectra drops at , an indication that the sample is superconducting as the rf penetration is reduced. Fig. 2 shows spectra of In(1) and In(2)|| ( parallel to the face of unit cell Curro et al. (2001)) at 11.1T.
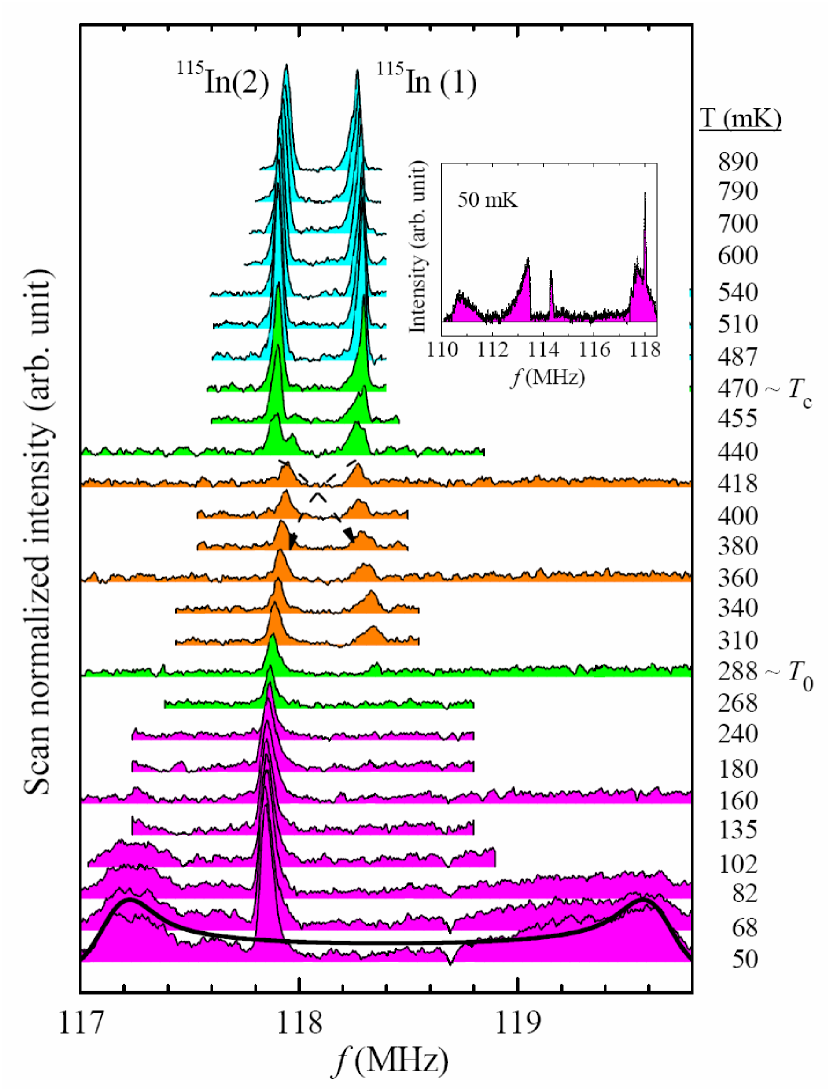
Figure 3b shows the temperature dependence of the In(1) Knight shift, , as a function of temperature and field. is determined from the first moment of the resonance, and we have subtracted the temperature independent orbital shift to obtain the spin contribution Curro et al. (2001). We find a discontinuous jump in at , in agreement with bulk measurements at these fields, which reflects the discontinuity in the superconducting gap at the first order transition Tayama et al. (2002); Bianchi et al. (2002).
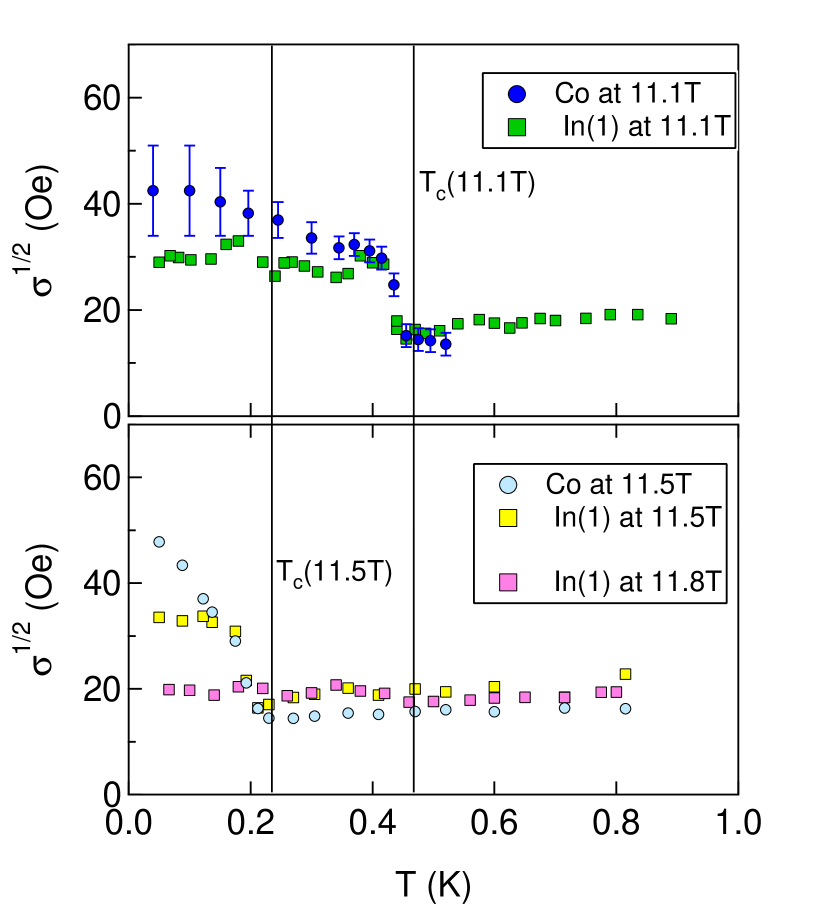
The spectra shown in Figs. 1 and 2 clearly show a dramatic increase in the magnetic linewidths below . The linewidths of the Co and In(1) are shown as functions of field and temperature in Fig. 4. The resonance frequency in the superconducting state can be written as the sum of three contributions: , where is the gyromagnetic ratio of the nucleus, is the hyperfine coupling, is the orbital (spin) magnetization and . There are two sources of magnetic broadening: a spatial distribution of or . In type II superconductors, both are spatially distributed due to the vortex lattice, and hence the NMR spectrum develops a characteristic lineshape in the mixed state (A phase), which is typically dominated by MacLaughlin (1976); Curro et al. (2000a). However, the broadening we observe occurs in the A phase and changes little in the B phase. This result is surprising, since a priori one would expect an extra broadening due to in the FFLO phase Vorontsov and Graf (2006b, a). In fact, the vortex contribution, , should be negligible at these fields. The second moment of the Abrikosov vortex lattice field distribution with a Ginzburg-Landau parameter and orbital limiting field T is Oe at these fields Chia et al. (2003); Tayama et al. (2002); Brandt (2003). Convolving this result with the intrinsic normal state linewidths ( Oe), gives a net change of Oe. Clearly, as seen in Fig. 4, the magnetic broadening observed is much too large to explain with a conventional Abrikosov vortex lattice. Furthermore, the broadening at the Co site is nearly twice that at the In(1) site. If the broadening mechanism were from orbital supercurrents or spin-polarized quasiparticles in the domain walls of the FFLO state, then the response at the Co and In(1) would be identical. The only way to understand our results is a distribution of due to local moments, which gives a different response for different hyperfine couplings unique to each nuclear site.
We propose that this distribution of spin polarization arises from magnetic order in the vortex cores, as has been found in the high temperature superconductors Lake et al. (2001); Kakuyanagi et al. (2003). Since the superconducting order parameter vanishes in the cores, it is plausible that competing orders may be stabilized Demler et al. (2001). CeCoIn5 becomes AFM with only a few percent Cd doping, which indicates that this material lies close to an AFM instability Pham et al. (2006). Indeed, recent neutron measurements found an enhancement of the vortex lattice form factor consistent with spins in the cores DeBeer-Schmitt et al. (2006), and magnetization measurements as a function of field reveal a strong paramagenetic contribution even in the mixed state of this material Tayama et al. (2002). Such an effect has been observed in other heavy-fermion materials, and may be associated with a paramagnetic response of local f moments in the vortex cores Haga et al. (1996).
Below , the response of all three sites differs dramatically. Figures 1 and 2 show spectra of the In(1) and In(2)|| at 11.1 T. The In(1) and Co spectra change little across the mK transition at 11.1T, whereas the In(2)|| signal disappears below and then reappears below 100 mK with a broad double-peak structure over a range of 2.5 MHz. We have confirmed that this spectrum is the In(2)|| by checking the response of a different satellite transition (see Fig. 2 INSET). Similar features were observed in CeRhIn5 in the AFM state, where the In(1) lines remained sharp while the In(2) spectra developed a broad powder pattern-like spectrum as a result of the incommensurate magnetic structure Curro et al. (2000b). Such an effect cannot be explained by a long-wavelength modulation of as expected in an FFLO state, or a change of the order parameter symmetry. In either case, the wavelength of the modulation should be on the order of either the coherence length, , or the Fermi wavevector mismatch, . Both of these length scales exceed the unit cell length, implying that the response of the Co, In(1) and In(2) should be similar. If there were static order of Ce moments, then because of their particular site symmetries the Co and In(1) can remain relatively sharp whereas the In(2) can experience large hyperfine fields Curro (2006). A possible magnetic structure that satisfies these requirements is , where is the wavelength of the incommensuration and the Ce spins . In this case the isotropic components of the hyperfine field at the In(1) and Co sites vanishes, but at the In(2) the hyperfine field has components either parallel or antiparallel to . The solid line in Fig. 2 shows the expected lineshape for a sinusoidal variation of with magnitude 1.3 kOe, which has been convolved with a Gaussian with width 100 kHz. We do not have independent information to determine either or , since . The onset of long-range magnetic order also explains why the In(2)|| signal disappears just below , since the combination of critical slowing down and the large hyperfine fields leads to a fast spin-echo decay time, , wiping out the NMR signal Curro et al. (2000c). When the magnetic order becomes static, becomes longer and the signal recovers, but the large static hyperfine field shifts the resonance frequency.
A possible explanation for understanding these results is that the field-induced magnetism in the vortex cores becomes correlated between the vortices below . The isostructural compound CeRhIn5 exhibits field induced magnetism under pressure Park et al. (2006). Comparison of the pressure dependent phase diagrams of these two materials suggests that CeCoIn5 is nearly identical to CeRhIn5 under a pressure of 1.6-2.3 GPa, exactly in the vicinity of the pressure where CeRhIn5 exhibits field-induced magnetism Sidorov et al. (2002). Furthermore, the phase diagram of CeRhIn5 is nearly identical to that of CeCoIn5, except that in CeRhIn5 the field-induced magnetism persists above , whereas in CeCoIn5 there is no sign of magnetism in the normal state. We cannot rule out the existence of an FFLO state, or whether the long-range magnetism coexists with the FFLO order. Nevertheless, local moment magnetism clearly competes with Kondo screening and with superconductivity, so magnetism may emerge naturally where the superconductivity is suppressed within the vortex cores or the nodal planes of the FFLO phase. This interpretation offers a consistent explanation of the non-Fermi liquid behavior associated with the QCP at , where the observed field-induced magnetism apparently exists only within the superconducting phase.
We thank A. Balatsky, A. Bianchi, L. Boulaevskii, M. Nicklas, R. Movshovich, T. Park, and F. Ronning for enlightening discussions. A. B. V. was supported by the Louisiana Board of Regents. This work was performed at Los Alamos National Laboratory under the auspices of the U.S. Department of Energy.
References
- Custers et al. (2003) J. Custers, et al., Nature 424, 524 (2003).
- Mathur et al. (1998) N. D. Mathur, et al., Nature 394, 39 (1998).
- Bianchi et al. (2003a) A. Bianchi, et al., Phys. Rev. Lett. 91, 257001 (2003a).
- Paglione et al. (2003) J. Paglione, et al., Phys. Rev. Lett. 91, 246405 (2003).
- Bauer et al. (2005) E. D. Bauer, et al., Phys. Rev. Lett. 94, 047001 (2005).
- Bianchi et al. (2003b) A. Bianchi, R. Movshovich, C. Capan, P. G. Pagliuso, and J. L. Sarrao, Phys. Rev. Lett. 91, 187004 (2003b).
- Bianchi et al. (2002) A. Bianchi, et al., Phys. Rev. Lett. 89, 137002 (2002).
- Bianchi et al. (2003c) A. Bianchi, R. Movshovich, C. Capan, P. G. Pagliuso, and J. L. Sarrao, Phys. Rev. Lett. 91, 187004 (2003c).
- Radovan et al. (2003) H. A. Radovan, et al., Nature 425, 51 (2003).
- Fulde and Ferrell (1964) P. Fulde and R. A. Ferrell, Phys. Rev. 135, A550 (1964).
- Larkin and Ovchinnikov (1965) A. I. Larkin and Y. N. Ovchinnikov, Sov. Phys. JETP 20, 762 (1965).
- Maki and Tsuneto (1964) K. Maki and T. Tsuneto, Prog. Theor. Phys. 31, 945 (1964).
- Kakuyanagi et al. (2005) K. Kakuyanagi, et al., Phys. Rev. Lett. 94, 047602 (2005).
- Mitrović et al. (2006) V. F. Mitrović, et al., Phys. Rev. Lett. 97, 117002 (2006).
- Clark et al. (1995) W. G. Clark, M. E. Hanson, F. Lefloch, and P. Ségransan, Rev. Sci. Instr. 66, 2453 (1995).
- Curro et al. (2001) N. J. Curro, et al., Phys. Rev. B 64, 180514 (2001).
- Tayama et al. (2002) T. Tayama, et al., Phys. Rev. B 65, 180504 (2002).
- MacLaughlin (1976) D. E. MacLaughlin, Solid State Physics (1976), vol. 31, pp. 1–68.
- Curro et al. (2000a) N. J. Curro, C. Milling, J. Haase, and C. P. Slichter, Phys. Rev. B 62, 3473 (2000a).
- Vorontsov and Graf (2006a) A. B. Vorontsov and M. J. Graf, to appear in Phys. Rev. B 74 (2006a).
- Vorontsov and Graf (2006b) A. B. Vorontsov and M. J. Graf, AIP Conf. Proc. 850, 729 (2006b).
- Chia et al. (2003) E. E. M. Chia, et al., Phys. Rev. B 67, 014527 (2003).
- Brandt (2003) E. H. Brandt, Phys. Rev. B 68, 054506 (2003).
- Lake et al. (2001) B. Lake, et al., Science 291, 5509 (2001).
- Kakuyanagi et al. (2003) K. Kakuyanagi, et al., Phys. Rev. Lett. 90, 197003 (2003).
- Demler et al. (2001) E. Demler, S. Sachdev, and Y. Zhang, Phys. Rev. Lett. 87, 067202 (2001).
- Pham et al. (2006) L. D. Pham, T. Park, S. Maquilon, J. D. Thompson, and Z. Fisk, Phys. Rev. Lett. 97, 056404 (2006).
- DeBeer-Schmitt et al. (2006) L. DeBeer-Schmitt, et al., cond-mat/0605641 (2006).
- Haga et al. (1996) Y. Haga, et al., J. Phys. Soc. Jpn. 65, 3646 (1996).
- Curro et al. (2000b) N. J. Curro, et al., Phys. Rev. B 62, R6100 (2000b).
- Curro (2006) N. J. Curro, New. J. Phys. 8, 173 (2006).
- Curro et al. (2000c) N. J. Curro, et al., Phys. Rev. Lett. 85, 642 (2000c).
- Park et al. (2006) T. Park, et al., Nature 440, 65 (2006).
- Sidorov et al. (2002) V. A. Sidorov, et al., Phys. Rev. Lett. 89, 157004 (2002).