The Anomalous Skin Effect in Single Crystal Relaxor Ferroelectric PZN-PT and PMN-PT
Abstract
X-ray and neutron scattering studies of the lead-based family of perovskite relaxors PZN-PT and PMN-PT have documented a highly unusual situation in which the near-surface region of a single crystal can exhibit a structure that is different from that of the bulk when cooled to low temperatures. The near-surface region, or ”skin” can also display critical behavior that is absent in the crystal interior, as well as a significantly different lattice spacing. By varying the incident photon energy, and thus the effective penetration depth, x-ray measurements indicate a skin thickness of order 10 m to 50 m for PZN-PT samples with %. Neutron residual stress measurements on a large PMN single crystal reveal a uniform lattice spacing within the bulk, but an increased strain near the surface. The presence of this skin effect has led to incorrect phase diagrams for both the PZN-PT and PMN-PT systems and erroneous characterizations of the nature of the relaxor state.
I Introduction
The exceptional piezoelectric properties of the lead-oxide class of relaxor ferroelectrics has fueled an intense amount of scientific research on these materials over the past several years. Park ; Service Numerous studies have been performed in an attempt to understand the fundamental mechanism(s) responsible for the ultrahigh piezoelectric response of these compounds. Ye_review During the course of these studies, additional anomalous behavior has been documented including the truly remarkable situation in which the structure of the bulk of a single crystal relaxor specimen can differ from that of the near-surface region, or ”skin,” which spans tens of microns. The x-ray scattering studies of Xu et al. have revealed a striking discrepancy between the low-temperature crystal structure reported by earlier x-ray scattering studies on the parent compound Pb(Zn1/3Nb2/3)O3 (PZN) and that observed using high-energy x-rays. Xu_PZN1 ; Xu_PZN2 ; Xu_APL By varying the energy of the incident x-rays, and thus the penetration depth, distinct crystal structures were observed. Subsequent neutron scattering studies by Gehring et al. have found that the same discrepancy exists in solid solutions of Pb(Mg1/3Nb2/3)O3 (PMN) mixed with 10% PbTiO3 (PT). Gehring_PMN10PT More recent neutron residual stress measurements on a large single crystal of PMN at room temperature show that the cubic unit cell lattice parameter varies with the depth normal to the crystal surface, with a corresponding large surface strain. Conlon
In this paper we review and expand upon the current understanding of the skin effect in the PZN-PT and PMN-PT relaxor systems. New data are reported that demonstrate the high variability in crystal structure that can be obtained from x-ray measurements made on the same single crystal specimen, but at different locations over the crystal surface. A detailed analysis of high resolution neutron data obtained on PMN-10%PT single crystal reveals the presence of strong internal strain that does not manifest itself as a true structural transition, but is nonetheless correlated with the cubic-to-rhombohedral phase transition temperature determined with low-energy x-rays. New data is also presented that demonstrates that the depth dependence of the lattice constant measured in pure PMN varies significantly with temperature. While these findings are of obvious significance from a fundamental research point of view, they are also important because the skin effect has misled researchers into drawing incorrect conclusions about the PZN-PT and PMN-PT phase diagrams, as well as several other erroneous assumptions about the true relaxor state.
II Low Temperature Structure of PZN: X-Rays
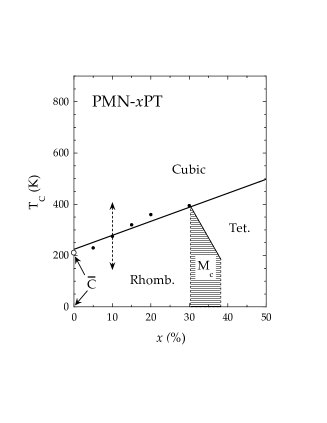
The phase diagrams of the PZN-PT and PMN-PT systems are striking in their similarity; both exhibit cubic-to-rhombohedral phase transitions at low PT content, cubic-to-tetragonal phase transitions at high PT content, and a steeply-sloped morphotropic phase boundary (MPB) separating monoclinic Noheda_PRL and tetragonal phases over a narrow range of intermediate PT concentrations. Figure 1 shows the phase diagram for PMN-PT. In addition, all compounds below the MPB exhibit exceptionally large piezoelectric coefficients as well as other properties characteristic of relaxors, namely a strongly frequency dependent dielectric susceptibility and a very large room temperature dielectric constant. Given these numerous similarities, the case of pure PMN stands out as an oddity because several studies have shown that the crystal structure retains an average cubic structure down to 5 K, Bonneau ; deMathan whereas the x-ray measurements by Lebon et al. show that pure PZN transforms to a rhombohedral phase at a transition temperature K. Lebon The unique status of PMN was made all the more curious after an intriguing study by Ohwada et al. on a zero-field cooled single crystal of PZN-8%PT did not find the expected rhombohedral phase below . Ohwada These results motivated the decision by Xu et al. to re-examine the zero-field structure of pure PZN, especially because previous studies of the structure of PZN-PT had been done on poled single crystals. Xu_PZN1 Another motivating factor were the measurements by Noheda et al. that showed that x-ray diffraction results on PZN-PT single crystals depended strongly on surface structures. Noheda_Ferro ; Noheda_PRL
Single crystals of PZN were grown via spontaneous nucleation from a high temperature solution using PbO as flux. Zhang Two triangular-shaped plates 1 mm thick and with edges roughly 3 mm in length were cut with large surfaces parallel to the cubic [111] axis from the same as-grown single crystal. The faces of both crystals were polished using a series of diamond pastes down to 3 m, and gold was sputtered onto the large faces of one crystal, which was then poled at 200 C and cooled to room temperature in a field of 20 kV/cm. The unsputtered sample was neither poled nor thermally treated, thereby leaving a potentially larger mechanical strain within the crystal. (Our measurements have shown that the structures of the skin/bulk do not vary after thermal cycling up to 800 K.) The x-ray measurements on PZN reported here were all performed at the Brookhaven National Laboratory National Synchrotron Light Source (NSLS), primarily on beamline X-17B1, which can provide x-rays with an incident energy of 67 keV and an energy resolution . The spatial extent of the focused x-ray beam on the sample was mm2. Additional measurements were made on beamline X-22A, which provided access to lower incident x-ray energies of 32 and 10.7 keV.

Figure 2 shows measurements on the unpoled single crystal of PZN at room temperature (which is well below the reported value of K) using two different incident energies of 10.7 and 32 keV, corresponding to penetration depths of 13 m and 59 m, respectively. The different panels in each figure column correspond to measurements made on different locations of the crystal surface. The data correspond to radial () scans of the scattering intensity measured across the (111) Bragg peak, which must split into two peaks in a rhombohedral phase. It is immediately apparent that the different measurements do not confirm a single crystal structure. The top-left panel shows a cubic-like single peak at one location (panel (a)), whereas a two-peaked structure, suggestive of rhombohedral symmetry, is observed at two others (panels (b) and (c)). The same discrepancy holds at the higher incident x-ray energy of 32 keV (panels (d) and (e)) even though these data correspond to a deeper penetration depth.
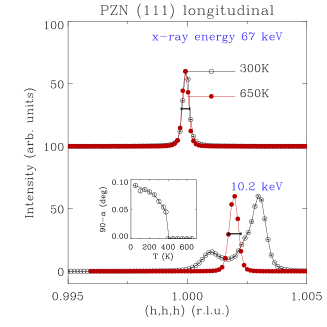
In order to probe the structure to still greater depths within the crystal, x-ray measurements were made of the same (111) reflection at an incident energy of 67 keV, which corresponds to a penetration depth of 412 m. The upper panel of Fig. 3 shows the resulting (111) Bragg peak profile, using the same radial scans shown in Fig. 2, at temperatures above (650 K) and below (300 K) K. Xu_PZN2 Remarkably, a single, resolution-limited peak is observed at both temperatures thereby indicating the absence of the rhombohedral phase previously reported by Lebon et al. At all different locations measured on the crystal at this energy, only a single resolution-limited (111) Bragg peak was observed. An effort to reproduce the lower energy (8.9 keV from Cu Kβ radiation) results of Lebon et al. were made by repeating the same measurements at 10.7 keV. These data are shown in the lower panel of Fig. 3 where it is seen that a cubic structure (single peak) is observed at 650 K as was the case at 67 keV. At 300 K, however, a clear split (111) Bragg peak profile is seen, consistent with a rhombohedral distortion. The temperature dependence of the rhombohedral angle is plotted in the inset to Fig. 3, and gives a transition temperature of 410 K, also consistent with previous reports.
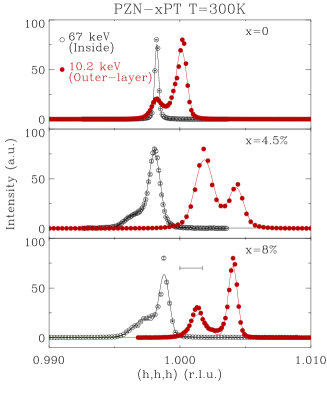
This combination of x-ray measurements, which probed varying depths of the PZN near-surface region, provides conclusive evidence for the existence of a skin effect whereby the bulk and skin of a single crystal exhibit different structures. Additional evidence of this effect was reported in a recent neutron scattering study on PZN by Stock et al., who found that the Bragg peaks broaden significantly below the x-ray determined value of K along both the radial and transverse directions, but saw no sign of a rhombohedral distortion. Stock_PZN Assuming that the phase diagrams of PZN-PT and PMN-PT should be ”universal,” the high-energy x-ray data on PZN reconcile the puzzling discrepancy at in that they demonstrate that both PMN and PZN retain an average cubic structure down to low temperatures. This leads naturally to the question of how the skin is affected by the addition of PbTiO3 (PT). To answer this, three single crystals of PZN-PT with PT concentrations , 4.5%, and 8% were studied at room temperature by Xu et al. in the same manner as described above, i. e. using incident x-ray energies of 10.2 keV and 67 keV. The data are shown in Fig. 4. Xu_APL The top panel summarizes the situation just described for PZN (), where skin and bulk exhibit different crystal structures at 300 K. At a PT concentration of 4.5%, however, both the skin region (10.2 keV data) and the crystal bulk (67 keV data) exhibit a rhombohedral phase. The difference here is that the bulk rhombohedral phase is characterized by a smaller rhombohedral angle than is that of the skin. Similar results were obtained at a PT concentration of 8%, just below the MPB, where again both skin and bulk exhibit a rhombohedral distortion, but with a smaller value of measured in the bulk. Given the penetration depth of the 10.2 keV x-rays, the thickness of the skin was estimated at roughly 10 m50 m for all samples.

The PT dependence of for both the outer-layer skin region and the crystal bulk is given in Fig. 5. Xu_APL These data demonstrate that the addition of ferroelectric PT stabilizes a low-temperature rhombohedral phase that is otherwise absent in pure PZN, and they provide new insight into the way the structure of the relaxor PZN evolves as one approaches the MPB where the greatest piezoelectric response is observed. The x-ray studies of PZN reported here have exploited the variability of the penetration depth by appropriate tuning of the incident x-ray energy. Neutrons, by contrast, have penetration depths of order 1 cm, and thus provide bulk information. Motivated by the x-ray work on PZN, a program of neutron scattering measurements on PMN-PT crystals was undertaken to determine how the rhombohedral phase evolves when adding PT into pure PMN.
III Modified Phase Diagram of PMN-PT: Neutrons
The accepted phase diagram for PMN-PT, shown previously in Fig. 1, indicates that a cubic-to-rhombohedral phase transition takes place for less than about 32%. Choi ; Noheda_PMN The solid data points are values of the transition temperature measured by different authors, Ye_PMNxPT and the solid line is a linear fit to these data. The solitary open circle at corresponds to the first-order phase transition that has been reported to occur in PMN near 213 K, but only after first cooling in an electric field kV/cm. Ye_review The notation shown by the arrow is used to denote the fact that PMN retains an average cubic structure below this temperature when zero-field cooled (ZFC). A monoclinic (Mc) phase was discovered by Noheda et al. Noheda_PMN at higher PT concentrations next to the well-known morphotropic phase boundary (MPB) separating the Mc phase from the tetragonal phase.

An interesting and detailed comparative study between PMN and PMN-10%PT was carried out by Dkhil and co-workers using both x-ray and neutron scattering techniques on powder and on single crystal samples. Dkhil Their results point to the existence of competing rhombohedral and tetragonal order that never produces a ferroelectric distortion in PMN, but does in PMN-10%PT below a critical temperature K. In addition to a rhombohedral phase, critical-like diffuse scattering was observed that peaked at . The temperature dependence of both this diffuse scattering, as well as the rhombohedral angle is given in Fig. 6. Dkhil Subsequent x-ray scattering experiments by Ye et al. on a series of PMN-PT samples detected a low-temperature rhombohedral distortion for PT concentrations as small as 5%. Ye_PMNxPT Because all of the published x-ray and neutron structural data agree in the case of PMN (both indicate a persistent cubic phase down to 5 K) it was believed that the skin effect in the PMN-PT system, if it exists at all, must be significantly smaller than that in PZN-PT. To test this idea, a single crystal of PMN-10%PT was obtained for the purpose of performing a high resolution neutron structural characterization of the material over a wide range of temperatures. Gehring_PMN10PT The dashed vertical arrow in Fig. 1 locates the structural transition at 10% PT.
The neutron scattering study was performed on the BT9 triple-axis spectrometer located at the NIST Center for Neutron Research. Diffuse scattering measurements were performed using fixed incident and final neutron energies 14.7 meV ( Å), which were obtained via Bragg diffraction from the (002) reflection of highly-oriented pyrolytic graphite (HOPG) crystals as monochromator and analyzer, and relatively relaxed horizontal beam collimations of 40′-46′-S-40′-80′ (S = sample). To maximize the instrumental -resolution, and thus the sensitivity to subtle structural distortions and changes in lattice spacing, the spectrometer was operated with a perfect Ge crystal as analyzer. More importantly, the -spacings of both the analyzer and the PMN-10%PT Bragg reflections were specifically chosen to match one another as closely as possible. This latter condition yields a minimum in the instrumental longitudinal -resolution. Emilio ; Xu_highq For the perovskite PMN-10%PT sample the -spacings associated with the (111) and (022) Bragg peak (2.333 Å and 1.4287 Å, respectively) are well-matched with those for Ge (220) and (004) (2.000 Å and 1.4143 Å). Our choice of horizontal beam collimations of 10′-46′-S-20′-40′ was based on Monte Carlo intensity simulations to improve the -resolution without an unreasonable reduction in intensity. Vinita An incident neutron energy of 8.5 meV was used for measurements of the (111) Bragg peak, which was provided via a highly oriented pyrolytic graphite monochromator, and resulted in a sharp -resolution of 0.0018 rlu FWHM (1 rlu = 2a = 1.5576 Å-1). The measurements of the (022) Bragg peak yielded an even better -resolution approaching 0.0010 rlu FWHM, thanks to a more closely matched -spacing condition between sample and analyzer.
A 2.65 g single crystal of PMN-10%PT, with approximate dimensions of mm3, was produced using a top-seeded solution growth technique. Ye_Growth The crystal mosaic full-width at half-maximum (FWHM) measured at the (200) Bragg peak at 500 K is less than 0.06∘ indicating an excellent quality sample. Access to Bragg reflections of the form and were needed to study the rhombohedral phase; therefore the crystal was mounted with the [01] axis aligned vertically. The sample was then mounted inside a high-temperature closed-cycle 3He refrigerator and fixed to the goniometer of the BT9 triple-axis spectrometer.
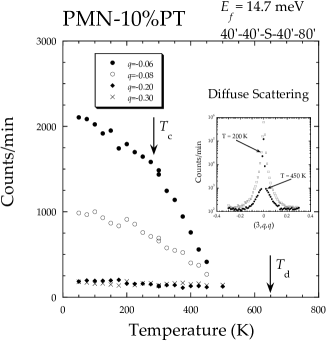
The neutron diffuse scattering data on PMN-10%PT were measured near the (300) Bragg peak (along the [011] direction) where it is known that such scattering is very strong. Hirota The temperature dependence of the diffuse scattering is shown in Fig. 7 at several selected values of the reduced wavevector . Gehring_PMN10PT An immediate discrepancy is apparent between these and the x-ray data of Dkhil et al. shown in Fig. 6 inasmuch as the neutron diffuse scattering data do not exhibit a peak at any temperature down to 50 K. Instead, a slight suggestion of a change in slope is observed in the vicinity of K for rlu. The inset to Fig. 7 shows two full scans of the (300) peak at 200 K and 450 K showing the strong growth of the diffuse scattering intensity with decreasing temperature. The presence of strong diffuse scattering below directly contradicts the x-ray results, which were obtained using an incident x-ray energy of 8.9 keV. This finding strongly suggests that a skin effect is also present in the PMN-PT system as it provides a natural explanation with which to reconcile the neutron and x-ray measurements.

Neutron scattering measurements were made at both the (111) and (022) Bragg reflections of the PMN-10%PT sample using the high -resolution configuration of the BT9 spectrometer described earlier. All reflections of the form and must split into two in the presence of a rhombohedral distortion because the unit cell is elongated along one diagonal and compressed along the others, thus giving rise to two distinct -spacings. Hence (111) and Bragg peaks will no longer be identically situated in reciprocal space, and their relative intensities will give the relative domain populations for each reflection. Radial scans of the neutron scattering intensity across the (111) Bragg peak are presented in Fig. 8 both above and below K, and these are compared to equivalent scans across the (222) Bragg peak measured with x-rays. Gehring_PMN10PT The horizontal scales of the x-ray data have been adjusted to allow for a direct scan by scan comparison.
At high temperatures, both neutron and x-ray data show a single resolution-limited Bragg peak consistent with a cubic structure. But below the x-ray measurements reveal a definitive splitting of the (222) Bragg peak whereas the neutron data do not. Instead, the neutron measurements continue to show a single peak. Moreover, the neutron peak width is less than the splitting observed in the x-ray scan, thus providing even stronger confirmation of the absence of any rhombohedral distortion in the bulk of the PMN-10%PT single crystal. Some broadening is apparent in the neutron case at 100 K. This could either be the result of internal strain, which would manifest as a radial broadening, and/or it could be due to the contribution from the skin. Spatially resolved neutron diffraction measurements of the near-surface strain by Conlon et al. in a single crystal of pure PMN, where both a dramatic change in the lattice constant and the Bragg peak intensities is observed over a length scale of order 100 m, Conlon suggest that strain is the most likely source of this broadening, and will be discussed in the following section.

The thermal expansion of the PMN-10%PT sample was measured from 10 K to 600 K by carefully measuring the (022) Bragg peak radial profile with high -resolution. It was noted that these data were significantly better fit using the sum of two Gaussian functions of , one sharp and the other broad. The temperature dependences of the resulting peak intensity and lattice spacing for these two components are shown in the top and middle panels of Fig. 9. The notable feature here is that the sharp component intensity and associated lattice constant show no significant feature that correlates with . By contrast, the same parameters associated with the broad component correlate quite well with the x-ray determined value of . In particular, the thermal expansion shown in the middle panel behaves as expected for a normal ferroelectric. Xu_PMNxPT We emphasize here that the broad component is a single peak, and still quite narrow, and thus does not represent a rhombohedral distortion. Rather the broad peak is believed to represent a highly strained region of the crystal bulk.
The lattice constant associated with the sharp component is intriguing in that it exhibits an almost temperature independent behavior from 10 K to 400 K, with the -spacing changing by less than 0.001 Å over this temperature range. However at 400 K both the lattice constant and the peak intensity exhibit abrupt changes. Indeed, the rate of thermal expansion becomes extremely large, being roughly K-1, which is considerably larger than the value K-1, which is typical of other oxides. It is suggestive that this temperature is very close to those observed in pure PMN and PMN-20%PT, where both the maximum broadening of the TA mode occurs and the minimum value of the TO soft mode is obtained. Wakimoto_PMN1 ; Wakimoto_PMN2 ; Koo The bottom panel of Fig. 9 shows the variation of the peak widths (FWHM) for the two Gaussian components. In this case it is interesting that the sharp component FWHM appears to correlate more obviously with than does that of the broad component.
IV Depth-Dependent Lattice Parameter and Surface Strain in PMN: Neutrons
The x-ray and neutron results obtained on PMN-10%PT, when viewed together, point strongly to the presence of a skin effect like that documented by Xu et al. in PZN. The concept of a near-surface region having a structure distinct from that of the bulk would also provide a natural explanation of the results from x-ray and neutron powder diffraction studies of the low-temperature structure of both PMN and PZN, for which a two-phase model, one cubic and the other rhombohedral, is required to describe the observed powder peak intensity profiles. Iwase ; deMathan Because neutrons interact weakly with matter (typical penetration depths being of order 1 cm) any observable scattering signal from the skin would imply a substantial skin volume. This could be the result of a ”thick” skin of order many microns in single crystals, or a large effective surface area, as would be the case in powdered samples.
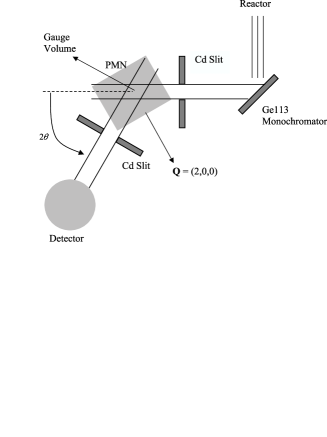
To examine this idea, neutron residual stress measurements were performed by Conlon et al. on the L3 double-axis spectrometer, which is located at the National Research Universal (NRU) reactor at Chalk River Laboratories, in order to study neutrons diffracted from a very large 9.3 cc single crystal of PMN as a function of depth. Conlon The PMN crystal was grown by the modified Bridgeman technique, the details of which are described elsewhere. Luo A schematic diagram of the L3 instrument is shown in Fig. 10, where a Ge(113) crystal was used to monochromate the incident beam to an energy of meV, and horizontal beam collimations of 60′-30′-S-30′ were used in conjunction with cadmium (strong neutron absorbers) slits placed both before and after the sample. An HOPG filter was placed in the incident beam to remove higher order harmonics (i. e. neutrons with wavelengths , , etc.). The crystal was cut in order to provide a large and well-defined 100 surface, and neutrons scattered from the (200) Bragg peak from this surface at room temperature were recorded in a reflection geometry as indicated in the schematic.
The residual stress technique allows a measurement of lattice strain as a function of depth normal to the crystal surface through the use of narrow absorbing slits, or masks, that provide a high degree of angular collimation of both the incident and scattered beams. The result is that only neutrons scattered from a small ”gauge” volume, represented by the diamond-shaped region in Fig. 10, are recorded by the detector. By translating the large single crystal along the scattering vector , in this case the (200) Bragg peak, and then measuring radial scans of the Bragg peak intensity at each value of translation, the lattice constant of the sample can be probed as a function of depth.
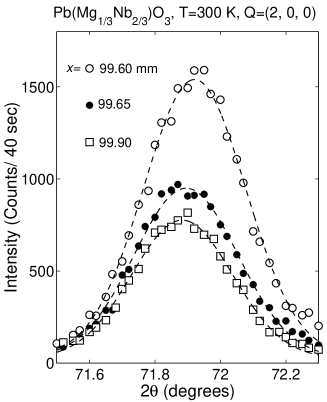
Data from scans are shown in Fig. 11 for three different translational settings. Conlon Two features are readily apparent from this figure: the first is the shift of the center of the (200) Bragg peak in , thus indicating a measurable change of the lattice parameter over a depth of 0.3 mm (300 m), while the second is the dramatic change in the peak intensity. This latter effect is due to the extinction effect, which has been observed previously in analogous neutron scattering measurements of the second length scale phenomenon in Tb and SrTiO3 for which a residual stress configuration was used. Gehring_Tb1 ; Hirota_Tb1 ; Gehring_Tb2 ; Rutt As a cross check of these data, a perfect germanium single crystal was studied in exactly the same way using the Ge (220) reflection. The -spacing of the Ge (220) Bragg peak is almost identical to that of the PMN (200) Bragg peak. This allows the instrument scattering angles to remain nearly the same, and thus provides a direct test of the observed change in lattice parameter with depth (translation). Unlike the case of PMN, no significant strain or change in lattice spacing was observed in the near surface region of the perfect germanium single crystal over a depth of more than 1000 m. An additional check was made by measuring rocking curves ( scans) to determine the crystal mosaic as a function of depth. The mosaics obtained near the surface and deep within the bulk were both measured to be , thus demonstrating that the change in lattice constant is not an artifact of a variation in mosaic spread or the presence of another crystal domain near the surface.
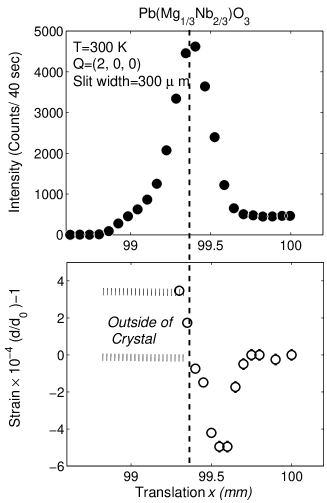
Figure 12 shows the depth dependence of the (200) Bragg peak intensity (top panel) and the crystal lattice spacing (bottom panel) over a range exceeding 500 m. Conlon The large variation in the peak intensity is due to the extinction effect mentioned above, and cannot be ascribed solely to the linear attenuation of the incident and scattered neutron beams as they traverse through the PMN crystal. The variation of Bragg intensity is important, however, as it can be used to locate the surface of the sample on the translation axis. The crystal surface should correspond to the translation that gives the maximum intensity as this will be when the gauge volume lies completely below the crystal surface. At this point, the scattering volume is a maximum, while the effects from extinction are minimal. The bottom panel shows a strong variation in the lattice spacing spanning several hundred microns (see Fig. 11), and thus confirms the existence of a skin effect in pure PMN. It thus appears to be the case that the skin is not ”thin” in PMN; rather the crystal structures of the bulk and skin are both cubic, and there is a substantial near surface strain.
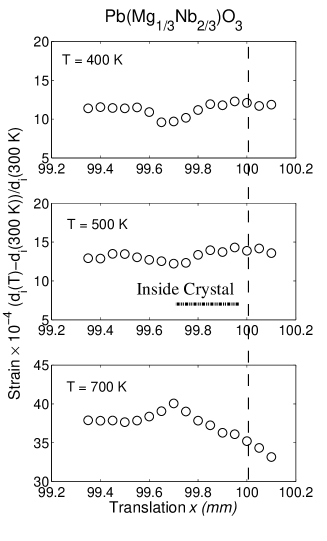
All of the residual stress measurements presented so far were performed at room temperature. Figure 13 shows data obtained in a manner identical to that in the bottom panel of Fig. 12, but at three higher temperatures, namely 400 K, 500 K, and 700 K. The striking aspect of these data is the reversal of the strain minimum apparent at 300 K in Fig. 12, which slowly evolves into a maximum at 700 K in the bottom panel of Fig. 13. While the number of temperatures reported here are insufficient to draw any definitive conclusions about this effect, it is very interesting to note that the Burns temperature , below which local regions of randomly oriented polar order on a nanometer scale first appear, Burns lies between 600 K and 700 K. It is tempting to speculate that these polar nanoregions might have some relationship to the skin, and that they may also play an important role in the invar-like thermal expansion observed from 10 K to 400 K.
V Discussion
The combination of x-ray and neutron measurements presented here provide conclusive proof of a significant surface layer in single crystal specimens of both PZN-PT and PMN-PT systems. The presence of this skin has led to incorrect phase assignments in the phase diagrams of both systems inasmuch as no rhombohedral phase is present at sufficiently low PT concentrations in either case, the low-temperature phase remaining cubic. A crossover to a low-temperature rhombohedral phase does take place in PZN-PT between and % whereas a similar crossover occurs in the PMN-PT system between % and %˙Xu_PMNxPT That the skin effect persists over such a large temperature range, and that the skin thickness spans many tens of microns, are extremely unusual. In the case of the second length scale phenomena observed in Tb and SrTiO3, the anomalous extra component in the critical scattering associated with a phase transition was also observed over a large depth of order 100 m, but it persisted only over a very limited temperature range. Gehring_Tb1 ; Rutt In some of these relaxor compounds, the skin and crystal bulk could exhibit different crystal structures (PZN and PMN-10%PT), while in others they possess the same structure (cubic or rhombohedral), but with either different lattice spacings (PMN) or different sized rhombohedral distortions (PZN-4.5%PT and PZN-8%PT). Some logical questions for future study are whether or not the skin varies with electric field? If so does it get bigger or smaller? Such studies are in progress, including one to examine the field-induced transition in PMN with high- resolution, as well as the effects on the strong diffuse scattering. Stock_PMN It is evident that future theoretical models of these relaxor systems will need to account for the observed anomalous skin effect.
Acknowledgements.
The authors wish to acknowledge first and foremost the friendship and support provided by Dr. Gen Shirane of Brookhaven National Laboratory, who passed away suddenly in January of 2005. His guidance, genius, and boundless enthusiasm formed the foundation for all of the relaxor studies presented here. Gen’s unceasing scientific curiosity and his tireless drive to discover new physical phenomenon were a continuous source of inspiration to all of us. He shall be sorely missed. We dedicate this paper to his memory, and we express our deep gratitude for all that he has taught us. The authors also wish to acknowledge stimulating discussions with Dwight Viehland and JieFang Li. Finally, financial support from the U.S. Department of Energy under Contract DE-AC02-98CH10886 is also gratefully acknowledged.References
- (1) S.-E. Park and T. R. Shrout, J. Appl. Phys. 82, 1804 (1997).
- (2) R. F. Service, Science 275, 1878 (1997).
- (3) Z.-G. Ye, Key Engineering Materials Vols. 155-156, 81 (1998).
- (4) G. Xu, Z. Zhong, Y. Bing, Z.-G. Ye, C. Stock, and G. Shirane, Phys. Rev. B 67, 104102 (2003).
- (5) G. Xu, Z. Zhong, Y. Bing, Z.-G. Ye, C. Stock, and G. Shirane, Phys. Rev. B70, 064107 (2004).
- (6) G. Xu, H. Hiraka, G. Shirane, and K. Ohwada, Appl. Phys. Lett. 84, 3975 (2004).
- (7) P. M. Gehring, W. Chen, Z.-G. Ye, and G. Shirane, J. Phys.: Condens. Matter 16, 7113 (2004).
- (8) K. H. Conlon, H. Luo, D. Viehland, J. F. Li, T. Whan, J. H. Fox, C. Stock, and G. Shirane, Phys. Rev. B 70, 172204 (2004).
- (9) B. Noheda, D. E. Cox, G. Shirane, S.-E. Park, L. E. Cross, and Z. Zhong, Phys. Rev. Lett. 86, 3891 (2001).
- (10) P. Bonneau, P. Garnier, E. Husson, and A. Morell, Mater. Res. Bull. 24, 201 (1989); P. Bonneau, P. Garnier, G. Calvarin, E. Husson, J. R. Gavarri, A. W. Hewat, and A. Morell, J. Solid State Chem. 91, 350 (1991).
- (11) N. de Mathan, E. Husson, G. Calvarin, J. R. Gavarri, A. W. Hewat, and A. Morell, J. Phys.: Condens. Matter 3, 8159 (1991).
- (12) A. Lebon, H. Dammak, G. Calvarin, and I. Ould Ahmedou, J. Phys.: Condens. Matter 14, 7035 (2002).
- (13) K. Ohwada, K. Hirota, P. W. Rehrig, Y. Fuji, and G. Shirane, Phys. Rev. B 67, 094111 (2003).
- (14) B. Noheda, D. E. Cox, and G. Shirane, Ferroelectrics 267, 147 (2002).
- (15) L. Zhang, M. Dong, Z.-G. Ye, Mater. Sci. Eng., B 78, 96 (2000).
- (16) C. Stock, R. J. Birgeneau, S. Wakimoto, J. S. Gardner, W. Chen, Z.-G. Ye, and G. Shirane, Phys. Rev. B 69, 094104 (2004).
- (17) S. W. Choi, T. R. Shrout, S. J. Jang, A. S. Bhalla, Ferroelectrics 100, 29 (1989).
- (18) B. Noheda, D. E. Cox, G. Shirane, J. Gao, and Z.-G. Ye, Phys. Rev. B 66, 054104 (2002).
- (19) Z.-G. Ye, Y.Bing, J. Gao, A. A. Bokov, P. Stephens, B. Noheda, and G. Shirane, Phys. Rev. B 67, 104104 (2003).
- (20) B. Dkhil, J. M. Kiat, G. Calvarin, G. Baldinozzi, S. B. Vakhrushev, and E. Suard, Phys. Rev. B 65, 024104 (2001).
- (21) J. E. Lorenzo et al., Phys. Rev. B 50, 1278 (1994).
- (22) G. Xu, P. M. Gehring, V. J. Ghosh, and G. Shirane, Acta Cryst. A 60, 598 (2004).
- (23) Our choice of beam collimations were based on Monte Carlo intensity simulations performed by Vinita Ghosh.
- (24) Z.-G. Ye, P. Tissot, and H. Schmid, Mater. Res. Bull. 25, 739 (1990).
- (25) K. Hirota, Z.-G. Ye, S. Wakimoto, P. M. Gehring, and G. Shirane, Phys. Rev. B 65, 104105 (2002).
- (26) S. Wakimoto, C. Stock, R. J. Birgeneau, Z.-G. Ye, W. Chen, W. J. L. Buyers, P. M. Gehring, and G. Shirane, Phys. Rev. B 65, 172105 (2002).
- (27) S. Wakimoto, C. Stock, Z.-G. Ye, W. Chen, P. M. Gehring, and G. Shirane, Phys. Rev. B 66, 224102 (2002).
- (28) T. Y. Koo, P. M. Gehring, G. Shirane, V. Kiryukhin, S.-G. Lee, S.-W. Cheong, Phys. Rev. B 65, 144113 (2002)
- (29) T. Iwase, H. Tazawa, K. Fujishiro, Y. Uesu, and Y. Yamada, J. Phys. Chem. Solids 60, 1419 (1999).
- (30) H. Luo, G. Xu, H. Xu, P. Wang, and Z. Yin, Jpn. J. Appl. Phys, Part 1 39, 5581 (2000).
- (31) P. M. Gehring, K. Hirota, C. F. Majkrzak, and G. Shirane, Phys. Rev. Lett. 71, 1087 (1993).
- (32) K. Hirota, G. Shirane, P. M. Gehring, and C. F. Majkrzak, Phys. Rev. B 49, 11967 (1994).
- (33) P. M. Gehring, K. Hirota, C. F. Majkrzak, and G. Shirane, Phys. Rev. B 51, 3234 (1995).
- (34) U. Rütt, A. Diederichs, J. R. Schneider, and G. Shirane, Europhys. Lett. 39, 395 (1997).
- (35) G. Burns and F. H. Dacol, Solid State Commun. 48, 853 (1983).
- (36) G. Y. Xu, D. Viehland, J. F. Li, P. M. Gehring, and G. Shirane, Phys. Rev. B 68, 212410 (2003).
- (37) C. Stock, G. Y. Xu, P. M. Gehring, H. Luo, and G. Shirane, in preparation.