Point-contact Andreev-reflection spectroscopy in segregation-free Mg1-xAlxB2 single crystals up to
Abstract
We present new results of point-contact Andreev-reflection (PCAR) spectroscopy in single-phase Mg1-xAlxB2 single crystals with up to 0.32. Fitting the conductance curves of our point contacts with the two-band Blonder-Tinkham-Klapwijk model allowed us to extract the gap amplitudes and . The gap values agree rather well with other PCAR results in Al-doped crystals and polycrystals up to reported in literature, and extend them to higher Al contents. In the low-doping regime, however, we observed an increase in the small gap on increasing (or decreasing the local critical temperature of the junctions, ) which is not as clearly found in other samples. On further decreasing below 30 K, both the gaps decrease and, up to the highest doping level and down to K, no gap merging is observed. A detailed analysis of the data within the two-band Eliashberg theory shows that this gap trend can be explained as being mainly due to the band filling and to an increase in the interband scattering which is necessary to account for the increase in at low Al contents (). We suggest to interpret the following decrease of for K as being governed by the onset of inhomogeneity and disorder in the Al distribution that partly mask the intrinsic effects of doping and is not taken into account in standard theoretical approaches.
pacs:
74.50.+r, 74.45.+c, 74.70.Ad1 Introduction
As well known, the superconductivity in MgB2 is characterized by two distinct energy gaps due to the presence of various bands crossing the Fermi level (generally grouped in two systems: the 3D bands and the 2D bands) and to the exceedingly small quasiparticle scattering between these bands. The values of the gaps measured in pure MgB2 by many different techniques agree very well with those calculated within the two-band models in BCS [1] or Eliashberg approach [2]. The multi-band nature of MgB2 allows explaining most of its features – in particular, the relatively high critical temperature and its unexpected robustness against sample quality – but also hugely increases the complexity of the effects that can arise when the system is in some way “perturbed”.
A particularly interesting and debated point in the physics of MgB2 is the possibility to attain the so-called “gap merging”, i.e. the complete isotropization of the compound with consequent collapse of the two gaps in a single gap with BCS character [1]. Within the two-band Eliashberg theory, the gap merging can be attained, for example, by keeping all the parameters as in pure MgB2 and only increasing the interband scattering rate, . The two gaps approach each other asymptotically as a function of , while the critical temperature is reduced; for sufficiently high values of this parameter ( meV), one expects the two gaps to be virtually indistinguishable. The critical temperature of “isotropic” MgB2 varies between 19 and 26 K, depending on the calculations [2, 1]. Actually, such values of are not physical since it is practically impossible to increase the interband scattering without affecting other parameters of the material, namely the partial DOS of the or bands. This is true for chemical substitutions in MgB2, e.g. carbon in the B site and aluminum in the Mg site [3], but also, unexpectedly, for neutron irradiation [4]. Generally speaking, the coexistence of various effects makes it difficult to experimentally single out their contributions. Fortunately, pair breaking from interband scattering gives rise to peculiar effects so that it can be separated rather easily from other sources of reduction: suppresses and the large gap , simultaneously increasing the smaller gap .
In a theoretical paper by Erwin and Mazin [5], Al substitution in the Mg site was proposed as an effective way to increase the scattering between bands. First-principle calculations gave, for 2% of Al, a value of meV, which is already expected to have measurable effects on the critical temperature and on the gaps [5]. This made the Mg1-xAlxB2 system the most likely candidate for the attainment of the gap merging.
In the past years, many experimental efforts have been made to test these predictions. Aluminum substitution was indeed one of the first successfully obtained in MgB2 [3]. Al atoms in MgB2 are almost completely ionized, exactly like the Mg atoms they substitute. Aluminum is thus a donor and the three electrons in its outer shell enter the system of bands giving rise to electron doping. The effects of the substitution on the lattice are rather complicated by a strong tendency to the formation of different phases. Early reports [3] showed the presence of two phases with AlB2 structure and different axis in polycrystalline samples of nominal Al content between 0.1 and 0.25. A similar result was found in single crystals grown at ETH (Zurich) by means of a high-pressure, cubic-anvil technique. In this case, the precipitation of a non-superconducting MgAlB4 phase was observed for by High-Resolution TEM and other structural analysis techniques [6]. An independent, indirect confirmation to this picture came from point-contact Andreev-reflection (PCAR) measurements we performed in those single crystals, which showed an anomalous trend of the gaps and as a function of the Al content [7, 6], with a crossover between two regimes around . For , the large gap decreased linearly with while the small gap showed a pronounced tendency to increase, as theoretically expected [5]. For , was found to saturate at about 4 meV, while was fast suppressed becoming smaller than 1 meV at . An analysis of the data within the two-band Eliashberg theory showed that the trend observed for could be explained by a decrease in the -band superconducting coupling, that we argued could be related to the precipitation of the spurious phase [6].
These anomalies were not confirmed by successive measurements we performed in polycrystalline Mg1-xAlxB2 samples grown in Genova [8] that did not suffer from extended phase segregation even at high Al contents (). In fact, their growth technique involved a very long high-temperature reaction (100 h at 1000 ∘C) and no evidence of spurious phases was found by XRD – even though successive microprobe analyses (wavelength-dispersive X-ray spectroscopy, WDX) showed a small amount (4% of the volume at most) of a secondary phase in the form of micrometer-size islands embedded in a (Mg,Al)B2 matrix [9] that were concluded to have negligible effect on the superconducting properties. PCAR measurements we carried out in these polycrystals showed an almost linear decrease of both and as a function of the Al content which turned out to be in qualitative agreement with the findings of specific-heat measurements in the same samples [8] as well as with the results of PCAR measurements in crystals and polycrystals carried out by other groups [10, 11]. In all these cases, no gap merging was observed up to , but its occurrence at a higher Al content (corresponding to around 12 K)[10] was apparently suggested by the overall gap trends.
Recently, new Mg1-xAlxB2 crystals have been grown at ETH that do not show phase segregation up to . In this paper we present the results of PCAR measurements on this new generation of single crystals, and compare them to the results of PCAR on polycrystals grown in Genova [8] as well as to other data in literature [10, 11, 12]. We will show that: i) our data extend previous results in single crystals [10] up to the region of extremely high doping; ii) our data differ from most of the results in literature in the low-doping region, where we observe a much more marked increase in the small gap on increasing . Once reported as a function of the critical temperature of the junctions, , the values of reach a maximum around K and then start to decrease; iii) this trend nicely agrees with that observed by specific-heat measurements in high-quality polycrystals free of compositional gradients [12]; iv) our data show no gap merging up to and down to K. We will also show that the trend of the gaps in our single crystals can be well explained within the two-band Eliasberg theory as being due to the band filling (which is the dominant effect of Al doping) and to a substantial increase in interband scattering in the low-doping region (). This intrinsic effect of Al doping explains the observed initial increase in on increasing , while for other phenomena, e.g. inhomogeneities in the dopant distribution – witnessed by a sudden increase in the superconducting transition width – may concur in making the gaps decrease again. In this range of doping, all the theoretical models that do not take into account inhomogeneity and disorder should be used with some caution as their predictions might not reflect actual properties of the compound.
2 Experimental
2.1 The samples
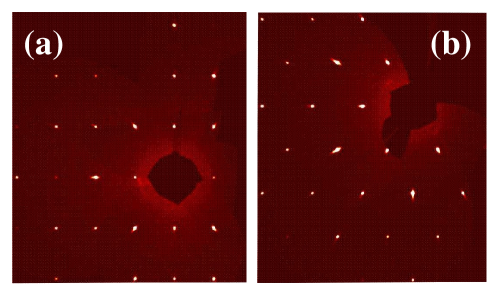
Mg1-xAlxB2 single crystals were grown by using the high-pressure cubic-anvil technique described elsewhere [13, 14], starting from pure B powder and a Mg-Al alloy and tuning time, pressure and temperature to eliminate phase segregation. As usual, the Al content was determined by energy dispersive X-ray analysis (EDX) and ranged between 0.02 and 0.32. A thorough characterization of the structural, morphological, chemical and superconducting properties was performed, by using the techniques described in [6]. In particular, the quality of the crystals was checked by XRD using a X-ray diffractometer equipped with CCD area detector (Xcalibur PX, Oxford Diffraction), which allowed us to examine the whole reciprocal space (Ewald sphere) for the presence of other phases or crystallites with different orientation. No additional phases (impurities, twins or intergrowing crystals) were detected by examination of the reconstructed reciprocal space sections. This is clearly seen by comparing figure 1 of this paper to figure 5 of [6].
The crystals revealed MgB2 structure [15]. The structure refinement results of two samples with high Al content are presented in Table 1. Because Al and Mg have almost the same amount of electrons (12 and 13 respectively) the refinement was performed without Al and the position of Mg was considered to be occupied with both atoms. The presented refinement results of two highly-doped samples and their reconstructed reciprocal space sections show that the crystals chosen for subsequent PCAR analysis are of a high quality and satisfy the requirements for single crystals. On the basis of these data, we can exclude the influence on measured properties of some possible factors like polycrystallinity, additional phases, strong disorder etc.
| AN394/5 | AN412/5 | ||
| Empirical formula | (MgAl)0.94B2 | (MgAl)B2 | |
| Temperature, K | 295(2) | ||
| Wavelength,Å/radiation | 0.71073/ MoK | ||
| Diffractometer | Oxford diffraction 4-circle | ||
| diffractometer (CCD detector) | |||
| Crystal system | Hexagonal | ||
| Space group | P6/mmm | ||
| Unit cell size (Å) | |||
| Unit cell volume (Å3) | 28.892(6) | 27.913(8) | |
| 1 | |||
| Absorption correction type | analytical | ||
| Crystal size (mm) | |||
| Theta range (deg) | 5.79 to 36.13 | 7.69 to 33.05 | |
| Limiting indices | |||
| Reflections collected/unique | 204/46, Rint=0.0364 | 156/37, Rint=0.0179 | |
| Refinement method | Full-matrix least-squares on | ||
| Data/restraints/parameters | 46/0/6 | 37/0/6 | |
| Goodness of fit on | 1.005 | 1.071 | |
| Final R indices [] | R1=0.0243, wR2=0.0611 | R1=0.0162, wR2=0.0409 | |
| R indices (all data) | R1=0.0324, wR2=0.0620 | R1=0.0174, wR2=0.0411 | |
| (e/Å3) | 0.354 and -0.350 | 0.222 and -0.247 | |
| Fractional atomic coordinates | and atomic displacement parameters (Å2) | ||
| B | x=1/3; y=2/3; z=1/2 | ||
| (Mg,Al) | x=0; y=0; z=0 | ||
| , B | 0.010(1) | 0.007(1) | |
| , B | 0.014(1) | 0.010(1) | |
| , B | 0.005(1) | 0.003(1) | |
| , (Mg,Al) | 0.009(1) | 0.008(1) | |
| , (Mg,Al) | 0.012(1) | 0.008(1) | |
| , (Mg,Al) | 0.005(1) | 0.004(1) |
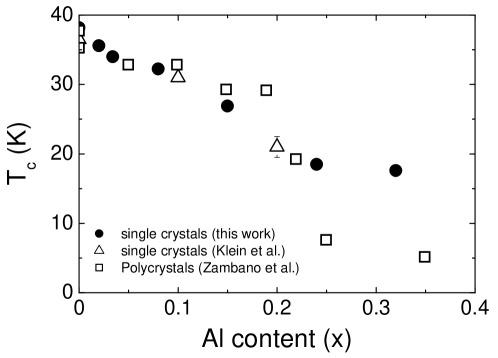
Figure 2 shows the relation between the Al content and the bulk Tc given by DC susceptibility in our single crystals (black circles). The critical temperature was defined here as the abscissa of the intersection between the axis and the linear fit of the susceptibility vs. in the region of the transition. The transition width (defined as ) increases on increasing the Al content, from 0.77 K in the crystal with up to about 9 K in the most doped sample (). The large values of in heavily doped samples can be related to the local inhomogeneity in the dopant content [9, 16], and to the smallness of the coherence length that allows inhomogeneities on a scale of the order of to be resolved [17]. A contribution from the simple disorder consequent to Al doping may be present as well, but other sources of broadening are either negligible or excluded by the single-crystal nature of our samples. For instance, due to the small DC field used in the magnetization measurements (2 to 5 Oe), effects related to the magnetic field are certainly small. It will be clear in the following that the inhomogeneous distribution of Al in the crystals does not invalidate the results of local measurements such as PCAR spectroscopy, provided that the gap amplitudes are reported as a function of the local critical temperature in the region of the contact and not as a function of the (average) Al content or of the bulk .
2.2 Point-contact Andreev-reflection measurements
Before starting with the point-contact measurements, we cleaned the crystals and etched their surface by dipping them into a solution of 1% HCl in dry ethanol. After 2-5 minutes, we rinsed the crystals in pure ethanol and dried them with nitrogen. The point-contact measurements were performed by using the “soft” technique described elsewhere [19]. Instead of pressing a metallic tip against the sample as in standard PCAR, we made the contact by using as a counterelectrode a small spot of Ag conductive paint. This pressure-less technique can be used also on brittle samples and, in thin single crystals, allows injecting the current (mainly) along the planes [19], so as to measure both the and -band gap at the same time [20]. The diameter of the Ag-paint spot is typically m that, however, does not correspond to the actual size of the point contacts. As a matter of fact, parallel microjunctions are very likely to form between the crystal surface and the Ag particles in the paint within the macroscopic contact area, so that the measured characteristics and conductance curves should be regarded as an average over a certain region in direct space. Usually, the potential barrier at the N/S interface is rather low so that the contacts are in the Andreev-reflection regime. Otherwise, the characteristics of the contact and its normal-state resistance can be tuned by using short voltage or current pulses [4, 19]. The formation or modification of contacts with the help of electric pulses is well known in standard electrotechnics [21]. It was also used, already in the Seventies, to create point contacts for phonon spectroscopy in normal metals [22] or high-quality Josephson contacts between two superconductors [23]. During a voltage pulse (in our case of the order of 1 V for some milliseconds), the contact region can be heated well above the bath temperature. This phenomenon was shown to give rise to local annealing in heavily neutron-irradiated MgB2 [4], but in the present case this drawback can be ruled out because the crystals are already well annealed [6] and no enhancement of the local above the bulk value has ever been observed.
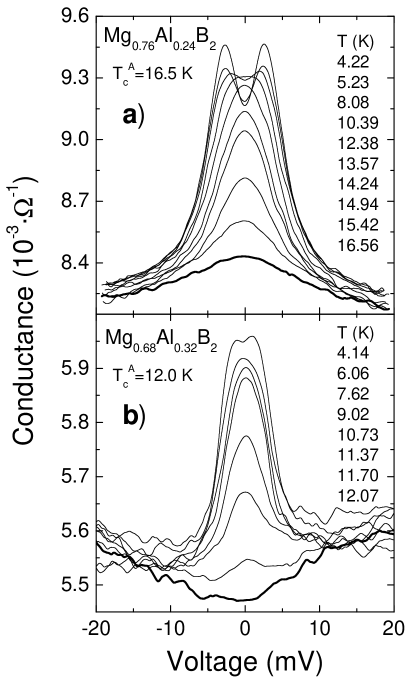
Figure 3 shows two examples of raw conductance curves measured in the crystals with and as a function of temperature. A subset of the complete series is shown for clarity. The values of the normal-state resistance of the junctions are and , respectively. Such high values of are necessary to fulfill the conditions for ballistic transport through the junction [24], because of the shortening of the mean free path due to Al doping. Let’s suppose for a moment that a single contact is established between the crystal and a Ag grain in the paint; then the whole resistance is due to this single contact and, using the residual resistivity of the most-doped crystal (cm), the relationship between and the mean free path reported in [25], and the Sharvin formula [24], one can evaluate the contact radius from the contact resistance. If the result is Å that is indeed much smaller than the mean free path Å. This ensures ballistic transport even if a single contact is established between sample and counterelectrode. If several contacts are present, as it probably happens in our case, each of them has higher resistance than the parallel as a whole and is thus certainly ballistic.
The temperature at which the Andreev-reflection features disappear and the normal-state conductance is recovered will be in the following referred to as the local critical temperature of the contact, or the “Andreev critical temperature” . The values of are reported in figure 3 for both the contacts. In doped samples, because of the local inhomogeneity in the Al content, different contacts on the same sample can provide different gap amplitudes and different . All the values of are included between the onset and the completion of the magnetic transition, so that in samples with a wide superconducting transition (especially the most doped ones) values of substantially smaller than the bulk can be obtained. For these reasons, is more appropriate than the bulk to describe the properties of the contact.
3 Results
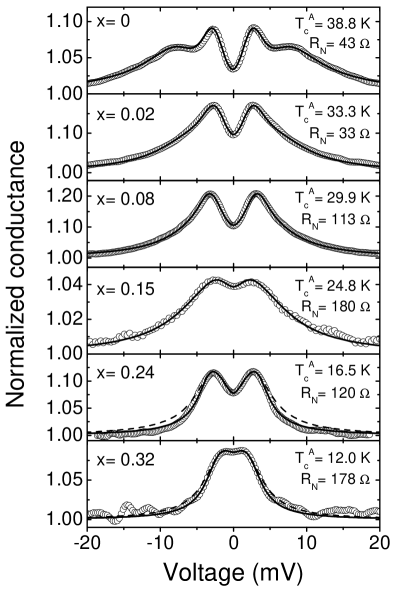
Figure 4 shows the conductance curves =d/d measured in ab-plane contacts in single crystals with different Al contents from 0 up to 0.32. All the curves are normalized, i.e. divided by the normal-state conductance (measured at or in a magnetic field ). The rather small amplitude of the normalized conductance curves is related to the “soft” point-contact technique we use. In particular, it is due to some very thin (smaller than the coherence length ) impurity layer on the surface of the Ag grains in the paint, which gives rise to inelastic scattering at the interface. As shown in [26], this effect does not affect the measured gap values and can be accounted for by simply inserting an extrinsic broadening in the BTK fit of the conductance curves (see Appendix A).
To obtain the gap values, we fitted the experimental curves with the two-band BTK model in which the conductance of the junction is a weighed sum of and : [20]. and depend on the relevant gap amplitude ( or ), on the effective potential barrier parameter ( or ), and on a broadening parameter ( or ), in conformity to the conventional BTK model [27] modified by including the effect of the quasiparticles lifetime [28, 29] (for further details, see Appendix A). The two-band BTK best-fitting curves are indicated in figure 4 as solid lines.
In the low-doping regime (up to ) there is no point to compare the two-band BTK fit with the single-band one; the latter is always of poor quality and does not reproduce the position of the peaks and the width of the Andreev features. However, in the most doped samples (where, in principle, a gap merging could occur) this comparison cannot be omitted. As a matter of fact, dashed lines in the two bottom panels of the same figure represent the single-band BTK curves that best fit the experimental conductance curves. As discussed in Appendix A, the two-band fit is always preferable (even in the case, where the two theoretical curves are very similar to each other) on the basis of a statistical Fisher F-test. This would lead to the conclusion that two gaps are always present in the Al-doped crystals, even at the highest doping content.
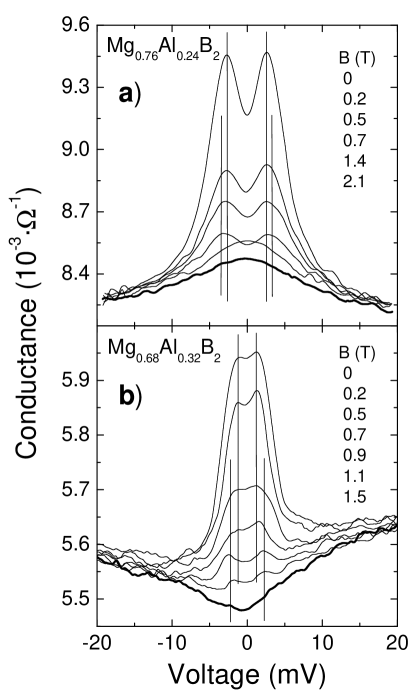
However, the most reliable test for the actual presence of two gaps consists in studying the magnetic-field dependence of the conductance curves, owing to the faster suppression of the -band gap by the magnetic field [30]. In pure MgB2, this technique allowed us to separate the partial and -band conductances and to fit each of them with a standard, three-parameter BTK model [19, 30]. In doped samples, the complete separation is not always possible but, if two gaps are present, an outward shift of the conductance maxima is observed at a certain magnetic field, when the -band conductance becomes dominant. Figure 5 reports the magnetic-field dependence of the conductance curves of the two contacts in the most Al-doped crystals ( and ) whose temperature dependencies have been already shown in figure 3. Vertical lines indicate the maximum shift of the conductance peaks, that witnesses the presence of two gaps (rather close to each other) and justifies the two-band BTK fit reported in the two bottom panels of figure 4.
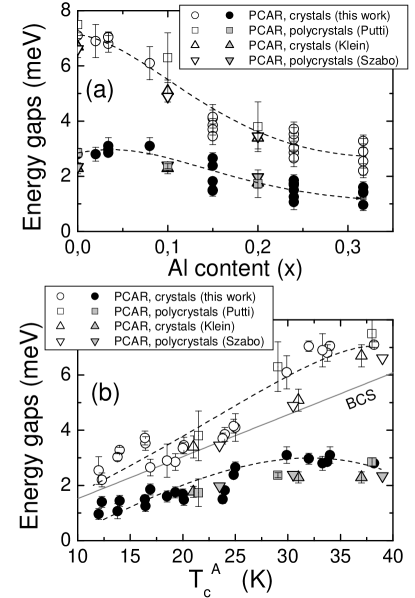
The gap amplitudes and given by the two-band fit of the conductance curves of our point contacts in Al-doped single crystals (of which figure 4 showed a subset) are reported as a function of the Al content in figure 6(a). The vertical spread of data for each doping content gives an idea of the variation in the local gap values in different contacts on the same crystal. The trend of the gaps and is however clear: The large gap monotonically decreases on increasing in the whole doping range, while the small gap first slightly increases – reaching a maximum of 3.1 meV at – and then starts to decrease. For , the slope of the two curves is apparently the same.
The vertical dispersion of data can be partly removed by plotting the gaps as a function of the critical temperature of the contacts, , as in figure 6(b). The same figures also report other PCAR data from literature, obtained by us in polycrystals [8] (squares) and by other groups in single crystals [10] (up triangles) and polycrystals [11] (down triangles). Recent STM measurements of the -band gap in crystals grown at ETH substantially agree with these data [31].
In the high-doping region ( K) all the data sets agree very well with one another independent of the nature of the samples. In particular, our data nicely extend the curves previously obtained in single crystals by Klein et al. down to very low critical temperatures (well below the theoretical limit for gap merging in the hypothesis of pure interband scattering [1, 32]). In the low-doping region, a substantially common trend is observed for the large gap , although our data (both in crystals and polycrystals) are a little higher than those reported in literature [10, 11]. One may wonder whether this shift is related to the “soft” PCAR technique. This is not the case, since in pure MgB2 we obtained gap values in excellent agreement with those shown here (at the highest ) also by standard PCAR measurements with Au or Pt tips [33]. Whatever its origin, this shift makes our values for and fall above and below the BCS value (straight line in figure 6b), respectively, while in many data reported in literature is very close to the BCS line or even falls below it. A similar effect has been recently observed in heavily neutron-irradiated MgB2, but in that case it can be somehow related to the high level of disorder, on the basis of analogous evidences for conventional superconductors. Here, this anomaly is very difficult to justify theoretically – and is certainly beyond current models for two-gap superconductivity.
As far as the small gap is concerned, our data show that, in the low-doping region, it increases on increasing the Al content, reaching a maximum around K. This effect is quite definitely assessed by the measurements we expressly carried out in crystals with and 0.034. Such a tendency is also present in the specific-heat data from [12] and, although much smaller, in the data from [10] and [11] as well as in the results of specific-heat measurements in polycrystals from Genova [8, 34]. The tendency of the small gap to increase was recognized in [18] as an intrinsic effect of Al doping, more evident in samples produced via a long reaction at high temperature so as to reduce the strain and the inhomogeneity in the Al content. The much greater increase in at low doping contents in the single crystals grown at ETH (similar to that of samples of the “B” series in [18]), might then be related to the absence of lattice strain due to compositional gradients, also witnessed by the rather sharp transition of the crystals in this range of doping levels. If this picture is valid, the increasing inhomogeneity of the crystals on increasing might be responsible for the fact that, for K, the small gap of these single crystals returns on the same curve described by the values of in the other samples.
4 Discussion
We tried to interpret the trend of the gaps as a function of the local critical temperature within the two-band Eliashberg theory. A model for the effect of Al doping on the gaps of MgB2 was given by Kortus et al. [32] who solved the two-band Eliashberg equations scaling the Eliashberg functions by the change of the DOS alone. The same approach was used in [35] to explain the dependence of the critical temperature in Al-doped MgB2. This model has no free parameters as long as one takes the interband scattering rate to remain negligible as it is in pure MgB2 (see Appendix B for the explicit Eliashberg equations and the details of the model). However, even in this case it proved sufficient to qualitatively explain the previous experimental data for the gaps in Al-doped MgB2 [34, 6] as a function of the critical temperature, thus indicating that the changes in the - and -band DOS are by far the dominant effect of Al doping.
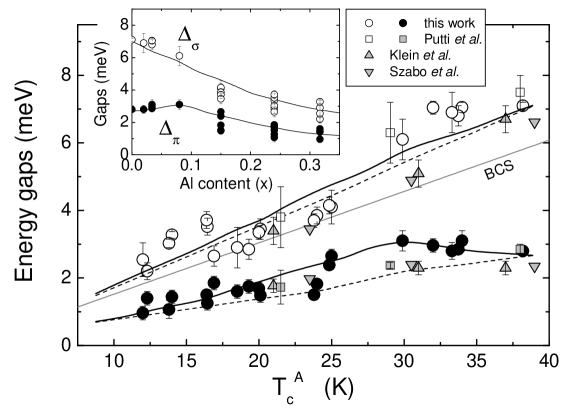
Dashed lines in figure 7 represent indeed the -dependencies of the gaps and we calculated within the two-band Eliashberg theory following the aforementioned approach [32, 35] and using the DOS Nσ(EF) and Nπ(EF) from first-principle calculations [36]. It is clearly seen that the dashed lines already reproduce rather well the data we obtained by PCAR in polycrystals [8] (squares) and those reported in Refs. [10] and [11]. As far as the PCAR data in our single crystals are concerned (circles in figure 7), it is clear that the large gap would be perfectly compatible with the DOS scaling alone (dashed lines), while the small gap is definitely not. As a matter of fact, the initial marked increase in on decreasing requires some additional ingredient in the model. According to the discussion of section 1 and to the predictions of [5], this immediately suggests an increase in the interband scattering parameter due to the Al doping (incidentally, let’s recall that the intraband scattering parameters, which certainly increase with , are however ineffective in changing the gap(s), according to Anderson’s theorem. Strictly speaking, this is only true as long as the doping content is small so that the perturbative description of the doped compound is possible). By taking as the only adjustable parameter111Actually, a very small change in the prefactor of the Coulomb pseudopotential, , was necessary as well to consistently reproduce the correct values. However, varies from 0.031 at K to a minimum of 0.027 reached when K. and using the calculated DOS (as we did for the dashed lines in figure 7), we were able to reproduce both the critical temperature and the gap values of our single crystals. The resulting curves for and are shown as solid lines in figure 7.
To obtain these curves, a non-monotonic dependence of on was necessary. initially increases (almost quadratically) on decreasing , reaching a maximum meV at K (i.e., ), then decreases linearly to finally saturate to 0.22 meV at K. At K (that means ), the value of the interband scattering parameter used for the fit ( meV) is perfectly compatible with the theoretical predictions ( meV)[5].
If the initial increase in on increasing the Al content is easily explained in terms of out-of-plane distortions of the B sublattice [5], the problem arises of explaining the decrease in at higher Al contents that is necessary to reproduce the observed gap trend in single crystals, which shows no gap merging down to values as small as 12 K. Giving a definitive answer to this problem certainly requires further theoretical and experimental investigations. Here, a simple interpretation can be anticipated. As discussed above, the comparison of our experimental data to those of [12] and [18] suggests that the initial increase in , and the corresponding increase in interband scattering, are intrinsic effects of Al doping in MgB2, as theoretically predicted. At the end of section 3, we have also proposed to interpret the decrease in for K () as being due to the onset of inhomogeneity in the Al content. As a matter of fact, just in the same region the slope of as a function of (being the width of the superconducting magnetic transition) suddenly increases. The simplified Eliashberg model we have been using (and which is described in detail in [35] as well as in Appendix B) is unsuited to take into account these effects. As a matter of fact, it is a mean-field model that treats the doped MgB2 as a perturbation of the pure compound so that: i) the Anderson’s theorem holds; ii) the mathematical expression for the matrix elements of the Coulomb pseudopotential and of the coupling constant derived for pure MgB2 holds as well. This may not be true any longer when the doping concentration is too large: in this case the model itself probably fails and a different, non-perturbative description should be used. In this sense, the decrease in for K necessary to fit the experimental values may not reflect an actual property of the system. In other words, this decrease might be necessary to mimic the effects of lattice stress and inhomogeneity (possibly at a nanometric scale) in the local Al content that, at the present moment, are not explicitly included in the model. Incidentally, this situation is somehow similar to what we observed in heavily neutron-irradiated MgB2 [4].
5 Conclusions
In conclusion, we performed a large number of point-contact Andreev-reflection measurements on segregation-free, state-of-the-art single crystals of Mg1-xAlxB2 extending previous PCAR results up to and down to local critical temperatures K. The local critical temperature of each contact was directly obtained from the temperature dependency of the conductance, while the gap amplitudes were determined by a two-band BTK fit of its low-temperature bias dependency. No merging of the energy gaps has been observed down to the lowest and the persistence of two gaps at the highest values of has been confirmed by studying the conductance curves in the presence of suitable magnetic fields. When compared to the theoretical results obtained in the framework of the two-band Eliashberg theory, the experimental gaps show that the main effect of Al doping is to fill up the bands, thus changing the DOSs at the Fermi level just as expected by first-principles calculations. Nevertheless, at an intermediate aluminum content, corresponding to values between 18 K and 35 K, the curve of our single crystals shows clear deviations from the theoretical behaviour expected for pure band filling. Within the two-band Eliashberg model already used to describe pure MgB2, these deviations can only be reproduced by introducing a proper amount (up to 2.6 meV) of interband scattering . However, must be decreased again on further increasing to account for the experimental behaviour of and the absence of gap merging – at least down to K. We propose to interpret this trend as resulting from two competing phenomena: i) the increase in interband scattering, intrinsic to Al doping but clearly observable only when the lattice stress due to compositional gradients is eliminated, and ii) the gradual onset of inhomogeneity when the Al content is increased above a certain threshold (). At high doping contents, inhomogeneity probably dominates so that any theoretical description that does not take it into account becomes less and less satisfactory. To overcome this problem, which is likely to occur in any doped MgB2-based system, a detailed experimental knowledge of the kind of disorder would be required, as well as new and specific theoretical approaches.
Appendix A. The two-band BTK fit
In this Appendix we will give some additional details about the two-band BTK fit and the fitting procedure. In the theoretical model we used, the normalized conductance through the point contact is expressed by:
| (1) |
Each conductance is expressed in the form
| (2) |
where and:
| (3) |
| (4) |
The functions are given by
| (5) |
and contain the broadening parameters and as imaginary parts of the energy [37]. Also note that these parameters are independent of the gap values . This model is a two-band generalization of the formulation by Kashiwaya et al. [38] that reduces to the simplest BTK formulation if one takes and instead of integrating over the angle as in equation 2.
In the modified BTK model [28, 29] is a measure of the intrinsic lifetime broadening. In our case, and account for both the intrinsic lifetime broadening and other effects - related to the experimental technique and thus extrinsic - that smooth the curves [19]. The most probable origin of the additional broadening is inelastic quasiparticle scattering in the vicinity of the contact, i.e. in a degraded layer covering the Ag grains of the paint. As recently shown [26] this scattering can be simply accounted for by increasing the broadening parameter in the BTK model. and depend on the potential barrier at the interface. The weight of the -band conductance, , is taken as an adjustable parameter as well.
The range of variability of the seven fitting parameters is actually limited by some physical constraints. For example, in pure MgB2 must vary between 0.66 (for pure -plane tunneling) and 0.99 (for -axis tunneling) [20]. Owing to the non-perfect directionality of PCAR, we always took for -plane current injection [19]. Moreover, and the barrier parameters and must be independent of temperature and magnetic field so that one is forced to keep them constant in fitting the whole or -dependence of a conductance curve. In principle, and should be smaller than and , respectively, and they must increase on increasing the applied magnetic field [30].
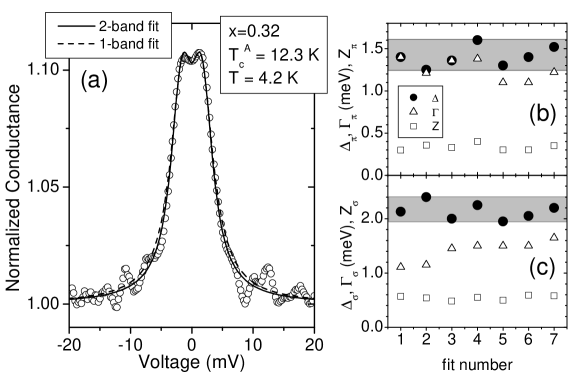
Finally, the uncertainty on and for a given curve can be defined as the maximum range of gap values that allow a good fit of the curve, when the other parameters are changed too. To define which is the best fit, we minimized the sum of squared residuals (SSR). This corresponds to minimizing the chi-square but does not require an estimation of the uncertainty on the conductance for each point, which can vary from curve to curve and is often difficult to estimate. We then allowed a variation of the SSR of the order of 100% and determined the corresponding range of parameters. In the best cases, as in pure MgB2 (top panel of figure 4), is directly related to the position of the peaks in the conductance curves, and to the shoulders on the sides. In this situation, the uncertainty on the gap values is usually rather small (of the order of 0.3 meV). In doped samples, clear conductance peaks are still present but no structure at is directly visible that would reveal the presence of a second gap. Moreover, in heavily doped crystals, the two gaps can be so close to each other that the conductance peaks can occur at some intermediate energy. In all these cases, a statistical test (the Fisher F-test) can be used to determine whether the single-band or two-band fit is preferable. In practice, one first determines the best fitting curves within the two models. If the SSR of the single-band fit is smaller, this fit is certainly preferred. However, if the two-band fit gives a smaller SSR value, the F-test allows testing whether, within a fixed confidence level (usually 5 %), the improvement in the fit is not only due to the increase in the number of parameters from 3 to 7. In the two bottom panels of figure 4, the best-fitting single-band BTK curve is represented by a dashed line. In the most ambiguous case (), the SSR in the range mV (excluding the noisy regions of the curve) is for the two-band fit and for the single-band one. The F-test shows that, for any level of confidence, the two-band fit is preferable. Another example, always in the high-doping limit (, K), is reported in figure 8. Here the best SSR in the range mV is in the single-band case and in the two-band case. The F-test again shows that the two-band fit is better for any level of confidence. The panels (b) and (c) of the same figure give an idea of the spread of the fitting parameters in different fits of the same curve; the range of variation of the gaps is indicated by the grey strips. It is clear in figure 8(b) that is comparable or equal to . This is a drawback of our experimental technique, due to the aforementioned extrinsic broadening. It must be said, however, that contrary to a widespread belief, the gap structures are clearly visible in the conductance curves (and a reliable gap measure can be extracted from their fit [19]) even if , provided that is not too small, as in our case. This can be easily shown by calculating the conductance curves within the modified BTK model.
Appendix B: Two-band Eliashberg equations
Let us start from the generalization of the Eliashberg theory [39] for systems with two bands, which has been already used with success to study the MgB2 system [20, 2, 40]. To obtain the gaps and the critical temperature within the s-wave, two-band Eliashberg model one has to solve four coupled integral equations for the gaps and the renormalization functions , where is the band index and are the Matsubara frequencies. We included in the equations the non-magnetic impurity scattering rates in the Born approximation, .
| (6) | |||||
| (7) | |||||
where is the Heaviside function, is a cut-off energy and , , .
The solution of the Eliashberg equations requires the following input: i) four (but only three independent) electron-phonon spectral functions ; ii) four (but only three independent) elements of the Coulomb pseudopotential matrix ; iii) four (but only three independent) impurity scattering rates .
The four spectral functions were calculated for pure MgB2 in ref. [40]. For simplicity, we will assume here that the shape of the functions does not change with , and we will only scale their amplitude with the electron-phonon coupling constants :
| (8) |
where
| (9) |
As far as the Coulomb pseudopotential is concerned, we used the expression calculated for pure MgB2 [41], though including the dependence of the densities of states at the Fermi level on the doping content :
| (12) | |||||
| (16) |
As for the scattering rates, let us remind here that, according to Anderson’s theorem, the intraband scattering parameters have no effect on either or the gaps so that they can be dropped. We are thus left only with the interband scattering rates and , which are however related through the equation
| (17) |
This is the reason why we can choose as the only adjustable parameter. Moreover, it can be shown that only the interband scattering can make the small gap increase while both Tc and the large gap decrease (on increasing x), in the way experimentally observed.
It is worth clarifying the relationship between the broadening parameters and in the BTK model and the scattering parameters , , in the Eliashberg theory. The intrinsic BTK linewidth for a given band, e.g. , takes into account all the scattering channels and is thus proportional to . A direct relationship between the intrinsic and cannot be established unless an independent determination of the intraband scattering rates is obtained. Furthermore, in our case the values of extracted from the fit contain an “extrinsic” term (related to inelastic scattering in the vicinity of the interface) in addition to the intrinsic linewidth. This prevents a direct connection between the parameters of the BTK model and the of the Eliashberg theory.
Appendix C: A test of consistency
With reference to figure 7, it is worth noting that we are fitting with the Eliashberg theory – including interband scattering – data points that were obtained through a BTK fit of experimental curves (and thus without taking into account the possible effect of the interband scattering on the curves themselves, which is theoretically expected not to be negligible [42]). This approximation is hardly avoidable since a fit of the conductance curves within the two-band Eliashberg theory would be a very complex (if possible) task. For the same reason, a direct proof of the reasonability of the BTK approach – that would be obtained by directly comparing the results of the two fitting procedures, BTK and Eliashberg – cannot be obtained. However, one can try to demonstrate that a theoretical curve calculated within the two-band Eliashberg theory (with given values of the gaps and a non-zero interband scattering rate) can be fitted with the BTK model, and that the gap amplitudes resulting from the fit are consistent with the original ones.
Let us refer for clarity to the point where the -band gap is maximum (see figure 7), which is also the most critical one. We first calculated the gap functions and ( being the energy) within the Eliashberg theory, with the parameters corresponding to the two curves in figure 7 (dashed and solid lines), that means in particular with =0 and =2.40 meV, respectively. Then, we calculated the corresponding Andreev-reflection conductance curves at 4.2 K with no additional smearing, and using the experimental values of and [38]. The two curves are reported as open circles in figure 9(a) and (b), respectively.
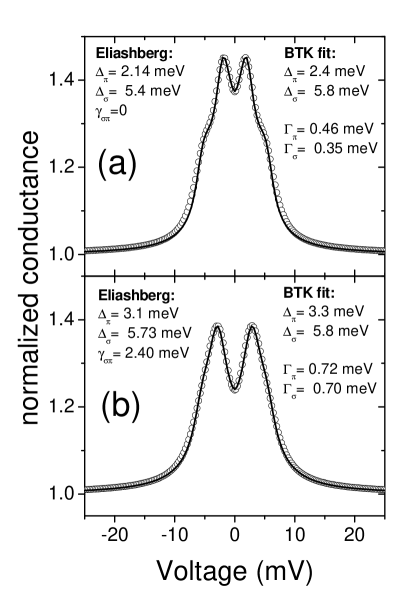
Finally, we fitted these curves with the two-band BTK model and compared the values of the gaps given by the fit with those used to generate the curves. Note that the amplitude of the theoretical curves in figure 9 ( 1.4) is greater than that of the experimental ones, which are further smeared by extrinsic broadening factors (e.g. related to the specific measurement technique we use [43, 26]). This makes the test even stricter. The best-fitting BTK curves are shown in figure 9(a) and (b) as solid lines. It is clearly seen that both the gaps are rather well re-obtained, with an error which is of the same order of magnitude as the experimental uncertainty. This shows that the trend of the small gap obtained by the BTK fit of the conductance curves is not due to an artifact introduced by the BTK fit itself. In other words, the enhancement of at intermediate values is a real effect that would be obtained as well by fitting the experimental conductance curves with the more appropriate Eliashberg theory.
References
References
- [1] Liu A Y, Mazin I I and Kortus J 2001 Phys. Rev. Lett. 87 87005
- [2] Choi H J, Roundy D, Sun H, Cohen M L and Louie S G 2002 Nature 418 758–760
- [3] Cava R J, Zandbergen H W and Inumaru K 2003 Physica C 385 8–15
- [4] Daghero D, Calzolari A, Ummarino G A, Tortello M, Gonnelli R S, Stepanov V A, Tarantini C, Manfrinetti P and Lehmann E 2006 Phys. Rev. B 74 174519
- [5] Erwin S C and Mazin I I 2003 Phys. Rev. B 68 132505
- [6] Karpinski J, Zhigadlo N, Shuck G, Kazakov S M, Batlogg B, Rogacki K, Puzniak R, Jun J, Muller E, Wagli P, Gonnelli R S, Daghero D, Ummarino G A and Stepanov V A 2005 Phys. Rev. B 71 174506
- [7] Daghero D, Gonnelli R S, Calzolari A, Ummarino G A, Dellarocca V, Stepanov V A, Zhigadlo N, Kazakov S M and Karpinski J 2005 Phys. Stat. Sol. C 5 1656
- [8] Putti M, Ferdeghini C, Monni M, Pellecchi I, Tarantini C, Manfrinetti P, Palenzona A, Daghero D, Gonnelli R S and Stepanov V A 2005 Phys. Rev. B 71 144505
- [9] Birajdar B, Wenzel T, Manfrinetti P, Palenzona A andPutti M and Eibl O 2005 Supercond. Sci Technol. 18 572
- [10] Klein T, Lyard L, Marcus J, Marcenat C, Szabó P, Hol’anová Z, Samuely P, Kang B W, Kim H J, Lee H S, Lee H K and Lee S I 2006 Phys. Rev. B 73 224528
- [11] Szabó P, Samuely P, Pribulová Z, Angst M, Bud’ko S, Canfield P C and Marcus J 2007 Phys. Rev. B 75 144507
- [12] Cooley L D, Zambano A J, Moodenbaugh A R, Klie R F, Zheng J C and Zhu Y 2005 Phys. Rev. Lett. 95 267002
- [13] Karpinski J, Angst M, Jun J, Kazakov S M, Puzniak R, Wisniewski A, Roos J, Keller H, Perucchi A, Degiorgi L, Eskildsen M R, Bordet P, Vinnikov L and Mirinov A 2003 Supercond. Sci. Technol. 16 221–230
- [14] Karpinski J, Kazakov S M, Jun J, Angst M, Puzniak R, Wisniewski A and Bordet P 2003 Physica C 385 42–48
- [15] Jones M E and Marsh R E 1954 J. Am. Chem. Soc. 76 1434 – 1436
- [16] Lee S, Masui T, Yamamoto A, Uchiyama H and Tajima S 2004 Physica C 412-414 31
- [17] Zwicknagl G E and Wilkins J W 1984 Phys. Rev. Lett. 53 1276 – 1279
- [18] Zambano A J, Moodenbaugh A R and Cooley L D 2005 Supercond. Sci. Technol. 18 1411–1420
- [19] Gonnelli R S, Daghero D, Ummarino G A, Stepanov V A, Jun J, Kazakov S M and Karpinski J 2002 Phys. Rev. Lett. 89 247004
- [20] Brinkman A, Golubov A A, Rogalla H, Dolgov O V, Kortus J, Kong Y, Jepsen O and Andersen O K 2002 Phys. Rev. B 65 180517
- [21] Holm R 1958 Electric Contacts Handbook (Springer-Verlag)
- [22] Yanson I K 1974 Sov. Phys. JETP 39 506–513
- [23] Weitz D A, Skocpol W J and Tinkham M 1978 Phys. Rev. B 18 3282 – 3292
- [24] Duif A M, Jansen A G M and Wyder P 1989 J. Phys.: Cond. Mat. 1 3157–3189
- [25] Tarantini C, Aebersold H U, Braccini V, Celentano G, Ferdeghini C, Ferrando V, Gambardella U, Gatti F, Lehmann E, Manfrinetti P, Marré D, Palenzona A, Pallecchi I, Sheikin I, Siri A S and Putti M 2006 Phys. Rev. B 73 134518
- [26] Chalsani P, Upadhyay S K, Ozatay o and Burham R A 2007 Phys. Rev. B 75 094417
- [27] Blonder G E, Tinkham M and Klapwijk T M 1982 Phys. Rev. B 25 4515
- [28] Plecenik A, Grajcar M, Beňačka v, Seidel P and Pfuch A 1994 Phys. Rev. B 49 10016
- [29] Srikanth H and Raychaudhuri A 1992 Physica C 190 229
- [30] Gonnelli R S, Daghero D, Calzolari A, Ummarino G A, Dellarocca V, Stepanov V A, Jun J, Kazakov S M and Karpinski J 2004 Phys. Rev. B 69 100504(R)
- [31] Giubileo F, Bobba F, Scarfato A, Cucolo A M, Kohen A, Roditchev D, Zhigadlo N and Karpinski J 2007 Phys. Rev. B 76 024507
- [32] Kortus J, Dolgov O V, Kremer R and Golubov A A 2005 Phys. Rev. Lett. 94 027002
- [33] Gonnelli R S, Calzolari A, Daghero D, Ummarino G A, Stepanov V A, Fino P, Giunchi G, Ceresara S and Ripamonti G 2002 J. Phys. Chem. Solids 63 2319
- [34] Putti M, Affronte M, Manfrinetti P and Palenzona A 2003 Phys. Rev. B 68 094514
- [35] Ummarino G A, Gonnelli R S, Massidda S and Bianconi A 2004 Physica C 407 121
- [36] Profeta G, Continenza A and Massidda S 2003 Phys. Rev. B 68 144508
- [37] Dynes R C, Narayanamurti V and Garno J P 1978 Phys. Rev. Lett. 41 1509
- [38] Kashiwaya S, Tanaka Y, Koyanagi M and Kajimura K 1996 Phys. Rev. B 53 2667
- [39] Eliashberg G M 1963 Sov. Phys. JETP 3 696
- [40] Golubov A A, Kortus J, Dolgov O V, Jepsen O, Kong Y, Andersen O K, Gibson B J, Ahn K and Kremer R K 2002 J. Phys.: Condens. Matter 14 14 1353
- [41] Mazin I I, Andersen O K, Jepsen O, Golubov A A, Dolgov O V and Kortus J 2004 Phys. Rev. B 69 056501
- [42] Bascones E and Guinea F 2001 Phys. Rev. B 64 214508
- [43] Tanaka Y, Golubov A A and Kashiwaya S 2003 Phys. Rev. B 68 054513