Optical study of MgTi2O4: Evidence for an orbital-Peierls state
Abstract
Dimension reduction due to the orbital ordering has recently been proposed to explain the exotic charge, magnetic and structural transitions in some three-dimensional (3D) transitional metal oxides. We present optical measurement on a spinel compound MgTi2O4 which undergoes a sharp metal-insulator transition at 240 K, and show that the spectral change across the transition can be well understood from the proposed picture of 1D Peierls transition driven by the ordering of and orbitals. We further elaborate that the orbital-driven instability picture applies also very well to the optical data of another spinel CuIr2S4 reported earlier.
pacs:
72.80.Ga, 71.30.+h, 78.20.Ci, 78.30.-jI INTRODUCTION
In low-dimensional electronic system, Fermi surface instability often occurs at low temperature and drives the system into a symmetry-breaking insulating state. However, such instability is not expected to develop in a three-dimensional (3D) system. Recently, two types of highly exceptional orderings were discovered in two spinel compounds by Radaelli and co-workers: octamer ordering in CuIr2S4 Radaelli and helical (or chiral) ordering in MgTi2O4 Schmidt . In both cases, sharp metal-insulator transitions (MIT) and spin-dimerizations associated with the structural distortions occur simultaneouslyFurubayashi ; Isobe . Those extraordinary magnetic, charge and structural transitions have generated a great deal of interest and discussionCao ; Croft ; Popovic ; Wang ; Matteo ; Zhou ; Khomskii ; Radaelli2 . Recently, Khomskii and MizokawaKhomskii suggested that the orbital degree of freedom plays a key role in such transition: the ordering of the orbitals makes the electrons travel exclusively along certain chains which effectively leads to the reduction of the dimensionality from 3D to 1D. Then, the very strange octamer and chiral structural change can be easily understood from the so-called orbitally-driven Peierls state involving the formation of a dimerized state with alternating strong and weak bonds along the chains formed by Ir or Ti ions. The losing of 3D nature driven by the orbital ordering has recently been generalized to other transition metal oxides, for example in 3D pyrochlore Tl2Ru2O7 where possible formation of 1D Haldane chains was indicatedLee . It is further believed that such kind of dimension reduction opens up a new direction in research into transitional metal oxidesBrink .
Spinels have a general formula AB2X4, where A and B are metallic ions and X is an anion, such as O or S. For many spinels, including CuIr2S4 and MgTi2O4 , A-site ions have fully filled energy levels, while B-site ions, locating at the center of X6 octahedra, have partially-filled d levels, which thus determine the low-lying excitations. Those B-site ions (or BX6 octahedra) are arranged in chains through corner-sharing tetrahedra (i.e. pyrochlore lattice). Although CuIr2S4 and MgTi2O4 offer good opportunities for investigating possible novel type of Peierls transition in a 3D system, few experiments were performed on those systems due to the difficulty of synthesizing high quality samples or single crystals. This is the case particularly for MgTi2O4 owing to the low oxidation state of Ti3+ ions. We recently prepared single phase polycrystalline samples of Mg1+xTi2-xO4 using a novel Plasma arc melting method. The samples obtained by this method are extremely dense. A very shinny and metallic bright surface is obtained after fine polishing. Here we report the optical study on MgTi2O4 compounds. In combination with earlier data collected on CuIr2S4 , we show that the orbital-Peierls transition picture provides excellent explanation for the spectral change across the MIT for both compounds. Therefore, the study provides strong support for the picture of orbital-driven 1D physics in such 3D systems.
II EXPERIMENTAL RESULTS
Fig. 1 displays the T-dependent dc resistivity and specific heat curves measured by a Quantum Design PPMS. The detailed description about sample preparation and other characterizations were presented elsewhereZhu . The increases sharply at TMIT=240 K. A small hysteresis could be seen for the curve. Accompanying the resistivity change, the specific heat curve displays a peak at the same temperature region. The hysteresis in and the peak anomaly rather than a -shape in specific heat imply that the transition is of the first-order in nature. We note that the TMIT is lower than the reported values in literature, and the peak in specific heat is somewhat broad. This could be ascribed to the difference in the amount of Ti ions being substituted by Mg ions. Additionally, the curve above TMIT also has a negative slope, suggesting non-metallic nature even in the high-T phase. This is similar to CuIr2S4 where a negative slope (though less value) is also seen even in single crystal sampleWang . We think that this behavior may arise from two effects: one is the intrinsic ”bad-metal” nature seen quite often in transitional metal oxides for which the mean free path of electrons might be close to the lattice constant. The other is the partial substitutions of Ti by Mg ions. The randomly distributed substitutions make the electrons further localized, and also broadens the transitions as seen in resistivity and specific heat curves. However, for consistency, we still use the term ”MIT” in the rest part of the paper.


The frequency-dependent reflectance was measured from 40 to 50,000 at different T on a Bruker 66v/s and a grating type spectrometer, respectively, using an in-situ gold (below 15,000 cm-1) and aluminum (above 10,000 cm-1) overcoating technique. Since the material has a 3D cubic structure at high T, we can determine its optical constants from the reflectance measurement on such high-dense polycrystalline sample. Fig. 2 shows the optical reflectance and conductivity spectra at 320 K over broad frequencies. The spectra show two apparent interband transitions. A weak interband transition, labelled as , starting from about 4,000 cm-1 (0.5 eV) to 20,000 cm-1 (2.5 eV) is due to the transition from to bands, the strong one, peak, with onset near 36,000 cm-1 (4.5 eV) is due to the transition from O2p bands to unoccupied states of bands, as we shall explain in detail below. The low- reflectance increases towards unity, evidencing the conducting carrier response. However, the reflectance values are still very low, so that the low- conductivity extracted is almost flat, without showing Drude-like peak. The two sharp peaks below 700 cm-1 are infrared phonons.
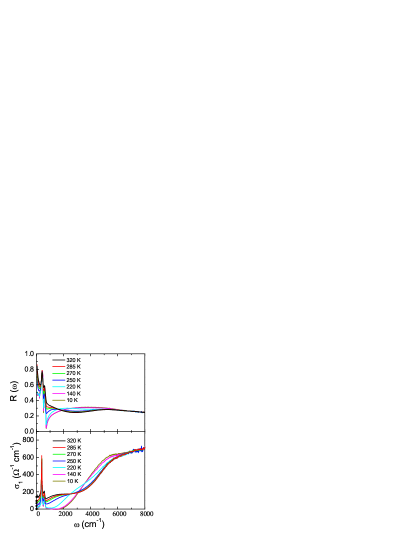
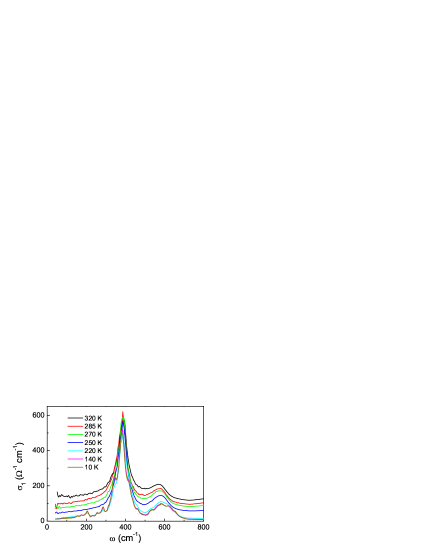
Fig. 3 shows the R() and ) spectra at different temperatures below 8,000 cm-1 (1 eV). As T decreases, the low- R() decreases, meanwhile the R() between 1,600 and 6,000 cm-1 increases. As a result, the broad minimum centered near 3,000 cm-1 at high T gradually disappears and the R() displays a single broad peak above the phonon peaks. In ) spectra, the value below the onset of interband transition 4,000 cm-1 is very low, without showing Drude-like peak. In fact, the conductivity tends to decrease with decreasing . The higher values between 200 and 600 cm-1 are due to phonons, which should be subtracted when trying to isolate the electronic contribution. Those results suggest that the electrons are rather localized even above TMIT. In addition, we find that the low- conductivity decreases with decreasing T, furthering evidencing the non-metallic T-dependence. Nevertheless, there is no gap in ) at high T (above MIT), the extrapolated values at zero frequency are in good agreement with the dc resistivity data. Another remarkable feature is that the optical spectra show very dramatic change as the temperature decreases across the MIT. It is noted that the R() at our lowest measurement frequency decreases sharply from about 0.7 at 250 K to about 0.5 at 220 K, and the sharp increasing feature towards unity at zero frequency for T250 K vanishes completely. Such low- R() is a characteristic response behavior of an insulator. Correspondingly, we find a rather rapid removal of low- spectral weight in ), leading to the formation of an energy gap. It is noteworthy that the removal of spectral weight shifts only to the region between 3,000 and 6,000 cm-1 , as a result, the onset of interband transition occurs at a reduced energy. Above 6,000 cm-1 , the optical spectra are almost T-independent. From ) at the lowest measurement T=10 K, it is easy to identify the optical gap being about 2,000 cm-1 (0.25 eV). Additionally, there appears an abrupt change in phonon structure for temperature below and above TMIT. In Fig. 4, we show the ) spectra in an expanded plot of the low frequency region. As seen clearly, a number of new phonon modes appears and the splitting of phonon mode occurs just below the transition. Those results are consistent with the first-order structural change with a lowering of lattice symmetry. Phonon modes in this material were analyzed in detail previously,Popovic in this work we shall limit our discussion to the electronic behavior.
III DISCUSSIONS
Let us now analyze the spectral change across the MIT. In the spinel structure, the Ti3+ ion locates at the center of TiO6 octahedron. As we mentioned above, those octahedra are arranged in 1D chains (along six different directions) through corner-sharing tetrahedra. At high T, the Ti 3d levels are split into triply degenerate level (orbitals , , and ) and a doubly degenerate level (orbitals and ) under local cubic environment. Since Ti3+ has a 3d1 electron configuration, this single electron occupies the level with equal distribution on the , , orbitals, leading to the partially filled band. The orbitals are completely empty. The O 2p levels are fully occupied, and locate far away from the Fermi level, although some hybridizations with Ti 3d orbitals exist. This simple picture for the band structure is supported by the first-principle calculationSchmidt . The optical spectra can be easily understood from this simple picture, as illustrated in Fig 4. The lowest interband transition is from the occupied states of bands to empty states. This corresponds to the peak. Because the direct d-d transition is forbidden, the observed weak transition is largely due to the hybridization with O 2p band which thus makes the transition allowable. The transition from occupied O 2p band to unfilled part of band corresponds to the peak. However, the observed interband transition energies are lower than the values obtained from the band structure calculationSchmidt . As the bands are partially filled, the intraband transition should result in metallic response at low frequency. Experimentally, the missing of Drude-like peak suggests that the carriers are rather localized. As discussed above, we think that this could be due to a combination of bad-metal nature of the material and the disorder effect caused by the substitution of Mg for Ti sites. We believe that a successful growth of single crystal with better chemical stoichiometry would reduce such non-metallic response. Nevertheless, the entire physical picture would not be affected.
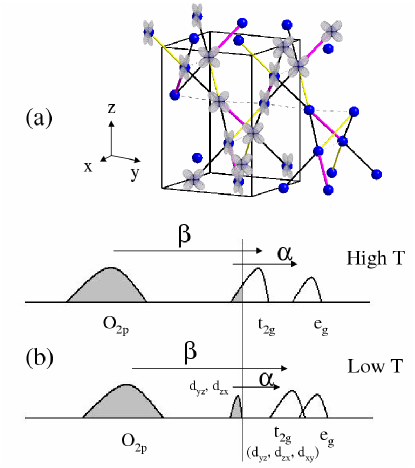
Since an orbital has a specific shape, an important characteristic for spinels is that the spacial orientations of , and orbitals are along the 1D chain directions forms by the Ti site ions, respectively. As a result, the bands formed by those orbital levels have 1D characteristic and are susceptible to Peierls instability. This is believed to be the origin of the first order structural change and accompanied MIT. At low T phase, the lattice symmetry is lowered to tetragonalSchmidt . According to the band structure calculations,Khomskii ; Schmidt this tetragonal distortion increases the bandwidths of the and bands, and decreases that of the . With one electron per Ti ion, the electron occupies the lowest doubly degenerate and level. The level is pushed to higher energy and is unoccupied. In this case, the orbital in (or ) chain is quarterly occupied (i.e. the orbital is occupied in every two sites), which makes the (or ) band quarterly filled. This leads to the Pererls instability and to the formation of a tetramerization superstructure in the zx and yz directions: an ordered arrangement of short, intermediate and long bonds along and chains (four directions [0,1,1], [0,1,-1], [1,0,1], and [1,0,-1]), respectively, as illustrated in the upper panel of Fig. 4.Khomskii Associated with the instability, the and bands are split, respectively; the lower parts of the split and bands are fully occupied, the upper part, together with the band, are separated by a gap from the lower part of and bands. Obviously, the observed gap in optical conductivity below is due to the interband transition from occupied and bands to the unoccupied part of the manifold (upper part of , mixing with band). The gap value of 22000 cm-1 leads to 212. Considering that many systems with charge-density wave transitions have , the gap value in MgTi2O4 is not surprisingly large. Because the observed transition has a single broad peak with onset at lower energy in comparison with the situation at high T, we believe that the unoccupied part has some overlap with bands.
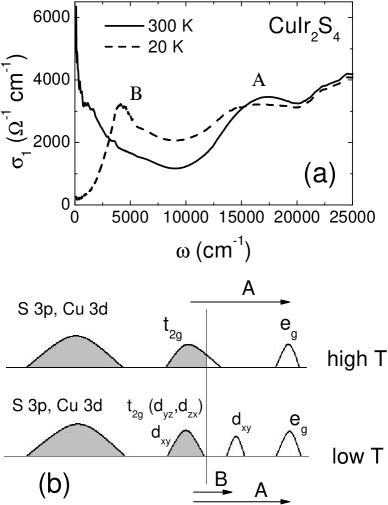
It deserves to remark that the above orbital-ordering picture applies also extremely well to the optical data of CuIr2S4 , which has 5.5 electrons in bands. Optical spectra of CuIr2S4 were reported by usWang prior to the proposal of orbital-driven instability picture, so the data were not analyzed in terms of the orbital-Peierls transition scenario previously. To help readers easily follow our discussion, we reproduce two conductivity curves at 300 K and 20 K, being above and below TMIT, as shown in Fig. 6(a). Above TMIT, the ) displays a Drude-like component at low frequency and an interband transition peak (labelled as A) near 2 eV. Since at high T, every Ir ion is equivalent, the 5.5 electrons have equal probability in distribution among three degenerate , , orbitals of manifold, leading to the partially filled bands and completely empty bands. It is easy to understand that the Drude component originates from the intraband transition of three degenerate , , bands (or bands), while the 2 eV peak originates from the interband transition from occupied to empty bands. Such transitions are schematically shown in the picture of Fig. 6 (b). However, below TMIT, a gap opens in ) together with a new peak (labelled as B) developing near 0.5 eV. Structurally, CuIr2S4 undergoes a octamer ordering with inequivalent Ir3+ and Ir4+ ions. Ir3+ has configuration, Ir4+ has configuration. The octahedral distortion splits the levels and lifts up the . Consequently, the doubly degenerate and orbitals are fully filled, only the orbital of Ir+4 ion is left to be partially occupied. Then, one can identify 3/4-filled chains along orbital directions, which also leads to a Pererls instability and formation of a tetramerization superstructure in orbital directions with an ordered arrangement of short, intermediate and long bonds as that in MgTi2O4 (Fig. 2 of ref. [11]). This Peierls instability splits the band into two subbands, which therefore creates new states above the Fermi level (upper sub-band of the split band). The interband transition from occupied to those states results in the new excitation peak B as observed in optical conductivity.
The above optical study leads to tentative identification of the novel orbital Peierls state in such 3D spinel compounds. It highlights the 1D physics driven by the ordering of the orbital degree of freedom in those compounds, despite of their 3D structure. Recently, the orbital ordering picture was also employed to other systems with similar phenomena, like NaTiSi2O8Isobe2 ; Wezel ; Streltsov , La4Ru2O10Khalifah ; Eyert ; Wu , VO2Haverkort , and many other transition metal oxide compoundsKhomskii2 ; Efremov . It would be very interesting to study or reexamine their optical and other physical properties of in terms of orbital-ordering picture.
IV CONCLUSIONS
The optical study on MgTi2O4 indicates that the orbital degree plays a crucial role in explaining the spectral evolution with T. Although the spinel systems have a 3D structure, they behave more 1D-like. At high T, MgTi2O4 has a cubic structure, the low-lying excitations are dominated by the three degenerate 1D bands formed by the chains of Ti-site ions through corner-sharing tetrahedra. While at low T, the Ti 3d1 electron tends to occupy the doubly degenerate and orbitals, leading to two quarter-filled 1D and bands. The optical transitions could be well explained by the Peierls splitting of the two 1D bands. We further elaborate that the orbital-ordering picture applies also extremely well to the optical data of CuIr2S4 . The application of the 1D physics to 3D compounds with specific orbital occupations has important implication for understanding similar phenomena in other transitional metal oxides.
Acknowledgements: This work is supported by National Science Foundation of China, the Knowledge Innovation Project of Chinese Academy of Sciences, and the Ministry of Science and Technology of China (973 project No. 2006CB601002).
References
- (1) P. G. Radaelli, Y. Horibe, M. J. Gutmann, H. Ishibashi, C. H. Chen, R. M. Ibberson, Y. Koyama, Y.-S. Hor, V. Kiryukhin, and S.-W. Cheong, Nature (London) 416, 155 (2001).
- (2) M. Schmidt, W. Ratcliff II, P. G. Radaelli, K. Refson, N. M. Harrison, and S. W. Cheong, Phys. Rev. Lett. 92, 056402 (2004).
- (3) T. Furubayashi, T. Matsumoto, T. Hagino, and S. Nagata, J. Phys. Soc. Jpn. 63, 3333 (1994).
- (4) M. Isobe and Y. Ueda, J. Phys. Soc. Jpn. 71, 1848 (2002).
- (5) G. Cao, T. Furubayashi, H. Suzuki, H. Kitazawa, T. Matsumoto, Y. Uwatoko, Phys. Rev. B 64, 214514 (2001).
- (6) M. Croft, W. Caliebe, H. Woo, T. A. Tyson, D. sills, Y. S. Hor, S-W. Cheong, V. Kiryukhin, and S. J. Oh, Phys. Rev. B 67, 201102(R) (2003).
- (7) Z. V. Popovic, G. De Marzi, M. J. Konstantinovic, A. Cantarero, Z. Dohcevic-Mitrovic, M. Isobe, and Y. Ueda, Phys. Rev. B 68, 224302 (2003).
- (8) N. L. Wang, G. H. Cao, P. Zheng, G. Li, Z. Fang, T. Xiang, H. Kitazawa, and T. Matsumoto, Phys. Rev. B 69, 153104 (2004).
- (9) S. Di Matteo, G. Jackeli, C. Lacroix, and N. B. Perkins, Phys. Rev. Lett. 93, 077208 (2004).
- (10) H. D. Zhou and J. B. Goodenough, Phys. Rev. B 72, 045118 (2005).
- (11) D. I. Khomskii and T. Mizokawa, Phys. Rev. Lett. 94, 156402 (2005).
- (12) P. G. Radaelli, New J. Phys. 7, 53 (2005).
- (13) S. Lee, J.-G. Park, D. T. Adroja, D. Khomskii, S. Streltsov, K. A. Mcewen, H. Sakai, K. Yoshimura, V. I. Anisimov, D. Mori, R. Kanno and R. Ibberson, Nature Mater. 5, 471 (2006).
- (14) J. van den Brink, Nature Mater. 5, 427 (2006).
- (15) B. P. Zhu, Z. Tang, L. H. Zhao, L. L. Wang, C. Z. Li, D. Yin, Z. x. Yu, W. F. Tang, R. Xiong, J. Shi, and X. F. Ruan, Materials Letters (in press).
- (16) M. Isobe, E. Ninomiya, A. N. Vasilev, and Y. Ueda, J. Phys. Soc. Jpn. 71, 1423 (2002).
- (17) J. van Wezel and J. van den Brink, cond-mat/0512591.
- (18) S. V. Streltsov, O. A. Popova, and D. I. Khomskii, Phys. Rev. Lett. 96, 249701 (2006).
- (19) P. Khalifah, R. Osborn, Q. Huang, H. W. Zandbergen, R. Jin, Y. Liu, D. Mandrus, and R. J. Cava, Science 297, 2237 (2002).
- (20) V. Eyert, S. G. Ebbinghaus, and T. Kopp, Phys. Rev. Lett. 96, 256401 (2006).
- (21) H. Wu, Z. Hu, T. Burnus, J. D. Denlinger, P. G. Khalifah, D. G. Mandrus, L.-Y. Jang, H. H. Hsieh, A. Tanaka, K. S. Liang, J. W. Allen, R. J. Cava, D. I. Khomskii, and L. H. Tjeng, Phys. Rev. Lett. 96, 256402 (2006).
- (22) M. W. Haverkort, Z. Hu, A. Tanaka, W. Reichelt, S. V. Streltsov, M. A. Korotin, V. I. Anisimov, H. H. Hsieh, H. J. Lin, C. T. Chen, D. I. Khomskii, and L. H. Tjeng, Phys. Rev. Lett. 95, 196404 (2005).
- (23) D. I. Khomskii, Phys. Scr. 72, CC8 (2005).
- (24) M. Efremov, J. van den Brink, and D. I. Khomskii, Nature Materials. 3, 853 (2004).