Inelastic X-Ray Scattering Study of Exciton Properties in an Organic Molecular Crystal
Abstract
Excitons in a complex organic molecular crystal were studied by inelastic x-ray scattering (IXS) for the first time. The dynamic dielectric response function is measured over a large momentum transfer region, from which an exciton dispersion of 130meV is observed. Semi-empirical quantum chemical calculations reproduce well the momentum dependence of the measured dynamic dielectric responses, and thus unambiguously indicate that the lowest Frenkel exciton is confined within a fraction of the complex molecule. Our results demonstrate that IXS is a powerful tool for studying excitons in complex organic molecular systems. Besides the energy position, the IXS spectra provide a stringent test on the validity of the theoretically calculated exciton wavefunctions.
pacs:
71.35.-y, 78.70.Ck, 31.15.CtIn the past several decades, optical applications of organic materials have been extensively explored. optical ; pvc ; tft ; spiro ; sensor ; lumi ; polymer Organic light emitting devices, photovoltaic cells, photochromic materials, biosensors, and nonlinear optical devices among many others have generated a lot of interests. Great effort has been invested on designing new functional materials with special optical properties.
As the optical processes are largely dominated by excitonic excitations in these materials, the detailed information of excitons is crucial. Particularly, it would greatly benefit the material design if one knows where the exciton is located in a molecule, what its spatial extent is, and how the exciton energy and dispersion are associated with the local structure.
These basic yet crucial questions on exciton cannot be addressed by conventional techniques such as Raman scattering and absorption, as they can only give information near zero momentum transfer. So far, high energy electron-energy-loss spectroscopy (EELS) has been applied successfully to thin film samples of conjugated oligomer or polymer such as -, , carotenoid, and TPD. fink99 ; fink00 ; fink04 ; quasiband . EELS is limited to the low momentum transfer due to strong multiple scattering at high , which would severely smear out the spectrum, and the diminishing matrix element (). As a result, EELS studies were mostly focused on planar conjugated molecules where the excitons are more extended in space, and information at low is sufficient for understanding the exciton behaviors. On the other hand, the majority of organic optical materials are composed of small molecules with complex local structures. Even for polymers, the optically functional portions are mostly small sectors attached to the backbones for better mechanical performance. For small molecules or small molecular clusters, the size of the excitons is presumably very small, and high- information is crucial for understanding their behaviors. The properties of excitons in these systems remain largely unexplored experimentally. Theoretically, although many quantum chemical methods have been employed to study these systems, their feasibility lacks strong experimental support.
Inelastic X-ray scattering (IXS) has proven to be a powerful tool for investigating the electronic excitations in inorganic systems. schulkereview For example, IXS data have helped our understanding of the metal-insulator transition IssacsMI , plasmon excitations shulkeplas , and band gap bandgap . IXS is a clean and direct probe of the dynamic structure factor , which is proportional to , being the dynamic dielectric function. In comparison with EELS, IXS is almost free from multiple scattering effects, and it can generate reliable information at high . Therefore, IXS is particularly advantageous for studying excitons that are more constrained in space.
In this paper, we report the first IXS measurement of the Py-SO organic molecular crystal. The dynamic dielectric responses of such complex small molecules were measured over a large momentum transfer region. The dispersion of the lowest exciton was observed to be about 130 meV. Quantum chemical calculations based on ZINDO (Zerner’s intermediate neglect of differential overlap)/SCI (single configuration interaction)Ridley73 was performed on both molecular aggregate and a single molecule. We found that the ZINDO/SCI method captured very well the internal structure of the excitons. As the momentum dependence of the dielectric function gives strong constraints on the exciton wavefunctions, the good agreement between the calculated IXS spectra and the experiments indicates unambiguously that the lowest Frenkel exciton distributes in a fraction of a single molecule. Our results provide comprehensive information for understanding the properties of excitons in such complex molecular systems.

Spirooxazines (SO) are a type of well-known photochromic compounds. Open-ring photomerocyanine form of spirooxazines (Py-SO, C21N4O2H22) was synthesized recentlypyso , which exhibited alkali induced chromism and the thermochromism in alkali medium. High quality single crystal Py-SO samples, typically in the size of , were prepared by recrystallization. Fig. 1 shows one unit cell, which contains two molecules. The bottom right Py-SO molecule, from left to right, consists of one phenyl ring, one aromatic ring, and a C-N bond bridge to the quinoid on the right. At room temperature, the triclinic lattice parameters are Å, Å, Å, , , .
IXS measurements were carried out in transmission mode at the Taiwan Beamline BL12XU at SPring-8.CaiExp A Si(444) spherical analyzer with 2m radius of curvature was used. A Si(400) high-resolution monochromator was used to scan incident photon energy around 7908.75eV. The total energy resolution was estimated to be about 170meV based on the FWHM of the quasi-elastic lines of the sample. Momentum resolution was about 0.14Å-1. Data were taken at room temperature. Great care was taken to avoid beam damage to sample during the experiments by changing the probing spot every scan, since the beam spot was only about . The time for one scan was less than 4 hours, and the damage effects were negligible. Data count rate was about 10Hz. Absorption is only about , therefore it is neglected in the following analysis.
data of the Py-SO molecular crystal measured by IXS are shown in Fig. 2a with momentum transfer q along the axis. The spectral features are determined by the internal structure of the optically excited singlet excitons and interband transitions. There are three distinct features at about 2.2eV, 4.6eV and 6.6eV in the measured energy window, labeled as I, II, and III respectively. After removing the quasi-elastic Rayleigh background, the resulting spectra are shown in Fig. 2b-c. A weak feature II’ and rising spectral weight beyond 8 eV can also be observed in Fig. 2c.
Exciton, or excited state in general has been a major challenge for computational physics or chemistry because of the difficulty in treating electron correlation for excited states. Hutchison and coworkers have made a systematic investigation for the excited states of 60 organic conjugated molecules with six commonly applied excited-state computational methods. When compared with experiments, ZINDO/SCI combined with Austin-Model-1-optimized geometry was found to be the best choice in predicting the low-lying excited states, even outperforming the most commonly applied first-principles time-dependent density functional theory.Hutchison02 Therefore it is adopted in our calculations.
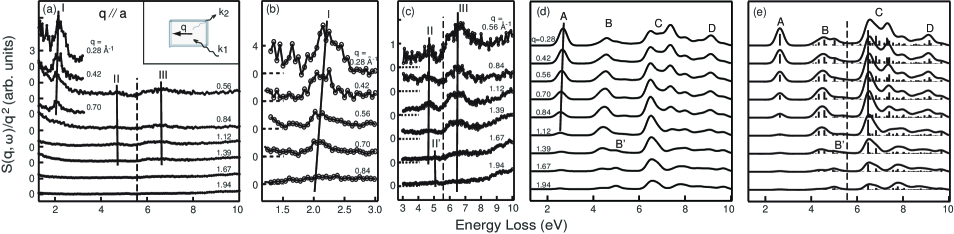
The IXS spectra calculated along the axis are shown in Fig. 2d for a molecular aggregate of six-unit-cell stack with shortest intermolecular separations, aggregate and a width of 0.17eV was included in order to compare with the experiment. One can also clearly identify several main spectral features A, B and B′, C and D. There are almost one to one correspondence between the experimental features I-III and theoretical features A-C, respectively. The energy centroid positions of features B and C match those of features II and III almost perfectly. The weak feature B′ at about 5eV becomes pronounced from 1.12Å-1 and above. The corresponding feature II′ becomes visible at high momentum transfers when feature II is weak. Both feature C and D involve many excitations. Correspondingly, the spectra in the experiment exhibit very broad feature III followed with rising spectral weight. These qualitative and, to a great extent, quantitative agreements between the theoretical spectra and the experimental results indicate that ZINDO/SCI calculations characterize the Py-SO system quite well.
The experimental feature I disperses from 2.2eV at Å-1 to 2.07eV at Å-1. This is well reproduced in the theoretical spectra, where the peak position of A disperses by 0.12eV in the corresponding momentum range, except that the theoretical position is about 0.48eV higher. The small exciton dispersion reflects the weak intermolecular coupling. quasiband In the aggregate calculation, the strongest intermolecular coupling between various orbitals in neighboring molecules is estimated to be 55meV. Therefore, the excitons are still Frenkel excitons that are confined mostly in a single molecule in this case. As a result, single molecule excitations could be computed to study the local distribution of the electrons and holes. In fact, from single molecule calculations has been shown to agree very well with the EELS measurements for conjugated oligomers and polymers.Shuai98 The IXS spectra calculated for molecular excitations of single Py-SO molecule along the axis are shown in Fig. 2e , where energy levels of the excited states are indicated by straight lines. As expected, the spectra are very similar to the aggregate calculations. The energy gap between LUMO and HOMO orbitals, is calculated to be 5.62 eV in ZINDO/SCI, denoted by the dashed line in Fig. 2. Moreover, our calculation shows that the lowest energy feature A corresponds to a discrete exciton, unlike in long chain systems, mukamelprl ; mukameljcpa where the peaks in the spectra might be consisted of many excitons. On the other hand, feature B contains mostly two major excitons and feature C and D are made up of tens of excitations above the gap. In experiment, as individual excitations could not be distinguished in features II and III, their dispersion could not be resolved even if there is any.
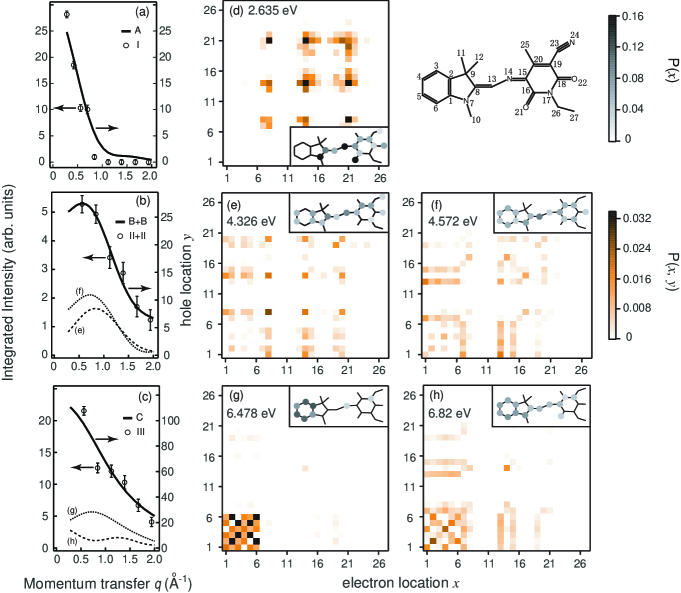
As the dynamic structure factor is directly determined by the ground state and excited state wavefunctions, it puts stronger constraints on theoretical exciton distributions than just exciton energy position information derived from conventional optical measurements. The momentum dependence of the integrated weight is compared with the single molecule calculation in Fig. 3a-c for the three main features respectively. After rescaling, the theory agrees with the experiments very well. However, as shown in Fig.2, the theoretical high energy features are more pronounced than the experiment, producing higher integrated weights in Fig. 3b-c compared to feature A. We attribute this overestimation to the more delocalized nature of the high energy excitons, which are less bound than the lowest exciton. Therefore, our single molecule calculation would overestimate its on-site occupation, which in turn causes higher matrix element of IXS. Indeed, the current aggregate calculation does give lower integrated weight, but more detailed calculation on larger aggregate is needed to fully address this issue. As the large intermolecular distance corresponds to a momentum smaller than the sampled range, the calculated local distribution of the high energy excitons in a single molecule could still be compared with the experimental data. For further confirmation, IXS spectra were sampled at two momentum transfers perpendicular to the direction in the plane, which also shows good agreement with the theory.(Fig. 4) The fact that the theory based on a single molecule matches the experiment so well indicates that the exciton distribution within the molecule is well captured, as a result of the weak coupling between the molecules. Fig. 3d-h are exciton wavefunction presented in a way that the false color scale indicates the possibility for finding an electron at atom site and a hole at atom site . The gray scale of the solid circles in the inset shows the possibility of finding the electron or hole at site on Py-SO molecule. These plots give clear information on how the electron and hole of a certain exciton are distributed in the molecule. For feature A, exciton is mostly situated in the middle region. For feature B, on the other hand, both of the two main excitons are extended over the entire molecule, which are much larger than the lowest energy exciton.(Fig.3e-f) For comparison, the two main inter-gap excitations of feature III are shown in Fig.3g-h, one being confined in the phenyl ring, the other being extended.

The measured intensity distribution of corresponds to the distribution of the exciton center-of-mass in the system. For simple linear molecular systems such as oligomer and polymer, along the chain direction relates directly with the exciton distribution over the molecule. The situation is more complicated for a molecular system with complex internal structures such as Py-SO. The structure of measured along a certain direction reflects distribution of the exciton center-of-mass in this direction summed across the entire molecule. Because the momentum transfer does not correspond to the relative electron-hole motion, quantum chemical calculations is needed to retrieve the full quantitative details of the exciton wavefunctions.mukamelprl Nevertheless, there are still some qualitative correspondence. For example, the significant occupation of exciton A on atomic sites #15,16,19,20,21,24 (Fig.3d) generally makes its center-of-mass more delocalized than the others along -direction (Fig.1), and thus the momentum distribution of is narrower in Fig.3a.
Inelastic x-ray scattering is a weak probe. From the experimental point of view, this is the first time that IXS is demonstrated to be feasible for organic molecular crystal in a third generation synchrotron. The experimental results are very clean and therefore can be directly compared with theory. The dispersion of the exciton feature gives a good measure of the strength of the intermolecular coupling. Combined with suitable quantum chemical calculations, reliable and comprehensive properties of excitons can be obtained, which are crucial for understanding their optical properties, and for designing materials of desired optical properties based on exciton transfer or dissociation properties. For example, if excitons in this useful energy range (2.2eV here) are localized within a particular complex structure, molecular clusters with a similar structure might be attached to polymers without affecting their local exciton (optical) behavior.
Acknowledgements: DLF would like to thank Profs. G. A Sawatzky, X. Sun, C. Q. Wu, and H. Chen for very stimulating discussions. This work was supported by the NSFC, and the 973 Project of MOST of China(Grant No: 2002CB613406), and by the Shanghai Science and Technology Committee. Experiments at SPring-8 were partially supported by the NSC of Taiwan (Grant No.: NSC94-2112-M-213-012). The computation has been carried out in the CNIC Supercomputing Center of the CAS.
References
- (1) M. Pope and C. E. Swenberg, Electronic Processes in Organic Crystals and Polymers (Oxford University Press, New York, 1999).
- (2) J. J. M. Halls et al., Nature (London) 376, 498 (1995); C. J. Brabec, N. S. Sariciftci and J. C. Hummelen, Adv. Funct. Mater. 11, 15 (2001).
- (3) G. Horowitz, Adv. Mater. 10, 365 (1998).
- (4) G. Benkovic, V. Krongauz and V. Weiss, Chem. Rev. 100, 1741 (2000).
- (5) R. H. Friend et al., Nature (London) 397, 121 (1999).
- (6) T. Nakano and Y. Okamoto, Chem. Rev. 101, 4013 (2001)
- (7) Q. Zhou, T. M. Swager, J. Am. Chem. Soc. 117, 12593 (1995). D. T. McQuade, A. E. Pullen, T. M. Swager, Chem. Rev. 100, 2537 (2000).
- (8) M. Knupfer et al., Phys. Rev. Lett. 83, 1443 (1999).
- (9) M. Knupfer, J. Fink, E. Zojer, G. Leising and J. L. Bredas, Phys. Rev. B 61, 1662 (2000).
- (10) M. Knupfer, J. Fink, Synth. Met. 141, 21 (2004).
- (11) E. Zojer et al., J. Phys.: Condens. Matter 12 1753 (2000).
- (12) W. Schulke, J. Phys.: Condens. Matter 13, 7557 (2001).
- (13) E. D. Isaacs, P. M. Platzman, P. Metcalf and J. M. Honig, Phys. Rev. Lett. 76, 4211 (1996).
- (14) W. Schulke, H. Schulte-Schrepping, and J. R. Schmitz, Phys. Rev. B 47, 12426 (1993).
- (15) W. A. Caliebe, J. A. Soininen, Eric L. Shirley, C.-C. Kao and K. Hamalainen, Phys. Rev. Lett. 84, 3907 (2000).
- (16) J. Ridley, M. Zerner, Theor. Chim. Acta 32, 111 (1973).
- (17) H. F. Song, K. C. Chen, and H. Tian, Dyes Pigm. 67, 1 (2005).
- (18) Y. Q. Cai et al., in Synchrotron Radiation Instrumentation: Eighth International Conference on Synchrotron Radiation Instrumentation, AIP Conf. Proc. No. 705 (AIP, New York, 2004), p. 340.
- (19) G. R. Hutchison, M. A. Ratner, and T. J. Marks, J. Phys. Chem. A 106, 10596 (2002).
- (20) L. P. Chen et al. (to be published).
- (21) E. Zojer, Z. Shuai, G. Leising, and J. L. Brédas, J. Chem. Phys. 111, 1668 (1999).
- (22) V. Chernyak, S. N. Volkov, and S. Mukamel, Phys. Rev. Lett. 86, 995 (2000).
- (23) V. Chernyak, S. N. Volkov, and S. Mukamel, J. Phys. Chem. A 105, 1988 (2001).