Anisotropic thermal expansion and uniaxial pressure dependence of superconducting and magnetic transitions in ErNi2B2C.
Abstract
We present anisotropic thermal expansion measurements on single crystalline ErNi2B2C. All three, superconducting, antiferromagnetic and weak ferromagnetic phase transitions are unambiguously distinguished in the data. Anisotropic uniaxial pressure dependencies of the transitions are estimated based on the Ehrenfest relation, leading to a conclusion, in particular, that weak ferromagnetic state will be suppressed by small, order of several kbar, hydrostatic pressure.
keywords:
A. magnetically ordered materials , A. superconductors , D. thermal expansionPACS:
65.40.De , 74.70.Dd , 75.30.Kz , 75.40.Cx , 75.80.+q, ,
Quaternary borocarbides, in particular the members of the Ni2B2C ( = Gd-Lu, Y) series of compounds, exhibit a plethora of complex phenomena: co-existence of local moment magnetism and superconductivity, non-locality and flux line lattice transitions, heavy fermion physics and intricate metamagnetism [1, 2, 3, 4]. ErNi2B2C superconducts below K [5, 6], below K superconductivity coexists with an incommensurate antiferromagnetic state with the ordering wave vector q a∗ [8, 9, 7], and then, on further cooling, a weak ferromagnetic component develops below K [10, 11, 12].
Despite a large number of publications on physical properties of ErNi2B2C, few of them address temperature dependent structural changes in the material. The evolution of the lattice parameters between 360 K and 90 K, as measured by single crystal X-ray diffraction, was reported in Ref. [13]. A magnetoelastic tetragonal-to-orthorhombic structural distortion was observed [14] below by synchrotron X-ray scattering. A -type anomaly in thermal expansion at was reported in STM measurements [15]. And finally, a low temperature phase diagram was probed [16] using thermal expansion (in an applied field) and magnetostriction measurements.
In this publication we report high resolution, anisotropic (-axis and -axis) thermal expansion (TE) and longitudinal, low temperature, magnetostriction (MS) measurements for on single crystalline ErNi2B2C. These measurements were performed with the intent to study the anomalies in TE associated with all three salient transition temperatures (to the best of our knowledge, for two of them, and , no TE anomalies were reported so far) and to evaluate the uniaxial pressure derivatives of the three transition temperatures using the the thermodynamic Ehrenfest relation.
Plate-like single crystals of ErNi2B2C with the -axis perpendicular to the plates were grown by a Ni2B high temperature flux method (see Refs. [1, 7, 17, 18] for more details). For the TE/MS measurements the ErNi2B2C crystal was shaped into a nearly rectangular bar, with two pairs of parallel surfaces, so that the measurements were performed along [100] ( mm) and [001] ( mm) directions. After shaping, the sample was annealed in dynamic vacuum ( Torr) at 950∘ C for hours [19]. Thermal expansion and magnetostriction were measured using a capacitive dilatometer constructed of OFHC copper; a detailed description of the dilatometer will appear elsewhere [20]. The dilatometer was mounted in a Quantum Design PPMS-14 instrument and was operated over a temperature range of 1.8 to 305 K and in magnetic fields up to 140 kOe. The same set-up was used in our recent work on YNi2B2C [21]. Heat capacity was measured using a heat capacity option with 3He insert of a PPMS instrument. DC magnetization was measured using a Quantum Design MPMS-7 SQUID magnetometer.
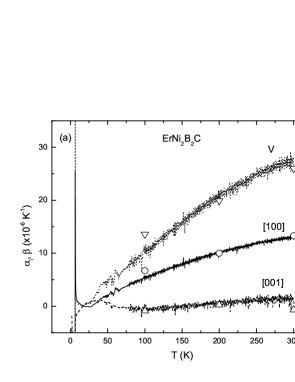
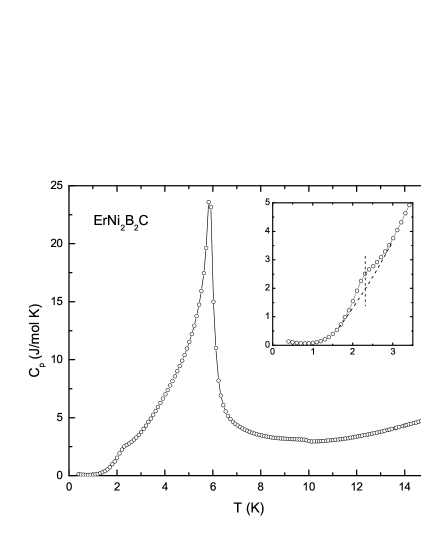
The temperature-dependent linear (, ) and volume () thermal expansion coefficients are shown in Fig. 1. Data for K are in a good agreement with the previously reported results [13] (shown as open symbols in Fig. 1(a)). Clear anomalies are detected at and (Fig. 1(b)). The size of the (inverse) -like anomaly in at is similar to the value reported in Ref. [15]. On cooling down from just above the initially increases and then goes into sharp, deep minimum. Such behavior (as opposed to some sort of -like anomaly) may be associated with possible formation of the antiferromagnetic domains (twins) in the crystal in zero or small fields [22, 23] due to orthorhombic structural distortion below [14]. The complexity of in-plane thermal expansion of ErNi2B2C near is illustrated in Fig. 2: whereas for an application of 2 kOe field does not change the temperature-dependent dilation (and the TE coefficient), field applied along -axis changes the longitudinal dilation dramatically. These results are consistent with higher fields study in Ref. [16]. Jumps in and associated with the superconducting transition are small but unequivocal in the data (Fig. 1(c)). The values of and at are of the same order of magnitude as in YNi2B2C [21], but of the opposite signs. The temperatures associated with the anomalies in the TE coefficients are consistent with the phase transitions observed in heat capacity (Fig. 3).
Using results from the heat capacity (Fig. 3) and thermal expansion coefficients (Fig. 1) measurements, the uniaxial pressure derivatives of the phase transition temperatures, , and , can be calculated using the thermodynamic Ehrenfest relation for the second order phase transitions:
where is a molar volume of the material (for ErNi2B2C, cm3) and and are the jumps in the -th thermal expansion coefficient and specific heat at . Estimates of the uniaxial pressure derivatives for ErNi2B2C based on the aforementioned measurements are summarized in Table 1. Due to complex behavior of at , we were not able to estimate and . The error bars for the uniaxial pressure derivatives listed in the Table 1 are rather large, possibly up to % due to signal to noise ratio in the temperature-dependent TE coefficient data and possible ambiguity in determination at and .
In the table . The defined in such way lacks the contribution from the off-diagonal terms that play a role in the experimentally measured under hydrostatic pressure. Since the off-diagonal terms are usually significantly smaller then the diagonal ones, we can still compare the last column of the Table 1 with the experimentally measured hydrostatic pressure derivatives. The hydrostatic pressure measurements on ErNi2B2C are rather sparse: there were two reports on initial () [24, 25] with the values of different signs, K/kbar and respectively, was reported to increase under pressure [26] and no data for under pressure are available so far. For our estimates, within the restrictions mentioned above, are qualitatively consistent with the small and negative reported in Ref. [24]. Our results predict high sensitivity of both and to uniaxial pressure. Within the above analysis, we can expect that the weak ferromagnetic state is very fragile and hydrostatic pressure as moderate as 1 kbar will drive to zero. It will require heat capacity measurements under pressure to verify this prediction. It is curious that whereas is almost pressure independent and and appear to be very pressure sensitive, another perturbation to the material, Co doping to the Ni site, yields the opposite effect [27]: already 6% of Co in Er(Ni1-xCox)2B2C brings down to below 2 K, while 8% of Co causes decrease of only by K and has almost no effect on . Comparison of these two perturbations suggests that steric effects are well separated from band-filling effects in ErNi2B2C.
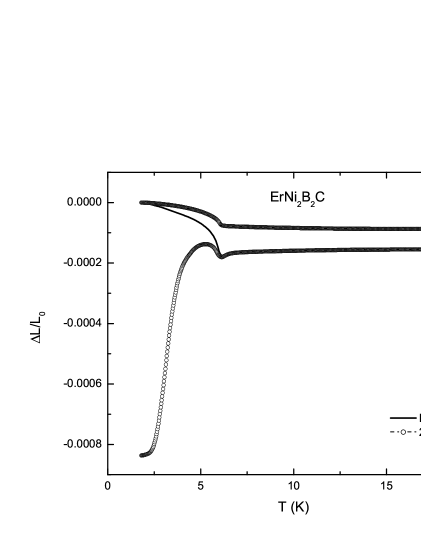
Longitudinal magnetostriction of ErNi2B2C for is shown in Fig. 4. In the overlaping temperature range our data are consistent with the results of Ref. [16]. At base temperature (1.8 K) features associated with four metamagnetic transitions can be distinguished in the derivative of magnetostriction with respect to magnetic field (Fig. 5), consistent with (within errors of orientation) with the magnetization data. The base temperature magnetostriction data suggest that, in agreement with earlier magnetization studies [10, 28, 29] the phase diagram for ErNi2B2C is richer and more complex than suggested in Ref. [16].
In summary, thermal expansion measurements combined with temperature-dependent specific heat data, allow us to estimate uniaxial pressure dependencies of three phase transitions in ErNi2B2C, superconducting, antiferromagnetic and weak ferromagnetic. Our data are roughly consistent with the results of hydrostatic pressure effect on superconducting transition temperature. Both, Néel and weak ferromagnetic ordering temperature are envisaged to be very sensitive to stress/pressure. Additionally, magnetostriction is shown to be a useful probe for rich and complex phase diagram in this material.
References
- [1] P. C. Canfield, P. L. Gammel, D. J. Bishop, Phys. Today 51(10), 47 (1998).
- [2] K.-H. Müller, V. N. Narozhnyi, Rep. Progr. Phys. 64, 943 (2001).
- [3] K.-H. Müller, G. Fuchs, S.-L. Drechsler, V. N. Narozhnyi in: K. H. J. Buschow (Ed.) Handbook of Magnetic Materials vol. 14 (Amsterdam: North-Holland) p. 199, 2002.
- [4] S. L. Bud’ko, P. C. Canfield, C. R. Physique 7 56 (2006).
- [5] R. J. Cava, H. Takagi, B. Batlogg, H. W. Zandbergen, J. J. Krajewski, W. F. Peck Jr., R. B. van Dover, R. J. Felder, T. Siegrist, K. Mizuhashi, J. O. Lee, H. Eisaki, S. Uchida, Nature 367, 252 (1994).
- [6] H. Eisaki, H. Takagi, R. J. Cava, B. Batlogg, J. J. Krajewski, W. F. Peck Jr., K. Mizuhashi, J. O. Lee, S. Uchida, Phys. Rev. B 50, 647 (1994).
- [7] B. K. Cho, P.C. Canfield, L. L. Miller, D. C. Johnston, W. P. Beyermann, A. Yatskar, Phys. Rev. B 52, 3684 (1995).
- [8] J. Zarestky, C. Stassis, A.I. Goldman, P.C. Canfield, P. Dervenagas, B. K. Cho, D. C. Johnston, Phys. Rev. B 51, 678 (1995).
- [9] S. K. Sinha, J. W. Lynn, T. E. Grigereit, Z. Hossain, L. C. Gupta, R. Nagarajan, C. Godart, Phys. Rev. B 51, 684 (1995).
- [10] P.C. Canfield, S. L. Bud’ko, B. K. Cho, Physica C 262, 249 (1996).
- [11] S.-M. Choi, J. W. Lynn, D. Lopez, P. L. Gammel, P.C. Canfield, S. L. Bud’ko, Phys. Rev. Lett. 87, 107001 (2001).
- [12] H. Kawano-Furukawa, H. Takeshita, M. Ochiai, T. Nagata, H. Yoshizawa, H. Takeya, K. Kadowaki, Phys. Rev. B 65, 180508 (2002).
- [13] U. Jaenicke-Roessler, P. Paufler, G. Zahn, S. Geupel, G. Behr, H. Bitterlich, J. Alloys Compd. 333, 28 (2002).
- [14] C. Detlefs, A. H. M. Z. Islam, T. Gu, A.I. Goldman, C. Stassis, P.C. Canfield, J. P. Hill, T. Vogt, Phys. Rev. B 56, 7843 (1997).
- [15] M. Crespo, H. Suderow, S. Vieira, S. Bud’ko, P. C. Canfield, Physica B 378-380, 471 (2006).
- [16] M. Doerr, M. Rotter, M. El Massalami, S. Sinning, H. Takeya, M. Loewenhaupt, J. Phys.: Cond. Mat. 14, 5609 (2002).
- [17] M. Xu, P. C. Canfield, J. E. Ostenson, D. K. Finnemore, B. K. Cho, Z. R. Wang, D. C. Johnston, Physica C 227 321 (1994).
- [18] P. C. Canfield, I. R. Fisher, J. Crystal Growth 225 155 (2001).
- [19] X. Y. Miao, S. L. Bud’ko, P. C. Canfield, J. Alloys Compd. 338 13 (2002).
- [20] G. M. Schmiedeshoff, in preparation.
- [21] S. L. Bud’ko, G. M. Schmiedeshoff, G. Lapertot, P. C. Canfield, preprint cond-mat/0606746 (2006).
- [22] L. Ya. Vinnikov, J. Anderegg, S. L. Bud’ko, P. C. Canfield, V. G. Kogan, Phys. Rev. B 71 224513 (2005).
- [23] H. Bluhm, S. E. Sebastian, J. W. Guikema, I. R. Fisher, K. A. Moler, Phys. Rev. B 73 014514 (2006).
- [24] H. Schmidt, H. F. Braun, Physica C 229 315 (1994).
- [25] E. Alleno, J. J. Neumeier, J.D. Thompson, P. C. Canfield, B. K. Cho, Physica C 242 1694 (1995).
- [26] N. Matsuda, H. Setoguchi, T. Kagayama, G. Oomi, B. K. Cho, P. C. Canfield, Physica B 281&282 1001 (2000).
- [27] S. L. Bud’ko, P. C. Canfield, Physica B 280 356 (2000).
- [28] P. C. Canfield, S. L. Bud’ko, J. Alloys Compd. 262-263 169 (1997).
- [29] S. L. Bud’ko, P. C. Canfield, Phys. Rev. B 61 R14932 (2000).
| transition | |||||||
|---|---|---|---|---|---|---|---|
| (K) | (J/mol K) | ( K-1) | ( K-1) | (K/kbar) | (K/kbar) | (K/kbar) | |
| SC | 10.1 | 0.24 | 0.01 | -0.08 | |||
| AFM | 6.1 | 23.3 | -117 | ||||
| WFM | 2.3 | 0.6 | -9.0 | -1.4 |