Anomalous Absorption Line in the Magneto-Optical Response of Graphene
Abstract
The intensity as well as position in energy of the absorption lines in the infrared conductivity of graphene, both exhibit features that are directly related to the Dirac nature of its quasiparticles. We show that the evolution of the pattern of absorption lines as the chemical potential is varied encodes the information about the presence of the anomalous lowest Landau level. The first absorption line related to this level always appears with full intensity or is entirely missing, while all other lines disappear in two steps. We demonstrate that if a gap develops, the main absorption line splits into two provided that the chemical potential is greater than or equal to the gap.
pacs:
78.20.Ls, 71.70.Di, 81.05.UwWhile graphene has only recently been isolated Novoselov2004Science , several anomalous dc properties already appear well established Geim2005Nature ; Kim2005Nature ; Zhang2006PRL . This includes an unconventional integer quantum Hall effect with filling factor Geim2005Nature ; Kim2005Nature ; Zheng2002PRB ; Gusynin2005PRL ; Peres2006PRB which changes to at a magnetic field above Ref. Zhang2006PRL , which may indicate an opening of a gap. Also observed is a Berry phase of Geim2005Nature ; Kim2005Nature ; Gusynin2005PRL which increases to in bilayers Novoselov2006NaturePh . These spectacular dc properties can be traced to the nature of the quasiparticles in graphene which are massless Dirac fermions governed by dimensional quantum electrodynamics Semenoff1984PRL ; Haldane1988PRL . Optical conductivity measurements play a central role in solid state physics and have provided additional information on the dynamics of charge carriers and its change under external perturbations, not directly available in dc measurements. Here we present a theory of the diagonal optical conductivity of Dirac quasiparticles in an external magnetic field and highlight several unusual features, not present in a conventional two dimensional electron gas, which bear directly on their unconventional dynamics. We also investigate an emerging new physics of graphene related to the sublattice symmetry breaking reported in Ref. Zhang2006PRL .
In the presence of a magnetic field, Landau levels (LLs) form in the electronic density of states and transitions between these levels give rise to absorption lines in the optical conductivity. In this letter we find that the selection rules, which set the frequencies of the lines and their relative spectral weight, provide a distinct signature of the presence of the Dirac quasiparticles. Not only do the positions and the intensities of the absorption lines scale with rather than , but the line corresponding to the transition from the lowest, to the (Landau level) LL is anomalous due to the special Dirac character of the level. This level and no others can participate in both inter and intraband transitions. As a consequence, the first absorption line always appears with full intensity or is entirely missing, while all other lines can also be seen to have in addition half intensity depending on the position of chemical potential relative to the LL energies. The chemical potential is tunable in experiments by application of a gate bias voltage to a field effect device Novoselov2004Science ; Geim2005Nature ; Kim2005Nature ; Zhang2006PRL .
Expressions for the absorptive part of the diagonal as well as Hall conductivity on which our calculations are based can be found in Gusynin2006PRB ; Gusynin2006PRL ; Peres2006PRB . In the limit of zero impurity scattering rate, , the diagonal conductivity as a function of the photon energy is
| (1) |
where the thermal factors are and with the Fermi distribution (we set the Boltzmann constant ). To include damping, the ’th delta function in Eq. (LABEL:sigma-gap) is replaced by a Lorentzian of width with the width of ’th level. Also in Eq. (LABEL:sigma-gap) a term is to be subtracted. In the presence of an excitonic gap Khveshchenko2001PRL ; Gorbar2002PRB the LL energies are , with , and is the Fermi velocity in graphene, is Planck’s constant over , is the velocity of light and is the charge of the electron. The field is applied perpendicular to the plane and for the energy scale for and . As for the conventional case, the selection rules allow transitions only between adjacent LLs (see Ref. Gusynin2006PRB for details).
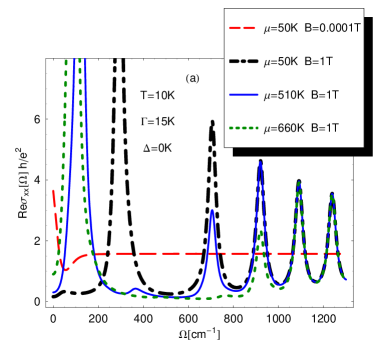
Our numerical results for are given in Fig. 1 (a), where it is plotted in units as a function of for . The same constant electronic scattering rate Zhang2006PRL was used for all LLs, an assumption that could easily be relaxed. Except for the long dashed (red) curve for which the magnetic field , and is shown only for comparison, for other curves. They differ only in value of chemical potential . The dash-dotted (black) curve has ; solid (blue) curve has , and the short dashed (green) curve has . The curves remain essentially unchanged for any values of between and and evolve rapidly from one pattern to the next as a new LL is crossed, for a change in chemical potential of order or whichever is greater.
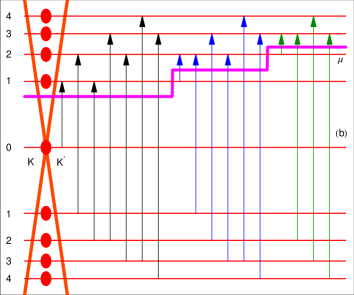
Referring to Fig. 1(a), in the dash-dotted (black) curve the lowest energy peak is at and the others at , all correspond to interband transitions from negative to positive Dirac cones. As is increased to cross the LL [solid (blue) curve], the first peak in the dash-dotted (black) curve disappears and the intensity of the next higher peak drops to half its value, while all other peaks remain the same. In addition, a new intraband peak appears at and its intensity picks up the lost optical spectral weight from the missing and/or reduced interband transitions. Comparing with the short-dashed (green) curve, the first two interband lines have disappeared, the third has halved and the intraband transition is at . The first line of the interband series is different in that it never appears with half intensity, while the others do. It is the only one which can be considered as involving both interband and intraband transitions as can be seen in Fig. 1 (b). The energy level schematic shown in this figure summarizes our results. It shows how the first interband line on the far left appears alone, while all others come in pairs. This transition exists only for values of the chemical potential less than , while the others first drop to half intensity as another LL is crossed before disappearing at the next crossing.
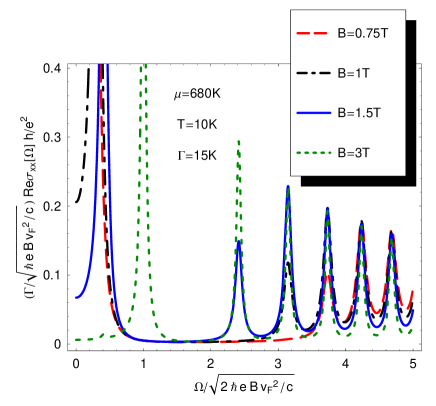
To verify these predictions optical experiments on graphene based field effect device would allow one to change the chemical potential as in Fig. 1 through a change in gate voltage. Such optical experiments have been reported by Li el al. Basov-organic in organic metals. It is however also possible to get the same information for a fixed chemical potential if is measured at a few well chosen values of the external magnetic field . This is illustrated in Fig. 2. To see the desired effect it was convenient to normalize to and to multiply the vertical scale by the dimensionless quantity . This arrangement guarantees that the various interband lines will all fall at the same normalized value of and the intensity of the various lines follow the same pattern as in Fig. 1.
To understand the intensity that is to be assigned to the various lines and their changes with it is sufficient to take the limit in Eq. (LABEL:sigma-gap). For chemical potential we find ()
| (2) |
where the first and second terms give the interband and intraband transitions, respectively, at the energies indicated by the -functions. The denominators come from the factor in Eq. (LABEL:sigma-gap). In units of which goes like , the optical spectral weight of various lines is given by the quantities multiplying -functions in Eq. (2). For all interband lines below are missing and the intensity of the line at is half of . The total optical spectral weight lost is
| (3) |
The right hand side is exactly the intensity of the corresponding intraband line given by the second term in (2). We verified that the integrated optical spectral weight under up to energy is linear in and approximately equal to provided is taken large enough for many LLs to be involved. This linear in behavior which holds as well for is another signature of the existence of the Dirac cones. In ordinary metals for the optical sum would rapidly saturate to a constant value as is increased beyond the scattering rate . The above rules for the intensity as well as the peculiar behavior of the first inter- (intra-) band line as is increased from zero are specific to graphene and as yet have not been verified experimentally, although some data exist as we now describe.
The early magneto-reflectance data Toy1977PRB in fields of order of to in graphite assigned LL lines to the -point in the Brillouin zone. Some of these have central frequencies which vary as the square root Basov-foot of as expected in graphene. More recent data by Li et al. Li2006 who use high fields up to , show conventional linear in behavior. However, very recently, infrared transmission data Sadowski2006 on ultrathin epitaxial graphite samples Berger2006Science in fields up to have become available and provide . A scaling for both the energy and the intensity of the first line was taken as evidence for Dirac quasiparticles. In view of the known sensitivity of some properties to coupling between layers it is not obvious that the various carbon sheets in the samples are sufficiently decoupled to be treated as isolated graphene sheets Basov-foot . Further, to understand the results it is necessary to assume that there is a variation in charging, i.e. each sheet can have different chemical potential. We have analyzed the intensities of the one intraband and of the three interband transitions reported in Sadowski2006 . The intensity of the first interband line (B) in Fig. 1 of Ref. Sadowski2006 , which can occur only for , is the largest and that of the intraband line (A) is smaller by a factor of . This can only be understood if there are at least three times more sheets for which the chemical potential falls below than above. Further, the ratio of the intensity of the second (C) and the third (D) interband lines to the first (B) are and , respectively. These values are somewhat smaller than and expected from our theory, coming from the sheets with . Adding in the other sheets with only increase the above discrepancy, because they add to the second and third interband lines, but not to the first. While the above provides some indirect support of our theory, further experiments are needed to verify the main features described here. A case for further studies is a bilayer Abergel2006 where it is known Novoselov2006NaturePh that the two lowest LLs both lie at zero energy and this should change the pattern of behavior of the absorption lines described here.
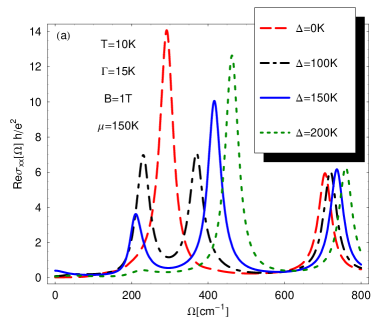
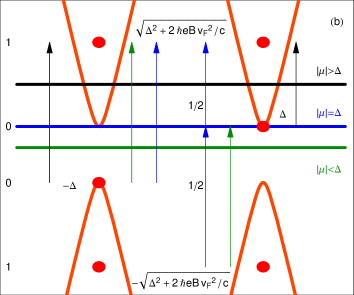
The ac conductivity may also be used to get information on the opening of a possible gap related to the sublattice symmetry breaking in graphene Zhang2006PRL ; Khveshchenko2001PRL ; Gorbar2002PRB ; Nomura2006 ; Alicea2006 ; Gusynin2006catalysis . In Fig. 3 (a) we show results for plotted using the generalization of Eq. (LABEL:sigma-gap) to finite . Four values of the excitonic gap are considered. For the single peak at has split into two of nearly equal intensity, for the lower peak has approximately the intensity of the upper peak and for a single peak is seen at the higher energy. Fig. 3 (b) gives a schematic of the levels involved and shows the transitions. For convenience we have fixed the gap in the figure and considered three values of chemical potential. For the interband transition to (LHS cone) and to (RHS cone) are both possible and have the same energy , so only one line is seen shifted to higher energy. For one needs to account for the fact that the state at (RHS cone) is occupied (unoccupied) with probability . The possible interband transitions are to (LHS cone) with energy and to with energy , and an intraband transition of to with energy (RHS cone) each weighted by rather than by . This gives a to ratio favoring the higher energy line. Finally, for , the to interband transition (LHS) has energy and the intraband transition of to (RHS) has energy . The two lines have nearly the same intensity. It is clear that optics provides a useful probe for observing various kinds of gaps and here the excitonic gap is taken as an example.
In summary, we have found an anomaly in the first absorption peak in the optical conductivity of graphene. When the chemical potential, tunable by the gate voltage, sweeps through the various LL energies, this peak never halves its intensity before disappearing while the other lines do. This pattern of behavior is specific to the Dirac nature of quasiparticles in graphene and should be easily observable in the experiments. It originates from the special structure of LLs in graphene, where each positive energy level has its negative counterpart, except for the zero energy lowest LL. For the Shubnikov de Haas oscillations Gusynin2005PRB this structure of LLs resulted in a phase shift of used to identify these quasiparticles in the dc measurements Geim2005Nature ; Kim2005Nature . Furthermore, should an excitonic gap open in high magnetic field, its presence will lead to a specific signature in an ac optical experiment. For , the to transition will split into two lines of nearly equal intensity, while for the intensity ratio of higher to lower energy line will be about . For the line will simply shift upward without splitting.
The work of V.P.G. was supported by the SCOPES-project IB7320-110848 of the Swiss NSF. Work by J.P.C. and S.G.Sh. was supported by NSERC and CIAR. We thank D.N. Basov, A.K. Geim and J.S. Hwang for discussions and E.J. Nicol for clarifying discussions and suggestions on the manuscript.
References
- (1) K.S. Novoselov et al., Science 306, 666 (2004)
- (2) K.S. Novoselov et al., Nature 438, 197 (2005).
- (3) Y. Zhang et al., Nature 438, 201 (2005).
- (4) Y. Zhang et al., Phys. Rev. Lett. 96, 136806 (2006).
- (5) Y. Zheng and T. Ando, Phys. Rev. B 65, 245420 (2002).
- (6) V.P. Gusynin and S.G. Sharapov, Phys. Rev. Lett. 95, 146801 (2005).
- (7) N.M.R. Peres, F. Guinea, and A.H. Castro Neto, Phys. Rev. B 73, 125411 (2006).
- (8) K.S. Novoselov et al., Nature Physics 2, 177 (2006).
- (9) G.W. Semenoff, Phys. Rev. Lett. 53, 2449 (1984).
- (10) F.D.M. Haldane, Phys. Rev. Lett. 61, 2015 (1988).
- (11) V.P. Gusynin and S.G. Sharapov, Phys. Rev. B 73, 245411 (2006).
- (12) V.P. Gusynin, S.G. Sharapov and J.P. Carbotte, Phys. Rev. Lett. 96, 256802 (2006).
- (13) D.V. Khveshchenko, Phys. Rev. Lett. 87, 206401 (2001); ibid. 87, 246802 (2001).
- (14) E.V. Gorbar, V.P. Gusynin, V.A. Miransky, and I.A. Shovkovy, Phys. Rev. B 66, 045108 (2002).
- (15) Z.Q. Li et al., Nano Letters 6, 224 (2006).
- (16) W.W. Toy, M.S. Dresselhaus, and G. Dresselhaus, Phys. Rev. B 15, 4077 (1977).
- (17) D.N. Basov has pointed out to us that the two main transitions in Sadowski2006 agree well with the data of Toy et al. Toy1977PRB on graphite.
- (18) M.L. Sadowski et al., Phys. Rev. Lett. 97, 266405 (2006).
- (19) Z.Q. Li et al., Phys. Rev. B 74, 195404 (2006).
- (20) C. Berger et al., Science 312, 1191 (2006).
- (21) D.S.L. Abergel, V.I. Fal’ko, Preprint cond-mat/0610673.
- (22) K. Nomura and A. H. MacDonald, Phys. Rev. Lett. 96, 256602 (2006).
- (23) J. Alicea and M.P.A. Fisher, Phys. Rev. B 74, 075422 (2006).
- (24) V.P. Gusynin, V.A. Miransky, S.G. Sharapov, and I.A. Shovkovy, Phys. Rev. B 74, 195429 (2006).
- (25) V.P. Gusynin and S.G. Sharapov, Phys. Rev. B 71, 125124 (2005).