Spin Wave Lifetimes Throughout the Brillouin Zone
We use a neutron spin-echo method with eV resolution to determine the lifetimes of spin waves in the prototypical antiferromagnet MnF2 over the entire Brillouin zone. A theory based on the interaction of magnons with longitudinal spin fluctuations provides an excellent, parameter-free description of the data, except at the lowest momenta and temperatures. This is surprising, given the prominence of alternative theories based on magnon-magnon interactions in the literature. The results and technique open up a new avenue for the investigation of fundamental concepts in magnetism. The technique also allows measurement of the lifetimes of other elementary excitations (such as lattice vibrations) throughout the Brillouin zone.
The concept of elementary excitations is one of the basic pillars of the theory of solids. In the low-temperature, long-wavelength limit, such excitations do not interact and have an infinite lifetime. For nonzero temperatures and momenta, the lifetimes of elementary excitations are generally limited by collisions with other excitations, with important consequences for the macroscopic properties of solids. For instance, the thermal expansion of solids can be understood as a consequence of collisions between lattice vibrations (phonons). Because of their comparatively simple Hamiltonians, magnetically-ordered states are excellent testing grounds for theories of elementary excitations and their interactions. Despite this, the damping of spin waves (magnons) in antiferromagnets has remained an open problem for four decades. Theoretical calculations of magnon lifetimes have been carried out since the 1960’s, with intensive development occurring on several fronts in the early 1970’s. However, these activities ground to a halt by the mid-1970’s due to the lack of appropriate experimental data, namely, from momentum-resolved measurements with sufficient energy resolution. The only low-temperature data available were taken with , in antiferromagnetic resonance (AFMR) and parallel pumping measurements [1, 2]. Because of the limited energy resolution, momentum-resolved data from neutron spectroscopy [3], on the other hand, were confined to the critical regime extremely close to the Néel temperature (), where most theories do not apply. Until recently, no other experimental techniques were available which permitted high-resolution measurements of excitation lifetimes at low temperatures over the whole Brillouin zone. We report on a new neutron spectroscopy method with eV resolution which is used to measure spin wave (magnon) lifetimes in the prototypical antiferromagnet MnF2 over the temperature range from 0.04 - 0.6 . The results subject long-standing theoretical predictions to a first experimental test and hold promise as a novel probe of elementary excitations in quantum magnets. The technique is also widely applicable to other elementary excitations such as phonons and crystal field excitations.
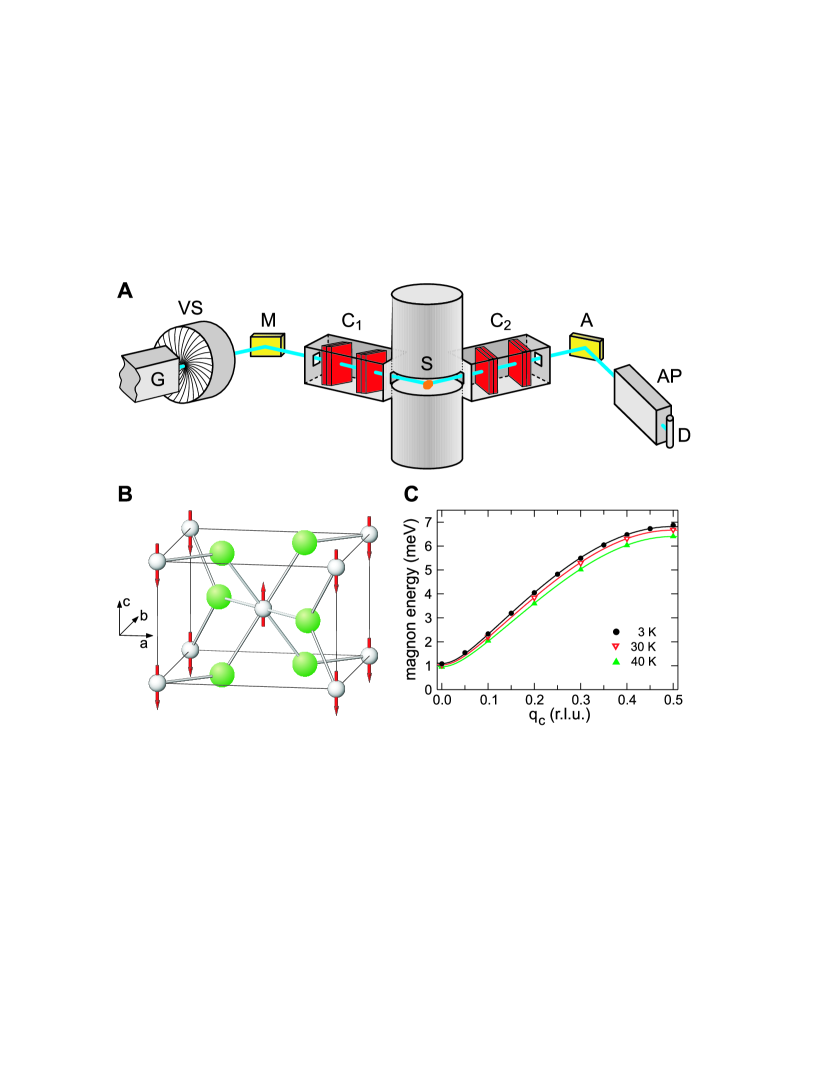
The determination of magnon lifetimes at low temperatures requires an energy resolution in the eV range, about two orders of magnitude better than that achievable by standard neutron triple-axis spectroscopy (TAS). We have obtained the requisite gain in resolution by manipulating the Larmor phase of the neutron spin with magnetic fields. The TRISP spectrometer (Fig. 1A) weds the capability of TAS of accessing collective excitations throughout the Brillouin zone to the extremely high energy resolution of neutron spin-echo spectroscopy[5]. As in typical spin-polarized triple-axis spectrometry, the neutrons impinging upon the sample are polarized, and the polarization of neutrons scattered from the sample is measured. On TRISP, this is accomplished through the use of a polarizing neutron guide and a transmission polarizer, respectively. However, in analogy to neutron spin-echo spectrometry, the TRISP spectrometer also includes regions of effectively constant magnetic field which are produced by pairs of radio-frequency (RF) resonance coils inserted symmetrically 1) between the monochromator and sample and 2) between the sample and the analyzer [6]. The RF frequencies in the coils are tuned such that each detected neutron that creates an excitation lying on the magnon dispersion curve has the same net Larmor phase after traversing the two spin-echo arms, independent of small variations in the wave vector of the excitation. The neutron spin polarization determined at the detector is then a measure of the linewidth (inverse lifetime) of the magnon. In this way, the measured linewidth is decoupled (to first order) from the spread in energy of the neutrons incident on the sample, which is responsible for the instrumental resolution in TAS. (For a detailed description of the technique, see the Materials and Methods section.)
We chose the antiferromagnet MnF2 for the experiment, as its magnetic ground state and excitations have been investigated extensively. The lattice structure and magnetic ordering of MnF2 are shown in Fig. 1B. MnF2 has the body-centered tetragonal structure, with a = b = 4.8736 Å and c = 3.2998 Å. The Mn2+ ions have spin S = 5/2, and the spin in the center of the unit cell is oriented antiparallel to those at the corners. The strongest magnetic interaction is between second-nearest-neighbor Mn2+ spins (corner and center spins) and is antiferromagnetic [7]. A weaker, ferromagnetic interaction exists between nearest-neighbor spins (along the -axis). A relatively strong uniaxial anisotropy which is predominantly the result of dipole-dipole interactions [8, 9] causes the spins to align along the -axis. is 67.6 K. The slope of the magnon dispersion is required to set the tilt angles of the RF coils and to determine the non-intrinsic contribution to the data (see Materials and Methods). During the experiment, the spin-wave dispersion was therefore measured at each temperature at which linewidth data was taken; a partial data set is shown in Fig. 1C.
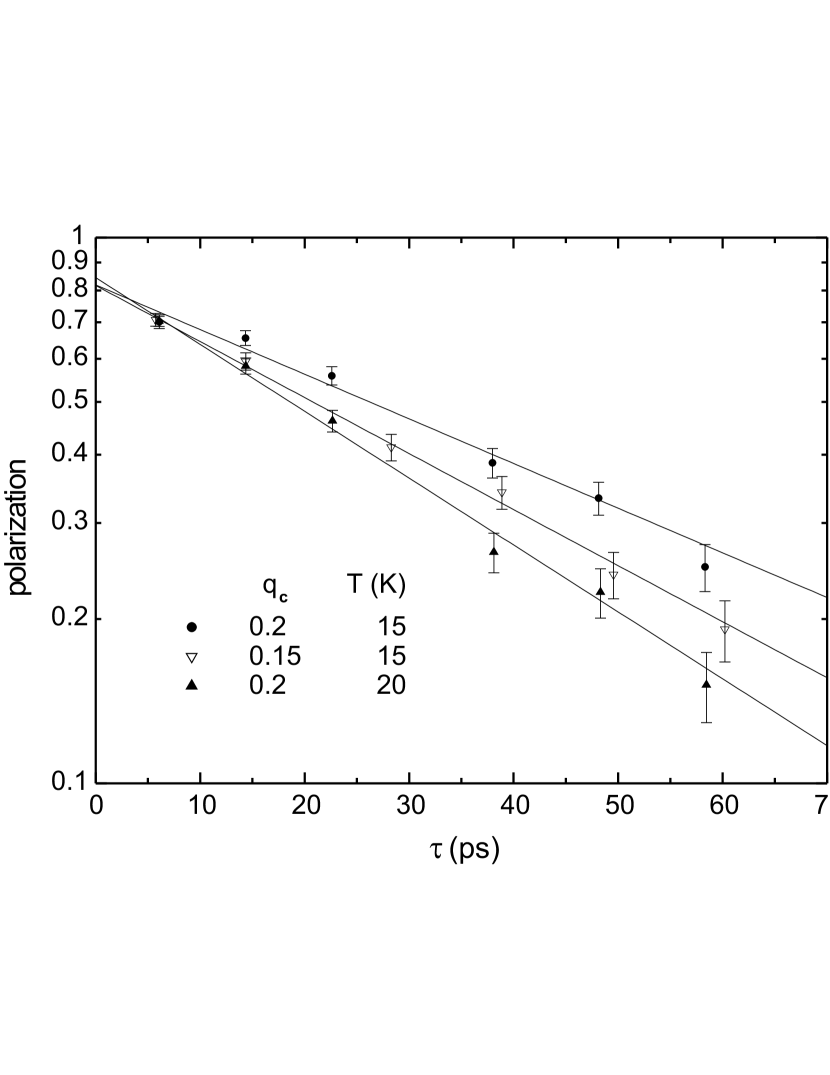
Fig. 2 shows raw polarization data as a function of the spin-echo time . The spin-echo time is proportional to the frequency in the RF coils and the distance between the coils, and also depends on the neutron wavelength. In a neutron spin-echo experiment, the dependence of the measured polarization on corresponds to the Fourier transform of the scattering function as a function of energy. The data in Fig. 2 are described well by an exponential decay, which indicates that the spectral function which characterizes the magnon linewidth is a Lorentzian in energy. The difference in linewidth (half-width at half maximum, or HWHM) between the upper two and lower two data sets is in each case only 3 eV, but it can be resolved clearly. The upper pair of data sets represents a difference in of 0.05 r.l.u. at 15 K [10]. For comparison, the HWHM of the corresponding TAS scans of the lower two magnons in Fig. 2, taken with fixed final neutron wave vector =1.7 Å-1, is approximately 100 eV.
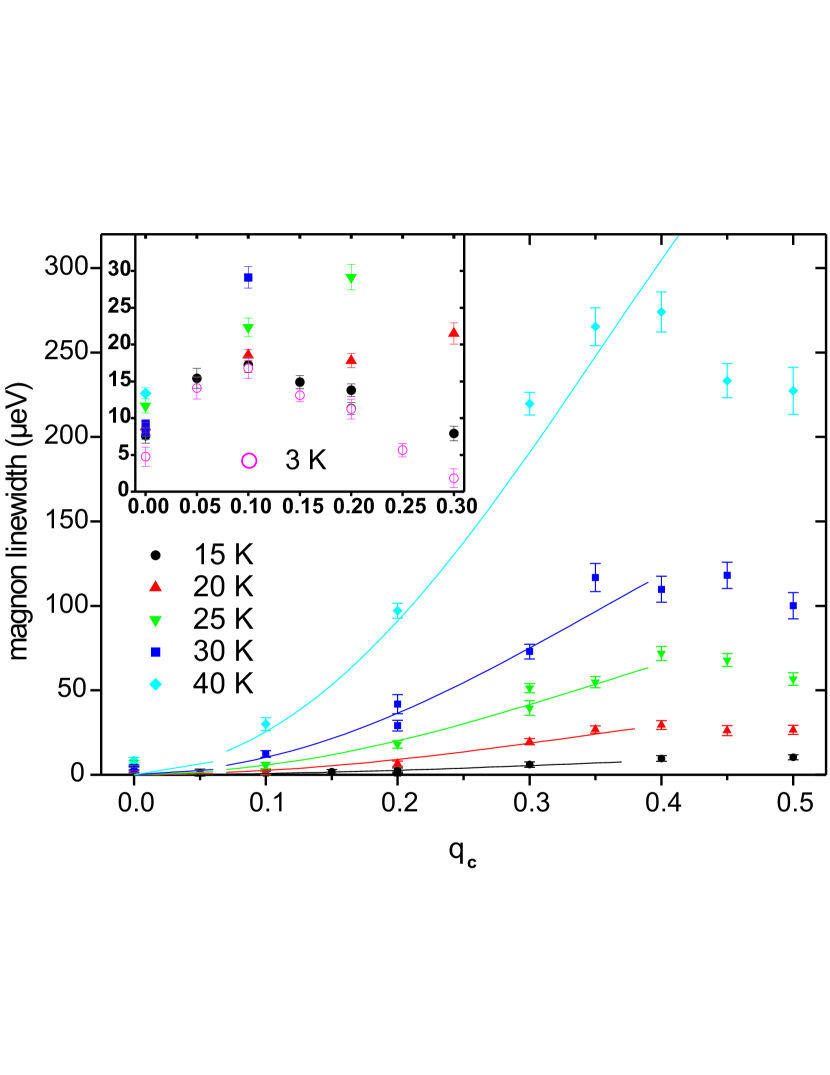
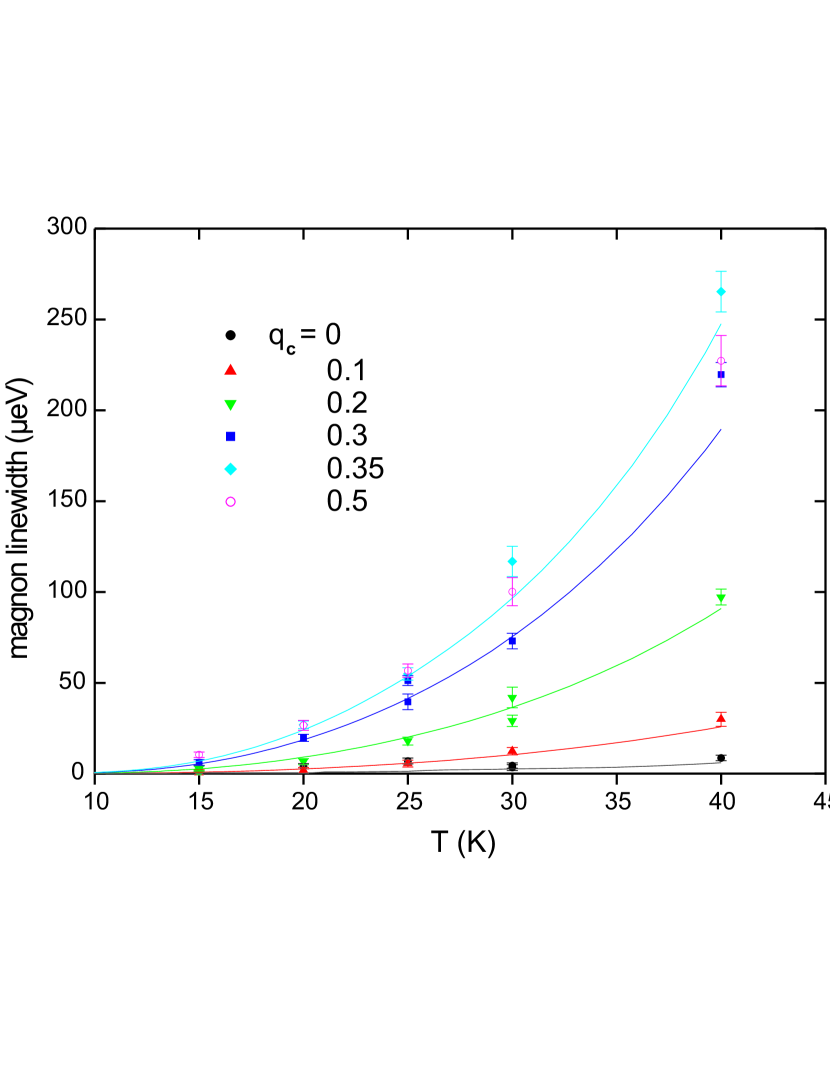
The raw data were then corrected for instrumental and non-intrinsic effects [11]. Figs. 3 and 4 show the intrinsic magnon linewidth as a function of momentum and temperature T, respectively. The linewidth generally increases with increasing and T, due to the increasing likelihood of collisions with other excitations. However, Fig. 3 also shows that the linewidth deviates from this general trend and exhibits peaks as a function of close to the center and the boundary of the antiferromagnetic Brillouin zone. The low- peak is already present at 3 K, the lowest temperature covered by this experiment, and it evolves weakly with increasing temperature. This behavior is not described by the dominant magnon relaxation mechanisms for which quantitative predictions are available; possible origins will be discussed below. In order to facilitate comparison with these predictions, we have treated the 3 K linewidth data as a temperature-independent contribution and subtracted it from the higher-temperature data. The results are shown in the main panels of Figs. 3 and 4.
The intrinsic relaxation channel for magnons that has received by far the most attention in the literature is magnon-magnon scattering. In an “-magnon” scattering event, a magnon (here, one excited by an incoming neutron) scatters off thermally excited magnons, producing scattered magnons which are in thermal equilibrium with the sample. In the absence of defects and external magnetic fields, the lowest-order interaction which limits the magnon lifetime is 4-magnon scattering. Unfortunately, a comprehensive survey of the literature revealed very few theoretical predictions appropriate for comparison with our data, despite the existence of considerable work on 4- and 6-magnon interactions. This is either because the calculations employed approximations valid only in high magnetic fields (for the purpose of comparison with AFMR data), or because strict inequalities that define the range of applicability of the theoretical results are extremely difficult to satisfy experimentally. An analytical expression was given by Harris et al. [12], who evaluated the contribution to the linewidth from 4-magnon scattering processes analytically for the case of single-ion anisotropy with [13]. The corresponding result is shown in the bottom trace of Fig. 4. At low temperatures, the temperature dependence of the data is considerably weaker than that predicted by this theoretical result for . The best agreement of the magnitude occurs at 40 K, where the experimental result is % larger than the theoretical. Predictions for an anisotropy gap of dipolar origin, which would be more appropriate for MnF2, are not available.
An additional relaxation channel, in which magnons are scattered by thermally-excited longitudinal spin fluctuations, was considered by Stinchcombe and coworkers [14, 15]. The curves in Figs. 3 and 4 are based on this mechanism. (For , where the contribution of this relaxation is identically zero, we have shown the prediction of the 4-magnon relaxation model, as discussed above.) For the larger- data, the linewidth far from is given approximately by
| (1) |
where is the magnon energy, , = 2.969 Å2, = 5.864 Å3, and = 1/kBT, with kB the Boltzmann constant [15]. The anisotropy parameter is equal to 0.0184. The exchange parameter = 6.02 meV includes both first- and second-nearest neighbor exchange interactions. The parameters R0 and R, which are both temperature-dependent, can each be evaluated using either experimental data or results from mean-field theory [15], leading to considerable differences in the magnitude of the calculated linewidth and in its variation with temperature. In determining R0, we used experimental data for the staggered magnetization [16]. Calculation of R0 from the Brillouin function produces linewidth values which agree at the lowest temperatures and begin to deviate with increasing temperature: at 40 K, the calculated linewidth is 11% smaller. For R, we used the derivative of the Brillouin function. Calculation of R instead from experimental data for the parallel magnetic susceptibility [17] produces linewidth results which are 40% larger at 15 K and 30% smaller at 40 K.
Given the prominence of the magnon-magnon scattering channel in the literature, the excellent agreement between this model calculation and the experimental data is surprising. The dominance of the relaxation by longitudinal fluctuations is, however, consistent with arguments by Reinecke and Stinchcombe, who estimated that the contribution to the linewidth from 4-magnon scattering is only 1/ of the magnitude of the above term [18]. Here, is the number of neighbors which experience the strongest exchange interaction; = 8 for MnF2, for which case is the number of next-nearest neighbors [19]. As the analytical expression on which the curves in Figs. 3 and 4 are based is valid only at low , deviation from the data at larger is not unexpected. The general expression for the linewidth resulting from scattering by longitudinal spin fluctuations [14, 15] should be evaluated numerically at high to see if the peak as a function of can be reproduced [33, 34].
An explanation of the peak centered at r.l.u. (inset in Fig. 3) requires a different mechanism [20]. An additional potential source of linewidth is the hyperfine interaction, which gives rise to the scattering of electronic magnons from nuclear spin fluctuations [21]. The contribution from the hyperfine interaction would only be weakly temperature dependent, because the nuclear spin system is already highly disordered thermally at 3 K. 4-magnon scattering terms in which one electronic and one nuclear magnon interact have indeed been shown to generate maxima in the linewidth at nonzero , but estimates of the amplitude of this contribution are at least an order of magnitude smaller than the observed effect [21]. The crossing of magnon and TA phonon modes at r.l.u. may also contribute to the peak[22, 23, 24]. An additional relaxation mechanism which must be considered as a possible source of linewidth is that of magnon-phonon scattering. Experimental estimates of the linewidth due to magnon-phonon relaxation in MnF2 in zero field range over three orders of magnitude, but again appear too small to explain the observed peak [25, 26, 27]. A theoretical estimate of the spin-lattice relaxation time (which should be of the same order of magnitude as the magnon-phonon relaxation times) corresponds to a linewidth of 0.5 eV at 25 K in MnF2 [28, 29]. In this theory, the magnon-phonon interaction arises from the phonon modulation of the exchange interaction, and is dominated by 2-magnon-1-phonon processes. The result varies as T5, which corresponds to a linewidth of 1 eV at 30 K and 5 eV at 40 K. The maximum potential contribution to our data would then be 60% of the linewidth at and 40 K. Other mechanisms which may contribute to the presence of this peak include 2- and 3-magnon non-momentum-conserving processes which originate from scattering from defects [30, 31, 21]. The linewidth originating from the latter process is peaked at intermediate . Using parameters derived from comparison with data on RbMnF3, its contribution in MnF2 can be estimated to be two orders of magnitude smaller than the data [31].
The challenge to theory posed by the temperature- and momentum-dependent peaks in the magnon linewidth in MnF2 should stimulate new activity in the field of spin wave decay mechanisms. High-resolution lifetime measurements over the full Brillouin zone in a relatively simple antiferromagnet such as MnF2 permit detailed evaluation of proposed processes, which should provide a basis for addressing such interactions in more complex magnetic systems.
References and Notes
- [1] J.P. Kotthaus, V. Jaccarino, Phys. Lett. A 42, 361 (1973).
- [2] J. Barak, S.M. Rezende, A.R. King, V. Jaccarino, Phys. Rev. B 21, 3015 (1980).
- [3] M.P. Schulhof, R. Nathans, P. Heller, A. Linz, Phys. Rev. B 4, 2254 (1971).
- [4] F. Mezei, Z. Phys. 255, 146 (1972).
- [5] T. Keller et al., Appl. Phys. A 74, S332 (2002).
- [6] R. Golub, R. Gähler, Phys. Lett. A 123, 43 (1987).
- [7] A. Okazaki, K.C. Turberfield, R.W. Stevenson, Phys. Lett. 8, 9 (1964).
- [8] F. Keffer, Phys. Rev. 87, 608 (1952).
- [9] J. Barak, V. Jaccarino, S.M. Rezende, J. Magn. Magn. Mater. 9, 323 (1978).
- [10] We use a notation in which the momentum transferred by the neutron is , where is the momentum transfer within the Brillouin zone centered at the reciprocal lattice vector . These quantities are expressed in reciprocal lattice units (r.l.u.). For instance, =(HKL), with , and , with .
- [11] Materials and methods are available as supporting material on Science Online.
- [12] A.B. Harris, D. Kumar, B.I. Halperin, P.C. Hohenberg, Phys. Rev. B 3, 961 (1971).
- [13] The conditions for application of the results of Harris et al. in various intervals of temperature and energy are quite restrictive due to the presence of strict inequalities, and the resulting analytical expressions for the linewidth are valid only in extremely limited regions, if at all. Here, we have treated these conditions as if they involved simple inequalities, and have plotted the four solutions which apply to different temperature regions together.
- [14] M.G. Cottam, R.B. Stinchcombe, J. Phys. C: Solid State Phys. 3, 2305 (1971).
- [15] R.B. Stinchcombe, T.L. Reinecke, Phys. Rev. B 9, 3786 (1974).
- [16] V. Jaccarino in Magnetism, G.T. Rado, H. Suhl, Eds. (Academic Press, New York, 1965), vol. 2A, pp. 307-355.
- [17] S. Foner in Magnetism, G.T. Rado, H. Suhl, Eds. (Academic Press, New York, 1963), vol. 1, pp. 383-447.
- [18] T.L. Reinecke, R.B. Stinchcombe, Phys. Rev. B 21, 5198 (1980).
- [19] In contrast, in earlier work Cottam and Stinchcombe suggest that in the general case, the linewidth contribution from 4-magnon scattering dominates at low temperatures [14].
- [20] The effect of the curvature of the magnon dispersion on the spin-echo resolution is largest at , and largest at low temperature, where the spin-wave stiffness is strongest. Thus, curvature not properly taken into account in the analytical correction calculation would produce an apparent linewidth. However, this spurious effect would be peaked at , and is therefore unlikely to be responsible for the observed peak.
- [21] R.B. Woolsey, R.M. White, Int. J. Magn. 2, 51 (1972).
- [22] R.L. Melcher, Phys. Rev. B 2, 733 (1970).
- [23] C.A. Rotter, cited by H.G. Smith, N. Wakabayashi in Dynamics of Solids and Liquids by Neutron Scattering, S.W. Lovesey, Ed. (Springer-Verlag, Berlin, 1977), p. 93.
- [24] H. Montgomery, A.P. Cracknell, J. Phys. C: Solid State Phys. 6, 3156 (1973).
- [25] L.D. Rotter, W.D. Dennis, W.M. Yen, Phys. Rev. B 42, 720 (1990).
- [26] G.J. Jongerden, A.F.M. Arts, J.I. Dijkhuis, H.W. de Wijn, Phys. Rev. B 40, 9435 (1989).
- [27] L.D. Rotter, W. Grill, W.M. Dennis, J. Lumin. 45, 130 (1990).
- [28] M.G. Cottam, J. Phys. C: Solid State Phys. 7, 2919 (1974).
- [29] A.Y. Wu, R.J. Sladek, Phys. Rev. B 25, 5230 (1982).
- [30] R. Loudon, P. Pincus, Phys. Rev. 132, 673 (1963).
- [31] R.B. Woolsey, thesis, Stanford University (1970).
- [32] R.M. White, R. Freedman, R.B. Woolsey, Phys. Rev. B 10, 1039 (1974).
- [33] A suggestion of non-monotonic behavior in the linewidth as a function of is contained in Ref. [14]. For the case in which the anisotropy takes the form of an anisotropy field , the linewidth peaks at an intermediate value of and then declines as it approaches the Brillouin zone boundary at r.l.u. However, the estimated value of at which the peak occurs would be only 0.008 r.l.u. for MnF2. The behavior of the linewidth at large for the case of anisotropic exchange was not evaluated.
- [34] Woolsey and White [21] predict a peak as a function of in MnF2 for the linewidth due to a 4-magnon scattering process in a relatively small magnetic field between 2 and 3 K. The peak becomes less pronounced and shifts to higher as the temperature increases to 3 K (from 0.30 r.l.u. at 2 K to 0.37 r.l.u. at 3 K). At a slightly higher field, only a simple maximum is present between 4 and 10 K for a 4-magnon scattering process [31]. The authors did not incorporate anisotropy in their calculations; later work by the same authors showed that the inclusion of anisotropy results in a decrease in the calculated linewidth of roughly an order of magnitude for in a large magnetic field [32].
- [35] We would like to express our thanks to G. Schmidt of the Crystal Growth Facility of the Cornell Center for Materials Research for the loan of a MnF2 crystal of excellent quality, R. Henes and J. Major for the gamma-ray diffractometry measurements, J. Peters for cryogenic assistance, G. Khaliullin and R.K. Kremer for illuminating discussions, P. Aynajian for participation in some of the calibration measurements, and R. Noack for technical assistance.
Supporting Online Material
www.sciencemag.org
Materials and Methods
Fig. S1
References
Figures