Incommensurate magnetic order in Ag2NiO2
Abstract
The nature of the magnetic transition of the half-filled triangular antiferromagnet Ag2NiO2 with =56K was studied with positive muon-spin-rotation and relaxation (SR) spectroscopy. Zero field SR measurements indicate the existence of a static internal magnetic field at temperatures below . Two components with slightly different precession frequencies and wide internal-field distributions suggest the formation of an incommensurate antiferromagnetic order below 56 K. This implies that the antifrerromagnetic interaction is predominant in the NiO2 plane in contrast to the case of the related compound NaNiO2. An additional transition was found at 22 K by both SR and susceptibility measurements. It was also clarified that the transition at 260 K observed in the susceptibility of Ag2NiO2 is induced by a purely structural transition.
pacs:
76.75.+i, 75.25.+z, 75.30.Kz, 75.50.EeI Introduction
Two-dimensional triangular lattice () antiferromagnets with a half-filled () state exhibit a variety of magnetically ordered states due to competition between the antiferromagnetic (AF) interaction and geometrical frustration. The discovery of superconductivity in Na0.35CoO1.3H2O NCO_sc_1 leads to an additional interest in the possible relationship between magnetic and superconducting order parameters in the near half-filling. The layered nickel dioxides, a series of materials with chemical formula Ni3+O2, such as rhombohedral LiNiO2,LNO_1 ; LNO_2 , NaNiO2NNO_1 ; NNO_2 ; NNO_3 , and AgNiO2,ANO_1 ; ANO_2 in which Ni ions form the by the connection of edge-sharing NiO6 octahedra, has been considered to be good candidates for an ideal half-filled . In these materials at low temperature, there is a strong interaction between the Ni3+ ions and the crystalline electric field of the NiO6 octahedron. This causes the Ni3+ ions to be in the low spin state with a (=1/2) configuration.
Among the three layered nickel dioxides, NaNiO2 is perhaps the best investigated. It exhibits two transitions at 480 K and =23 K. The former is a cooperative Jahn-Teller (JT) transition from a high- rhombohedral phase to a low- monoclinic phase, while the latter is a transition into an A-type AF phase — i.e. ferromagnetic (FM) order in the NiO2 plane but AF between the two adjacent NiO2 planes, as has been reconfirmed very recently by both neutron diffractionNNO_1 ; NNO_2 and positive muon spin rotation/relaxation (SR) experiments.NNO_3 The magnetic order is associated with the JT induced trigonal distortion which stabilizes a half occupied orbital.NNO_4
Although LiNiO2 and NaNiO2 are structurally very similar, LiNiO2 shows dramatically different magnetic properties. LiNiO2 exhibits neither a cooperative JT transition nor long-range magnetic order down to the lowest investigated. In fact, both heat capacity and NMR measurements suggest a spin-liquid state with short-range FM correlations.LNO_1 Chatterji et al.LNO_2 , however, found a rapid increase in the muon spin relaxation rates in LiNiO2 below 10 K using the longitudinal field-SR technique, suggesting a spin-glass-like behavior below 10 K. The discrepancy between the two results is considered to be a sample-dependent phenomenon that arises from the difficulties in preparing stoichiometric LiNiO2. The third compound, AgNiO2, also lacks a cooperative JT transition. A magnetic transition was clearly observed by both susceptibility () and SR measurements but long-range magnetic order was not detected by a neutron diffraction experiment even at 1.4 K.ANO_2
While the nature of the magnetic ground states of LiNiO2 and AgNiO2 is still not clear, the FM interaction on the NiO2 plane has been thought to be common for all the layered Ni dioxides with a half-filled state because of the clear magnetic order observed in NaNiO2. In this paper, we present measurements that demonstrate this supposition is incorrect. This is accomplished by investigating the magnetism in Ag2NiO2, a material that can be represented by the chemical formula (Ag2)+Ni3+O2 and hence is expected to have a NiO2 plane that has properties identical to the above three layered nickel dioxides. However, in Ag2NiO2, static AF order, likely the formation of an incommensurate AF structure in the NiO2 plane, is observed instead.
Disilver nickel dioxide Ag2NiO2 is a rhombohedral system with space group ( nm and nm for the hexagonal unit-cell) A2NO_1 that was found to exhibit two transitions at =260 K and =56 K by resistivity and measurements, while the symmetry remains rhombohedral down to 5 K.A2NO_3 Interestingly, Ag2NiO2 shows metallic conductivity down to 2 K probably due to a quarter-filled Ag 5 band, as in the case of Ag2F.A2F_1 Very recently, Yoshida et al. proposed the significance of the AF interaction in the NiO2 plane from the measurement.A2NO_3
II Experimental
A powder sample of Ag2NiO2 was prepared at the ISSP of the University of Tokyo by a solid-state reaction technique using reagent grade Ag2O and NiO powders as starting materials. A mixture of Ag2O and NiO was heated at 550oC for 24 h in oxygen under a pressure of 70 MPa. A more detailed description of the preparation and characterization of the powder is presented in Ref. A2NO_3, .
Susceptibility () was measured using a superconducting quantum interference device (SQUID) magnetometer (mpms, Quantum Design) in the temperature range between 400 and 5 K under magnetic field 55 kOe. For the SR experiments, the powder was pressed into a disk of about 20 mm diameter and thickness 1 mm, and subsequently placed in a muon-veto sample holder. The SR spectra were measured on the M20 surface muon beam line at TRIUMF. The experimental setup and techniques were described elsewhere.SDW_2
III Results and Discussion
III.1 Below
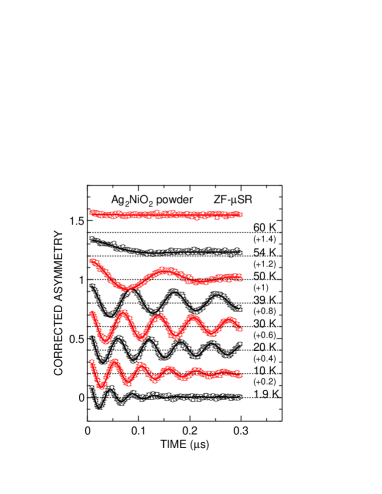
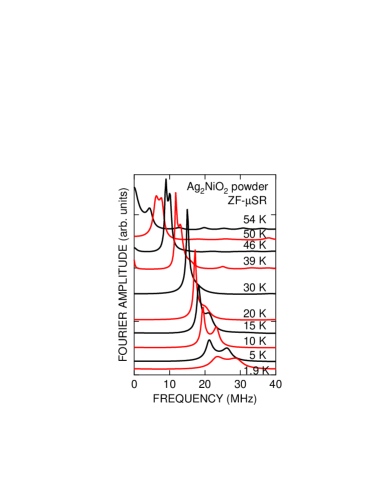
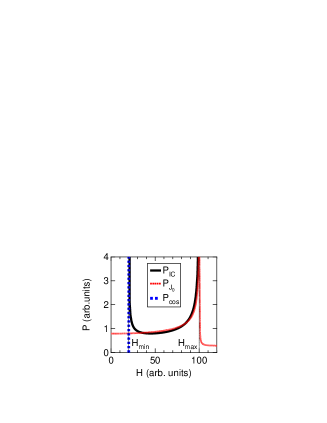
Figure 1 shows zero-field (ZF-)SR time spectra in the range between 1.9 K and 60 K for a powder sample of Ag2NiO2. A clear oscillation due to quasi-static internal fields is observed below 54 K, unambiguously establishing the existence of long-range magnetic order in the sample. Interestingly, as is decreased from 60 K, the relaxation rate first decreases down to 20 K and then increases as is lowered further. By contrast, the average oscillation frequency increases monotonically down to 1.9 K. This implies that the distribution of at 54 K and 20 K is larger than that at 20 K54 K.
This is further established by the dependence of the Fourier Transform of the ZF-SR time spectrum shown in Fig. 2. Note that there is clearly line broadening below 20 K as well as above 54 K. The line-broadening above 54 K is reasonably explained by critical phenomena in the vicinity of =56 K; however, it is difficult to understand the origin of the line-broadening below 20 K using a classical AF model without invoking the presence of an additional magnetic transition. Furthermore, even the spectrum at 30 K, which is the sharpest FFT measured, consists of a main peak at 14 MHz and a shoulder around 16 MHz, suggesting a wide distribution of in Ag2NiO2.
We therefore use a combination of three signals to fit the ZF-SR time spectrum:
| (1) | |||||
| (2) | |||||
| (3) |
where is the empirical maximum muon decay asymmetry, , and are the asymmetries associated with the three signals, is a zeroth-order Bessel function of the first kind that describes the muon polarization evolution in an incommensurate spin density wave (IC-SDW) field distribution,SDW_2 and .
Although is widely used for fitting the ZF-SR spectrum in an IC-SDW state, it should be noted that only provides an approximation of the generic IC magnetic field distribution. This is because the lattice sum calculation of the dipole field at the muon site () due to an IC magnetic structure lies in a plane and traces out an ellipse. The half length of the major axis of the ellipse corresponds to , whereas half of the minor axis corresponds to . As a result, the IC magnetic field distribution is generally given by;
| (4) |
The distribution diverges as approaches either or (see Fig. 3). describes the field distribution very well except in the vicinity of , and the value of should be interpreted as an accurate measure of . However, provides no information on . Hence, the first term is added in Eq. (3) to account for the intensity around and to determine the value of (= ) Andreica_1 ( is the muon gyromagnetic ratio and =13.55342 kHz/Oe). In other words, only when =0, Eq. (4) is well approximated by . Here it should be emphasized that SR spectra are often fitted in a time domain, i.e. not by Eq. (4) but by Eq. (3), since information on all the parameters such as , , and are necessary to discuss the magnetic nature of the sample.
We note that the data can also be well-described using two cosine oscillation signals, with =-5410o below . The delay is physically meaningless, implying that the field distribution fitted by a cosine oscillation, i.e. a commensurate does not exist in Ag2NiO2.SDW_2 Furthermore, as decreases from 54 K, () decreases (increases) linearly with from 0.15 (0) at 54 K to 0 (0.15) at 1.9 K. In order to explain the and curves, one would need to invoke the existence of two muon sites, and a situation whereby the population of at each site is changing in proportion to . Such behavior is very unlikely to occur at low . Hence, we believe that our data strongly suggests the appearance of an IC-AF order in Ag2NiO2 below , as predicted by the calculation using a Mott-Hubbard model (discussed later). Such a conclusion is also consistent with the fact that the paramagnetic Curie temperature is -33 K estimated from the curve below 260 K.A2NO_3
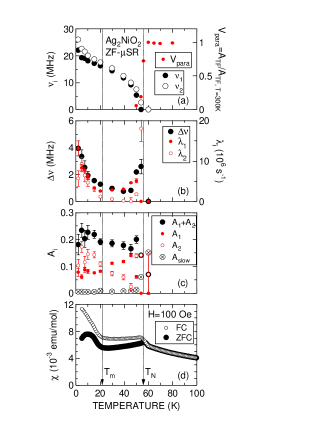
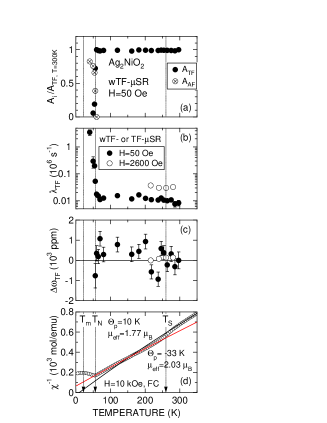
Figures 4(a) - 4(d) show the dependence of the muon precession frequencies (=), the volume fraction of the paramagnetic phases (), , , , the asymmetries +, , , , and for the powder sample of Ag2NiO2. Here, is estimated from the weak transverse field (wTF-) SR experiment described later. In agreement with the FFTs shown in Fig. 3, as is decreased from 60 K, appears at 54 K. It then increases monotonically with decreasing down to around 20 K, and then increases more rapidly upon further cooling. The curve exhibits a similar behavior to that observed for . It is noteworthy that as is decreased from 80 K, the curve shows a sudden drop down to at , indicating that the whole sample enters into an IC-AF state.
As decreases from , , which measures the distribution of in the IC-AF phase, rapidly decreases down to 0.8 MHz at 40 K, then seems to level off the lowest value down to 20 K and then increases with increasing slope (d/d) until it reaches 4 MHz at 1.9 K. The overall dependence of is similar to that of . This behavior is expected since a large naturally implies a more inhomogeneous field distribution— i.e, an increased flattening of the ellipse that enhances . The asymmetry of the IC magnetic phase, +, also increases monotonically with decreasing , although a small jump likely exists around 20 K. The existence of a significant underscores the inappropriateness of fitting the ZF-SR data with only a term. In fact, note that above 20 K, suggesting that the IC-AF order develops/completes below 20 K. This is consistent with the rapid increases in and below 20 K, as described above.
The behavior of the muon parameters is quite consistent with the curve, which exhibits a sudden increase in the slope (d/d) below 22 K(=) with decreasing . Note the curve measured under conditions starts to deviate from that measured in the configuration below , suggesting the development of a ferro- or ferrimagnetic component probably due to a canted spin structure.NNO_2
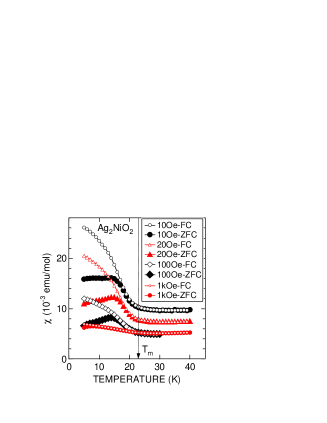
The ferro- or ferrimagnetic behavior is however observed only at low , although the cusp at is clearly seen with =100 - 10 kOe (see Figs. 4(d) and 6(d)). Below , increases with decreasing , while the slope is suppressed by increasing (see Fig. 5). Keeping in mind that SR is insensitive to magnetic impurities, we conclude that Ag2NiO2 undergoes a transition from a paramagnetic to an IC-AF state at =56 K and then to a slightly different ordered state at 22 K.
It is worth contrasting the current SR results on Ag2NiO2 with those in related compounds NaNiO2 and AgNiO2. The ZF-SR spectrum on a powder sample of NaNiO2 consists of two signals below 20 K): an exponentially relaxing cosine oscillating signal (same as the first term in Eq. (3)) as the predominant component and a minor signal described by an exponential relaxation.NNO_3 This indicates that the whole NaNiO2 sample enters into a commensurate AF state below , being consistent with the magnetic structure determined by neutron diffraction experiments, i.e., an A-type AF order.NNO_1 ; NNO_2 Interestingly, the value of =64.2 MHz, which corresponds to 0.5 T, is 2.5 times higher than that for Ag2NiO2. The muon site in NaNiO2 is assigned to the vicinity of the O ions,NNO_3 and is thought to be also reasonable for the other layered nickel dioxides. The differences between the SR results on NaNiO2 and Ag2NiO2 hence suggest that the magnetic structure of Ag2NiO2 is most unlikely to be an A-type AF. Furthermore, there are no indications for additional transitions of NaNiO2 below by , SR and neutron diffraction measurements.NNO_1 ; NNO_2 ; NNO_3
In AgNiO2, the primary ZF-SR signal is one that exponentially relaxes down to the lowest (3 K). Below (=28 K), three minor oscillating components appear. These have small amplitudes and correspond to internal fields from 0.2 to 0.33 T (27 - 45 MHz).ANO_2 The comparison between AgNiO2 and Ag2NiO2 indicates that the interlayer separation () enhances the static magnetic order in the NiO2 plane. It is highly unlikely that the AF interaction through the double Ag2 layer is stronger than that through the single Ag layer, since =0.801 nm for Ag2NiO2A2NO_1 and 0.612 nm for AgNiO2.ANO_1
Our results therefore suggest that the AF order exists in the NiO2 plane, in contrast to the situation in NaNiO2. Assuming the AF interaction is in the NiO2 plane, an IC- spiral SDW phase is theoretically predicted to appear in a half-filled 2DTL2DTL_1 (calculated using the Hubbard model within a mean field approximation with , where is the Hubbard on-site repulsion and is the nearest-neighbor hopping amplitude). In order to further establish the magnetism in Ag2NiO2, it would be interesting to carry out neutron diffraction experiments to determine the magnetic structure below and below .
We wish here to mention that if the valence state of the Ni ion in the NiO2 plane can be varied for Ag2NiO2, the resultant phase diagram should serve as an interesting comparison with that of CoO2 (=alkali elements) with 0.5. Unlike LixNiO2, (Ag2)-deficient samples are currently unavailable, probably because of the metal-like Ag-Ag bond in the disilver layer.A2NO_1 A partial substitution for Ag2 by other cations has thus far also been unsuccessful for reasons unknown.
III.2 Near
In order to elucidate the magnetic behavior above , in particular near =260 K, we carried out weak transverse field (wTF-) SR measurements up to 300 K. The wTF-SR spectrum was fitted by a combination of a slowly and a fast relaxing precessing signal; the former is due to the external field and the latter due to the internal AF field (same as the first term in Eq. (3));
| (5) | |||||
| (6) |
where and are the muon Larmor frequencies corresponding to the applied weak transverse field and the internal AF field, and are the initial phases of the two precessing signals and and ( = TF and AF) are the asymmetries and exponential relaxation rates of the two signals. Note that we have ignored the term in Eq. (6) since we are primarily interested in the magnetic behavior above .
The results are shown in Fig. 6 together with . Besides the transition at 56 K, there are no anomalies up to 300 K in the normalized asymmetries, the relaxation rate () or the shift of the muon precession frequency (). Transverse field (TF-) SR measurements at =2600 Oe, which should be about 50 times more sensitive to frequency shifts than the wTF measurements, show no obvious changes in at either. On the other hand, the curve exhibits a clear change in slope at . Above 60 K, the normalized wTF-asymmetry () levels off to its maximum value — i.e. the sample volume is almost 100% paramagnetic. This therefore suggests that is induced by a purely structural transition and there is no dramatic change in the spin state of Ni ions; that is, is unlikely to be a cooperative JT transition. This is consistent with the fact that the crystal structure remains rhombohedral down to 5 K.A2NO_3
IV Summary
Positive muon spin rotation/relaxation (SR) spectroscopy has been used to investigate the magnetic properties of a powder sample of Ag2NiO2 in the temperature range between 1.9 and 300 K. Zero field SR measurements suggest the existence of an incommensurate antiferromagnetic (AF) order below =56 K. An additional transition was also found at =22 K by both SR and susceptibility measurements.
The current results, when compared to the results in AgNiO2, indicate that magnetism in the half-filled 2DTL of the NiO2 plane is strongly affected by the interlayer distance. In other words, the ground state of the half-filled NiO2 plane is not a ferromagnetic (FM) ordered state or an FM spin-liquid or spin-glass, but is instead an AF frustrated system. The FM behavior in NaNiO2 is therefore thought to be induced by a Jahn-Teller induced trigonal distortion.
Acknowledgements.
This work was performed at TRIUMF. We thank S.R. Kreitzman, B. Hitti, D.J. Arseneau of TRIUMF for help with the SR experiments. JHB is supported at UBC by CIAR, NSERC of Canada, and at TRIUMF by NRC of Canada. KHC is supported by NSERC of Canada.References
- (1) K. Takada, H. Sakurai, E. Takayama-Muromachi, F. Izumi, R. A. Dilanian, and T. Sasaki, Nature 422, 53 (2003).
- (2) Y. Kitaoka, T. Kobayashi, A. Koda, H. Wakabayashi, Y. Niino, H. Yamakage, S. Taguchi, K. Amaya, K. Yamaura, M. Takano, A. Hirano, and R. Kanno, J. Phys. Soc. Jpn. 67, 3703 (1998).
- (3) T. Chatterji, W. Henggeler, and C Delmas, J. Phys.: Condens. Matter 17, 1341 (2005).
- (4) C. Darie, P. Bordet, S. de Brion, M. Holzapfel, O. Isnard, A. Lecchi, J. E. Lorenzo, and E. Suard, Eur. Phys. J. B 43, 159 (2005).
- (5) M. J. Lewis, B. D. Gaulin, L. Filion, C. Kallin, A. J. Berlinsky, H. A. Dabkowska, Y. Qiu, and J. R. D. Copley, Phys. Rev. B 72, 014408 (2005).
- (6) P. J. Baker, T. Lancaster, S. J. Blundell, M. L. Brooks, W. Hayes, D. Prabhakaran, and F. L. Pratt, Phys. Rev. B 72, 104414 (2005).
- (7) Y. J. Shin, J. P.Doumerc, P.Dordoe, C. Delmas, M. Pouchard, and P. Hagenmuller, J. Solid State Chem. 107, 303 (1993).
- (8) H. Kikuchi, H. Nagasawa, M. Mekata, Y. Fudamoto, K. M. Kojima, G. M. Luke, Y. J. Uemura, H. Mamiya, and T. Naka, Hyperfine Interactions 120/121, 623 (1999).
- (9) H. Meskine, and S. Satpathy, Phys. Rev. B 72, 224423 (2005).
- (10) M. Schreyer, and M. Jansen, Angew. Chem. 41, 643 (2002).
- (11) H. Yoshida, Y. Muraoka, T. Sörgel, M. Jansen, and Z. Hiroi, Phys. Rev. B 73, 020408(R) (2006).
- (12) K. Andres, N. A. Kuebler, and M. B. Robin, J. Phys. Chem. Solids 27, 1747 (1966).
- (13) G. M. Kalvius, D. R. Noakes, and O. Hartmann, Handbook on the Physics and Chemistry of Rare Earths edited by K. A. Gschneidner Jr., L. Eyring, and G. H. Lander, (North-Holland, Amsterdam, 2001) vol. 32, chap. 206.
- (14) G.M. Kalvius, D.R. Noakes, A. Kratzer, K.H. Münch, R. Wäppling, H. Tanaka, T. Takabatake, and R.F. Kiefl, Physica B 206-207, 205 (1995).
- (15) D. Andreica, PhD Thesis, IPP/ETH-Zurich 2001.
- (16) H. R. Krishnamurthy, C. Jayaprakash, S. Sarker, and W. Wenzel, Phys. Rev. Lett. 64, 950 (1990).