A path-integral molecular dynamics simulation of diamond
Abstract
Diamond is studied by path integral molecular dynamics simulations of the atomic nuclei in combination with a tight-binding Hamiltonian to describe its electronic structure and total energy. This approach allows us to quantify the influence of quantum zero-point vibrations and finite temperatures on both the electronic and vibrational properties of diamond. The electron-phonon coupling mediated by the zero-point vibration reduces the direct electronic gap of diamond by 10. The calculated decrease of the direct gap with temperature shows good agreement with the experimental data available up to 700 K. Anharmonic vibrational frequencies of the crystal have been obtained from a linear-response approach based on the path integral formalism. In particular, the temperature dependence of the zone-center optical phonon has been derived from the simulations. The anharmonicity of the interatomic potential produces a red shift of this phonon frequency. At temperatures above 500 K, this shift is overestimated in comparison to available experimental data. The predicted temperature shift of the elastic constant displays reasonable agreement with the available experimental results.
pacs:
63.20.Kr, 81.05.Uw, 63.20.Ry, 05.30.-dI Introduction
Tetrahedral semiconductors such as silicon, germanium or diamond, have served as model materials to study the electronic and vibrational properties of crystals. In particular, the effects of the lattice vibrations on the electronic properties, through the mechanism of electron-phonon coupling, have been experimentally investigated by measuring the temperature dependence of their optical excitation spectra. Cardona (2005) Furthermore, the observation of the dependence of such spectra with isotopic mass has provided detailed information on the electronic properties of these solids. Cardona and Thewalt (2005) Besides the electron-phonon interaction, the anharmonicity of lattice vibrations has been observed by the dependence of the phonon frequencies and line-widths with temperature and isotopic composition. Cardona and Thewalt (2005)
From a theoretical point of view, in spite of the impressive progress of ab initio methods for the investigation of the electronic structure of solids, the atomic nuclei are usually considered either as fixed in their crystallographic positions or by approximating their dynamics with classical mechanics. Car and Parrinello (1985) Thus, the effects of the electron-phonon interactions on electronic properties and the effect of zero-point anharmonicity in the vibrational properties of the lattice are usually neglected in these calculations. As it has been pointed out in Ref. Cardona, 2005, these effects may be even larger that the error assumed in the electronic ab initio calculations.
The electron-phonon interaction in tetrahedral semiconductors has been studied theoretically by perturbation theory. Allen and Cardona (1981); Zollner et al. (1992) Within this approach, the reduction of the direct electronic gap due to zero-point vibrations of the lattice phonons is predicted to be of 0.62 eV in diamond and of 0.06 eV in germanium. Both energy shifts represent roughly a 10 fraction of the corresponding energy gaps, i.e., they are so large that a quantitative description of the electronic structure can not be expected by a theory that neglects such effects. Anharmonic shifts of the phonon modes of diamond and silicon have been determined by combining density-functional perturbation theory with a frozen-phonon approach,Lang et al. (1999) and the results show good agreement with the experimental data available from first-order Raman spectra. Herchen and Cappelli (1991); Schiferl et al. (1997) A review of the current status of lattice-dynamical calculations using density-functional perturbation theory can be found in Ref. Baroni et al., 2001.
The path integral (PI) formulation of statistical mechanics offers an alternative way to study finite temperature properties that are related to the quantum nature of the atomic nuclei. Feynman (1972); Ceperley (1995) Thus, the combination of the path integral formulation with electronic structure methods is an interesting alternative to perturbational approaches for the study of electronic and vibrational properties of solids. An advantage of this approach is that both the electrons and the atomic nuclei are treated quantum mechanically in the framework of the Born-Oppenheimer (BO) approximation, so that anharmonic and temperature effects can be evaluated for both vibrational properties and the electronic structure. This unified scheme has been applied so far to the study of solids and molecules containing light atoms. Marx and Parrinello (1996); Tuckerman et al. (1997); Ramírez et al. (1998); Tachikawa and Shiga (2005); Shiga et al. (2001); Chen et al. (2003); Della Sala et al. (2004); Ohta et al. (2004)
In this paper we present a path integral molecular dynamics study of diamond at temperatures between 100 and 1200 K. The electronic structure has been treated by a non-orthogonal tight-binding (TB) Hamiltonian as a reasonable compromise to reduce the computational cost of deriving the BO surface for the nuclear dynamics. In particular, we are interested in the investigation of electronic properties that are determined by the electron-phonon coupling, as the dependence of the electronic gap with temperature and isotopic mass. Also vibrational properties that depend on the anharmonicity of the interatomic potential will be studied with the help of a linear response approach recently developed within the path integral formalism.Ramírez and López-Ciudad (2001) PI simulations of diamond using effective interaction potentials have been carried out earlier to study structural and thermodynamic properties of this material.Herrero and Ramírez (2001)
This paper is organized as follows. In Sec. II, we describe the computational method and the models employed in our simulations. Our results are presented and discussed in Sec. III, dealing with the direct electronic gap, the vibrational energy of the solid, and the temperature dependence of the frequency of the optical phonon at the center of the Brillouin zone (BZ) and the elastic constant of diamond. In Sec. IV, we present the main conclusions of the paper.
II Computational Method
II.1 Simulation details
The formalism employed here for the quantum treatment of electrons and nuclei is based on the combination of the path integral formulation, to derive properties of the atomic nuclei in thermal equilibrium, with an electronic Hamiltonian to derive the BO energy surface, , as a function of the nuclear configuration . The path integral and electronic structure parts of the resulting algorithm appear as independent blocks, since the only electronic result required for the path integral simulation is the value of the function , and possibly its derivatives with respect to ionic positions. Thus, the combination of path integrals with any chosen electronic Hamiltonian is straightforward. For the present investigation of diamond we have chosen an efficient tight-binding one-electron effective Hamiltonian, based on density functional (DF) calculations.Porezag et al. (1995) The use of a simplified electronic Hamiltonian is a reasonable compromise to explore the efficiency and capability of this unified formalism for the evaluation of electronic and vibrational properties of solids at finite temperatures. The implementation of density functional or Hartree-Fock based self-consistent methods is left for future development. The capability of tight-binding methods to simulate different properties of solids and molecules has been reviewed by Goringe et al.Goringe et al. (1997)
The computational advantage of using the path-integral formulation of statistical mechanics is formulated by the so-called ”quantum-classical” isomorphism. Thus, this method exploits the fact that the partition function of a quantum system is formally equivalent to that of a classical one, obtained by replacing each quantum particle (here, atomic nucleus) by a ring polymer consisting of “beads”, connected by harmonic springs.Gillan (1988); Ceperley (1995); Feynman (1972); Kleinert (1990) In many-body problems, the configuration space of the classical isomorph is usually sampled by Monte Carlo or molecular dynamics (MD) techniques. Here, we have employed the PI MD method, which has been found to require less computer time resources in our problem. Effective algorithms to perform PI MD simulations in the canonical ensemble have been described in detail by Martyna et al.Martyna et al. (1996) and Tuckerman.Tuckerman (2002) All calculations presented here were carried out in the canonical ensemble, using originally developed MD software, which enables efficient PI MD simulations on parallel supercomputers.
Simulations were carried out on a supercell of the diamond face-centered cubic cell with periodic boundary conditions, containing 64 C atoms. The atomic mass of carbon was set to 12 amu. The convergence of the internal energy has been checked for some selected atomic configurations, by considering sets of 1, 4 and 32 points in the BZ of the simulation supercell. The main effect of the point sampling is found to be a constant shift of the internal energy. This systematic error is largely reduced in the calculation of properties obtained as energy differences (e.g., energy shifts as a function of temperature). For this reason, we have chosen to use only the point for the sampling of the BZ of the simulation supercell. A set of 4 points increases the computer time by a factor of 10 with respect to the point sampling, without significant changes of the results presented here.
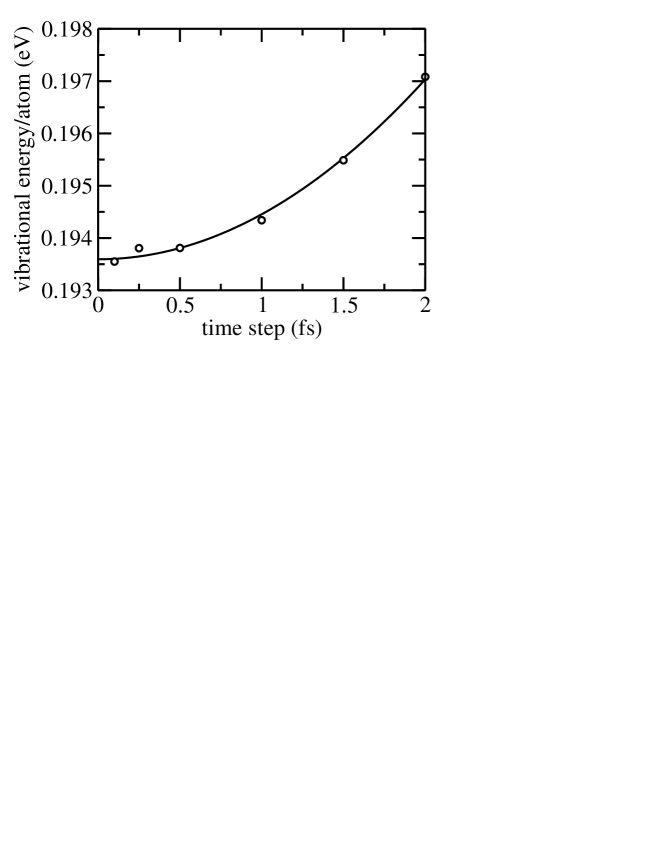
The simulation-cell parameter employed in our calculations is taken from experimental data, and ranged from 7.1330 Å at 100 K to 7.1552 Å at 1200 K.Skinner (1957) For a given temperature, a typical run consisted of MD steps for system equilibration, followed by steps for the calculation of ensemble average properties. To have a nearly constant precision in the path integral results at different temperatures, we have taken a number of beads, (Trotter number), that scales with the inverse temperature such that K. For comparison with the results of our PI MD simulations, we have carried out some classical MD simulations with the same interatomic interaction (setting = 1). The quantum simulations were performed using a staging transformation for the bead coordinates. Chains of four Nosé-Hoover thermostats were coupled to each degree of freedom to generate the canonical ensemble. Tuckerman and Hughes (1998) To integrate the equations of motion we have used the reversible reference system propagator algorithm (RESPA), which allows one to define different time steps for the integration of the fast and slow degrees of freedom.Martyna et al. (1996) For the evolution of the fast dynamical variables, that include the thermostats and harmonic bead interactions, we used a time step , where is the time step associated to the calculation of DF-TB forces. The convergence of the total energy as a function of is shown in Fig. 1. A value of = 0.5 fs is found to provide adequate convergence. We have also explored the convergence of the simulation as a function of the thermostat mass, ,
| (1) |
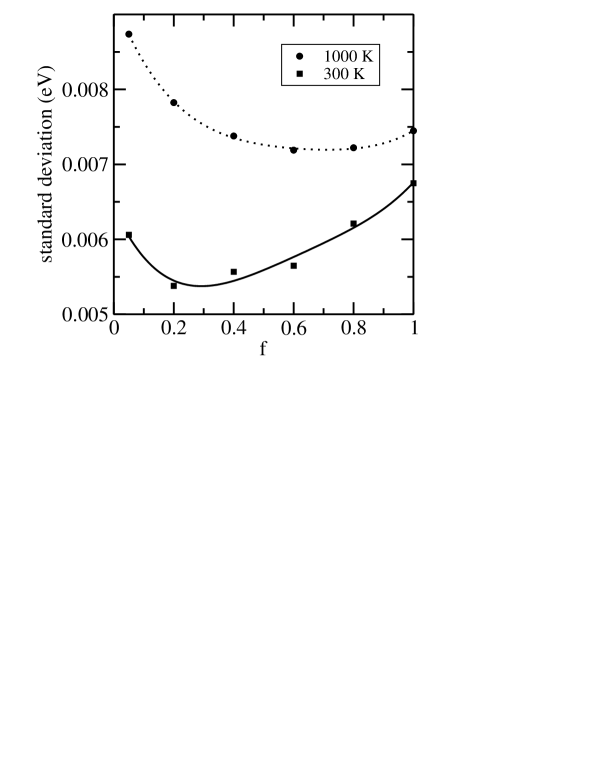
where = is the inverse temperature, and is a scaling factor. The standard deviation of the total energy, as derived from a block analysis,Cao and Berne (1989) is displayed in Fig. 2 at two different temperatures. We observe that at 300 K the standard deviation can be reduced by about 20 by changing the factor from a value of 1 to a value of 0.2. Taking into account that the standard deviation varies with the number of simulation steps, , as , then, for a given threshold accuracy, a simulation run using at 300 K requires 35 less simulation steps than a run using . In the simulations presented below, we have varied the parameter linearly for temperatures between 300 and 1000 K. The values changed from (for K) to (for K).
II.2 Calculation of anharmonic vibrational frequencies
To calculate vibrational frequencies we will employ a method based on the linear response (LR) of the system to vanishingly small forces applied on the atomic nuclei. With this purpose, we consider a LR function, the static isothermal susceptibility , that is readily derived from PI MD simulations of the equilibrium solid, without having to explicitly impose any external forces during the simulation. This approach represents a significant improvement as compared to the standard harmonic (HA) approximation.Ramírez and López-Ciudad (2001) A sketch of the method is given in the following.
Let us call the set of Cartesian coordinates of the beads forming the ring polymers in the simulation cell (). We consider the set of centroid coordinates, with defined as the mean value of coordinate over the corresponding polymer:
| (2) |
Then, the linear response of the quantum system to small external forces on the atomic nuclei is given by the susceptibility tensor , which can be defined in terms of centroid coordinates asRamírez and López-Ciudad (2001)
| (3) |
where = , is the mass of the nucleus associated to coordinate , is the covariance of the centroid coordinates and , and indicates an ensemble average along an MD run.
The tensor allows us to derive a LR approximation to the low-lying excitation energies of the vibrational system, that is applicable even to highly anharmonic situations. The LR approximation for the vibrational frequencies reads
| (4) |
where () are eigenvalues of , and the LR approximation to the low-lying excitation energy of vibrational mode is given by . More details on the method and illustrations of its ability for predicting vibrational frequencies of solids and molecules can be found elsewhereRamírez and López-Ciudad (2001, 2002); López-Ciudad et al. (2003); Ramírez and Herrero (2005). In connection with the vibrational modes that actually appear in our calculations, we note that the application of periodic boundary conditions is physically equivalent to the consideration of lattice vibrations only at the center ( = 0) of the BZ of the employed simulation cell. Modes with violate the periodic boundary conditions, because all atomic images of an atom have distinct displacements, whose amplitude is modulated by both the propagation vector of the vibrational mode and the translational vector of the image. However, periodic boundary conditions implies that all atomic images must display a displacement identical to that one of the atom located in the simulation cell, a condition that is only met if the propagation vector is = 0.Ramírez and Herrero (2005)
II.3 Calculation of one-electron energies
For the sake of clarity, we use the Schrödinger formulation to derive the expectation value of electronic observables. However, the final result is obtained in a form appropriate to the path integral formulation. Within the adiabatic Born-Oppenheimer approximation,Fischer (1989) the total wave function is written as
| (5) |
where are the electronic and nuclear coordinates, labels the nuclear wave function, and represents the electronic ground state configuration, which depends parametrically on . Let us call the energy of the state . Then, the canonical partition function, , is defined as
| (6) |
We consider an electronic observable represented by the operator , that is a function of the electronic coordinates and depends parametrically on . Its canonical average, , is defined as
| (7) |
Now, we write this equation in an alternative way, better adapted to the path integral formulation. First, the function is defined as the expectation value of the operator over the electronic wave function,
| (8) |
The second definition is the funtion , representing the diagonal elements of the normalized canonical density matrix for the nuclear coordinates,
| (9) |
Considering the factorization of in Eq. (5), and using the last two definitions, we can rewrite the average in Eq. (7) as
| (10) |
The last equation shows that electronic observables, , are obtained as ensemble averages over the nuclear configurations, , accessible in thermal equilibrium. This equation can be readily used in combination with the path integral sampling of the density matrix . We will apply it to calculate the canonical average, , of the -th energy eigenvalue of the electronic Hamiltonian. For convenience, let us define the following probability density for the one-electron state ,
| (11) |
where is the Dirac delta function. can be easily accumulated during a PI MD simulation. The expectation value, , as given by Eq. (10), can now be written as the first moment of the distribution
| (12) |
The direct electronic gap of diamond is derived as
| (13) |
where and are the one-electron states associated with the bottom of the conduction band and the top of the valence band at the reciprocal point .
III Results and Discussion
In this section we present the main results derived from our PI MD simulations of diamond as a function of temperature. Whenever possible we will compare the simulation results to available experimental data. Results concerning the electronic and vibrational properties are presented in the next subsections.
III.1 Electronic properties
III.1.1 One-electron states
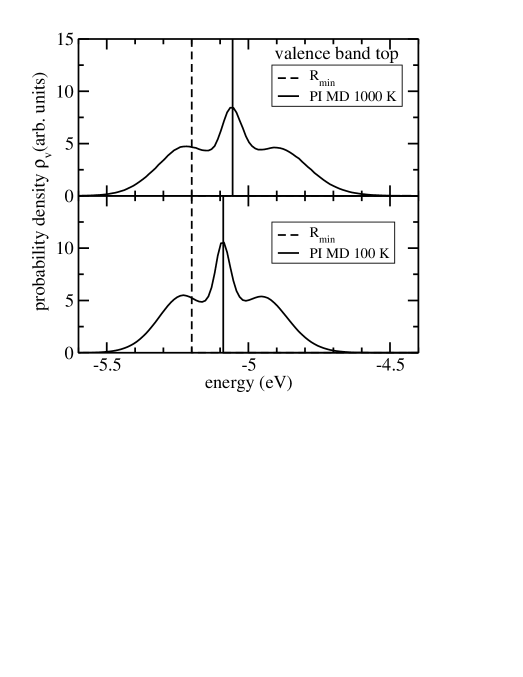
The top of the valence band, , for a diamond crystal with the atoms fixed in their crystallographic positions, , is three-fold degenerate. Each of these three one-electron levels leads to identical probability densities, , as defined in Eq. (11). The function , derived from our PI MD simulations, is represented in Fig. 3 at two temperatures, 100 and 1000 K. The probability density shows three distinct maxima reflecting that the underlying electronic state is three-fold degenerate. In each case, the continuous vertical line displays the expectation value of the valence band top, , defined as the first moment of the distribution [see Eq. (12)]. The temperature effect in is a shift of 0.03 eV toward higher energies, when the temperature increases from 100 K to 1000 K. This shift is a consequence of the different magnitude of the electron-phonon interaction at both temperatures (longer atomic displacements at higher ). The dotted line in the figure represents the energy of the top of the valence band, , for a crystal with atoms fixed at their equilibrium positions and cell parameter set to the equilibrium value at K ( Å). The PI MD simulation predicts that at 100 K the top of the valence band is shifted by 0.11 eV with respect to the result obtained for the configuration.
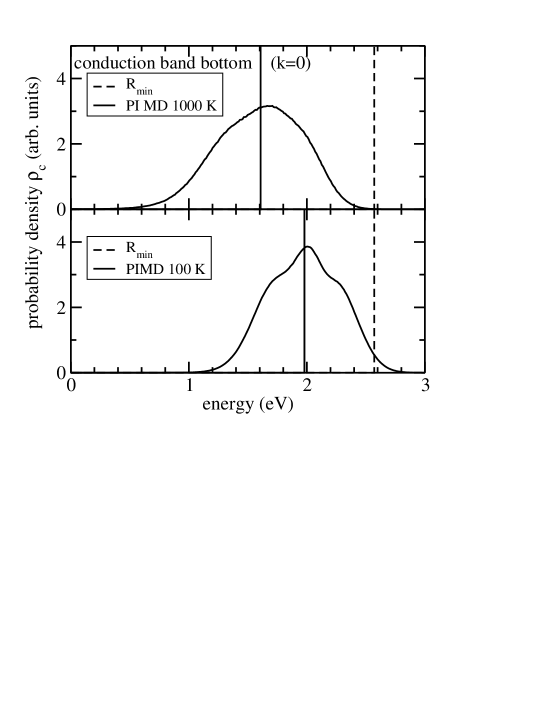
In Fig. 4 we present the results corresponding to the one-electron state , i.e., the conduction band bottom at the reciprocal point . The energy shifts found for as a consequence of the electron-phonon interaction are larger and of opposite sign as those encountered for the valence band. At 100 K we observe a downwards shift of by about -0.59 eV with respect to the configuration. The temperature shift in amounts to -0.37 eV between 100 and 1000 K.
III.1.2 Direct electronic gap
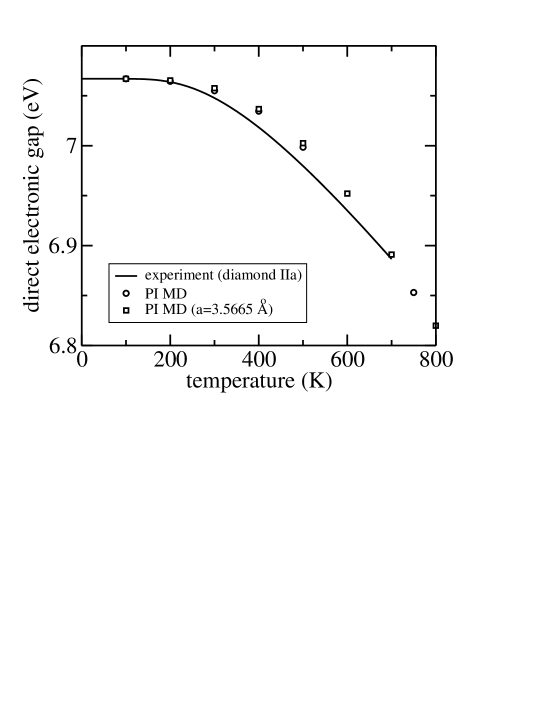
The first direct gap, , of diamond has been portrayed in Fig. 5 as a function of temperature. The open circles have been derived from PI MD simulations where the thermal expansion of the crystal lattice has been taken into account by varying the value of the cell parameter . Open squares are PI MD results derived at different temperatures with a cell parameter fixed at the equilibrium value at 100 K. We note that the effect of the thermal expansion on the electronic gap is a slight reduction of the gap. The temperature dependence of the electronic gap predicted by our PI MD simulations is in reasonable agreement with the experimental results reported in Ref. Logothetidis et al., 1992 for diamond IIa up to 700 K, based on measurements of the complex dielectric function by spectroscopic ellipsometry. The slope of the simulation results at temperatures above 500 K is larger than that of the experimental data. A possible reason for this behavior is an overestimation of anharmonic effects by the DF-TB potential model. Although we expected a reasonable agreement between experimental and theoretical results at low , the coincidence shown in Fig. 5 for the absolute value of the first direct gap is fortuitous. In fact, the displayed experimental values, derived from first-derivative line-shape analysis of the complex dielectric function, are shifted by about 0.07 eV toward higher energies, in case that they are obtained by second-derivative line-shape analysis.Logothetidis et al. (1992)
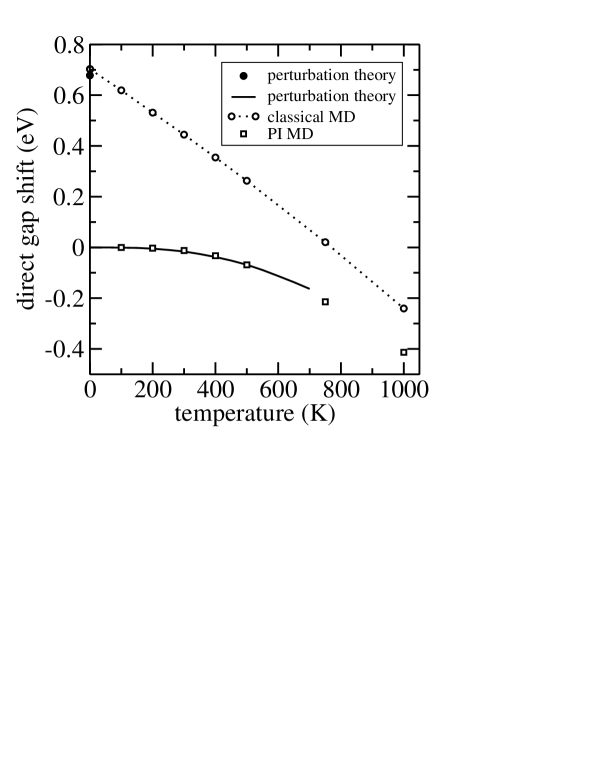
To quantify the influence of nuclear quantum effects on the value of the direct electronic gap of diamond we have performed a series of classical MD simulations as a function of temperature. The shifts of the energy gap obtained in the classical simulations are compared to the PI MD results in Fig. 6. The most prominent quantum effect appears in the low temperature limit as a consequence of the zero-point vibration. The renormalization of amounts to 0.7 eV at . This value agrees well with the perturbational treatment of the electron-phonon coupling in Ref. Zollner et al., 1992, whose result is represented by a closed circle in Fig. 6. We stress that the zero-point renormalization of amounts to about 10 of its value. The PI MD results show satisfactory agreement with the perturbation theory data available up to 700 K.Zollner et al. (1992) The main discrepancy found between both sets of results is that the slope at temperatures above 500 K is larger for PI MD than for perturbation theory. The overestimation of anharmonic effects by the DF-TB model is a probable explanation for this behavior. Differences between the quantum and classical results for are significant in the whole studied temperature range. In particular, at room temperature the classical result deviates from the PI MD data by about 0.45 eV.
We have calculated the shift of the direct electronic gap of diamond as a function of the isotopic mass at 300 K. The calculated energy gap for 12C amounts to 7.054 eV. For 13C, this gap increases to 7.081 eV at the same temperature. The isotopic effect of 27 meV at 300 K is in reasonable agreement to the value reported in Ref. Zollner et al., 1992 of 22 meV, based on perturbation theory in the zero temperature limit.
III.2 Vibrational Properties
III.2.1 Vibrational energy
The vibrational energy of the simulation cell of diamond, as derived by the PI MD simulations, is presented as a function of temperature in Fig. 7 (solid circles). The zero of the energy scale corresponds to a diamond crystal with fixed atoms and with the cell parameter fixed at the equilibrium value at 100 K. The thermal occupation of excited vibrational states is evident in Fig. 7 by the increase of the vibrational energy with temperature. To quantify the anharmonic effect on the vibrational energy of the crystal, we have plotted in Fig. 7 the harmonic vibrational energy (solid diamonds). The set of harmonic frequencies has been derived by diagonalizing the dynamic matrix in a simulation cell with the experimental equilibrium lattice parameter at each temperature. At the lowest studied temperature the harmonic result deviates from the PI MD value by about 0.1 eV, which amounts to about 0.8 % of the total vibrational energy. This error of the harmonic approximation is a consequence of the anharmonicity of the phonon vibrations.
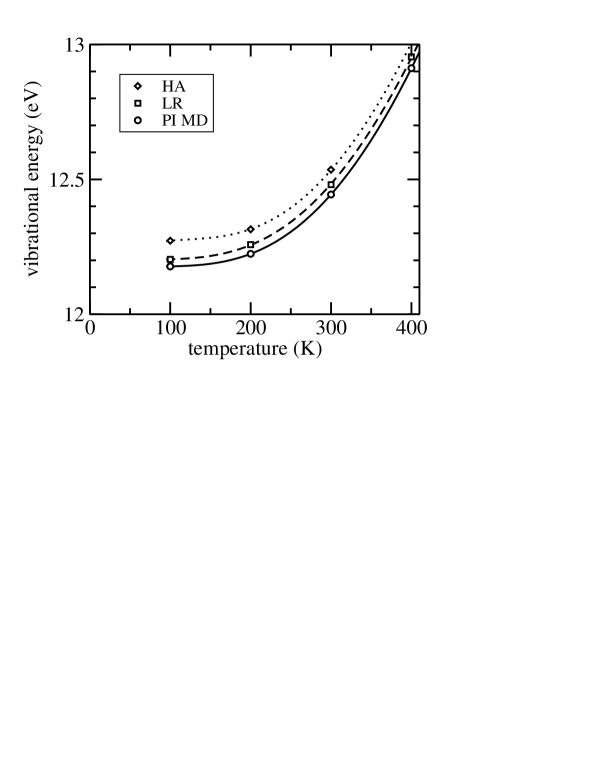
The set of anharmonic vibrational frequencies, , derived by our linear response approach, are expected to represent an improved description of the vibrational problem. Thus, we have recalculated the harmonic vibrational energy by considering as a set of renormalized phonon frequencies. The result is shown as open squares in Fig. 7. Most of the error of the harmonic approximation is corrected by the LR frequencies. At low temperatures the absolute error of the improved estimation of the vibrational energy amounts to 0.03 eV, i.e., about 0.2 % of the PI MD result. Our conclusion from this comparison is that the set of LR frequencies provides a consistent description of anharmonic effects in the employed DF-TB model, in line with previous results of vibrational properties on molecular and solid state systems.Ramírez and López-Ciudad (2001); López-Ciudad et al. (2003); Ramírez and Herrero (2005) In the following, we focus on the study of two particular LR phonons that can be compared to available experimental data.
III.2.2 Optical phonon at
The highest energy phonon of the diamond crystal is the optical phonon at the center of the BZ (). At 200 K, the LR wavenumber of this phonon amounts to 1396 5 cm-1. The harmonic result, obtained for the equilibrium cell parameter at this temperature, is 1407 cm-1. The difference between the LR and harmonic result is a consequence of the anharmonicity of the interatomic potential that induces a slight softening in the phonon frequency. The optical phonon wavenumber of diamond in the zero temperature limit is found in the first-order Raman spectrum at 1335 cm-1.Herchen and Cappelli (1991) The DF-TB potential overestimates the experimental wavenumber by about 61 cm-1. This error is lower than that found in other tight-binding parametrizations.Wang et al. (1990); Kopidakis et al. (1997)
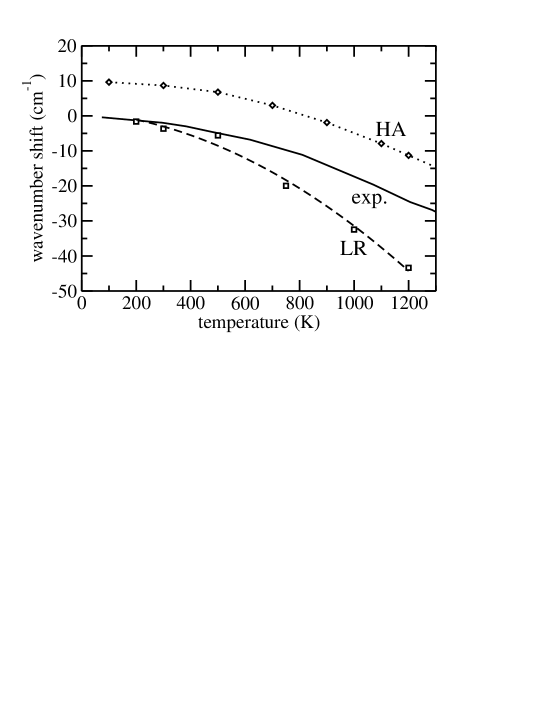
The relative shift of the optical phonon in diamond is presented as a function of temperature in Fig. 8. The comparison between the harmonic and LR results shows that anharmonic effects lead to a softening of the phonon mode in the studied temperature range up to 1200 K. The LR results deviate from the experimental data at temperatures above 500 K. This deviation shows that the anharmonicity of the optical phonon is overestimated by the DF-TB Hamiltonian at those temperatures. We have previously commented on the enhanced anharmonicity of the DF-TB model in relation to the decrease of the direct electronic gap at temperatures above 500 K.
III.2.3 Elastic constant c44
The lowest energy phonon, , determined by either the LR or HA approximations is 12-fold degenerated in the employed simulation cell. The wave vector, , of this phonon state has been identified as the midpoint between and points along the [100] direction in reciprocal space, with coordinates . This means that the phonon corresponds to the transverse acoustic (TA) branch. The identification of the wave vector of has been possible by solving the dynamical matrix at some selected points of the BZ of the primitive unit cell of diamond. The phonon velocity, , along the TA branch, , is defined as the slope of the dispersion branch at the origin,
| (14) |
In this equation, is the modulus of the wave vector associated to the phonon . The constant corrects, for the case of the HA approximation, the finite difference error encountered by using the finite vector to calculate the slope at the origin. The elastic constant can be derived from by the relation
| (15) |
where is the density of the diamond crystal.
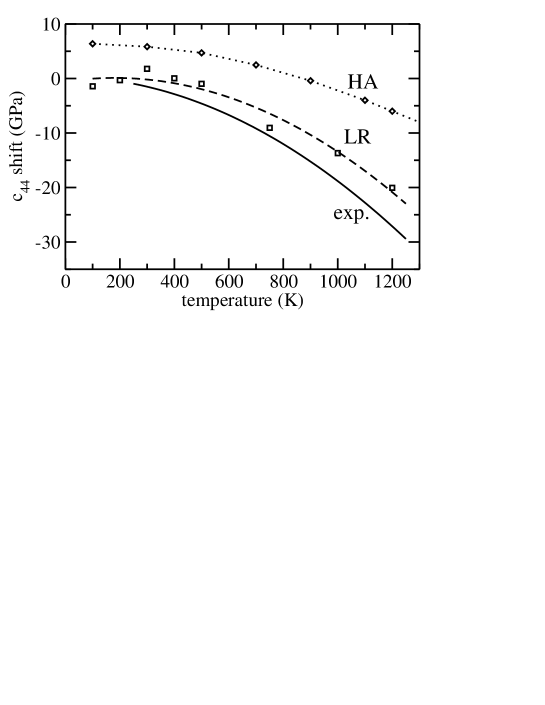
Using the harmonic value of at 200 K we obtain with Eqs. (14) and (15) a value for of 551 GPa. The estimation of the elastic constant using the LR wavenumber, , in Eq. (14) is of 545 GPa. The experimental result derived from Brillouin scattering amounts to 576 GPa.Zouboulis et al. (1998) The shift of the elastic constant with temperature is plotted in Fig. 9. The comparison of the LR and harmonic results shows that anharmonic effects cause a reduction of the value of the elastic constant in the whole studied temperature range. The comparison to the experimental data shows that the DF-TB model gives a reasonable prediction of the temperature shift of the elastic constant, even though there appears a systematic underestimation of this shift.
IV Conclusions
The simulations presented here for diamond are based on the treatment of electrons and nuclei as quantum particles in the framework of the Born-Oppenheimer approximation. The use of the path integral formulation for the atomic nuclei allows us to obtain the vibrational and electronic properties of the solid at finite temperatures. We have chosen a simplified electronic Hamiltonian to develop the algorithms required for the simulation of solid state systems, but this limitation should be eliminated in the future by the implementation of improved electronic structure methods.
The temperature and isotopic dependence of the first direct gap of diamond predicted by our PI MD simulation shows good agreement with the available experimental results, based on spectroscopic ellipsometry,Logothetidis et al. (1992) and theoretical results, based on perturbation theory.Zollner et al. (1992) Thus, the employed simulation model has demonstrated its capability to realistically describe electronic properties that are determined by electron-phonon interactions. The effect of the zero point vibrations of the lattice phonons of diamond in its first direct gap is a reduction of the gap by about 0.7 eV. This effect is so large that any theoretical approach aiming at a quantitative determination of the electronic gap of diamond can not be based only on an improved solution of the many-body electronic problem, but it should also include the treatment of the electron-phonon coupling.
Anharmonic effects in the lattice vibrations have been derived by a linear response approach based on the path integral formulation. This approach allows us to derive anharmonic vibrational frequencies from the study of spatial correlations in the displacements of the vibrating nuclei in the simulation cell. Anharmonic effects are responsible for a reduction of the vibrational energy of the solid of about 1 %, with respect to the result predicted by a harmonic approximation. The temperature shift of the optical phonon at is larger that the experimental result determined by Raman spectroscopy.Herchen and Cappelli (1991) We consider that this limitation is a consequence of the parametrization of the employed DF-TB one-electron Hamiltonian,Porezag et al. (1995) that overestimates the anharmonicity of the highest frequency phonon of the lattice. Better agreement is found in the comparison of the elastic constant derived from the simulations with the experimental values obtained by Brillouin scattering.Zouboulis et al. (1998)
We plan to extend our simulations to more complex systems like hydrogen impurities in diamond,Herrero et al. where the presence of light impurities should strengthen further the influence of quantum nuclear effects in the electronic and vibrational properties of the lattice.
Acknowledgements.
The calculations presented here were performed at the Barcelona Supercomputing Center (BSC-CNS). This work was supported by CICYT through Grant No. BFM2003-03372-C03-03 and by CAM through project S-0505/ESP/000237. ERH thanks DURSI (regional government of Catalonia) for funding through project 2005SGR683.References
- Cardona (2005) M. Cardona, Solid State Commun. 133, 3 (2005).
- Cardona and Thewalt (2005) M. Cardona and M. L. W. Thewalt, Rev. Mod. Phys. 77, 1173 (2005).
- Car and Parrinello (1985) R. Car and M. Parrinello, Phys. Rev. Lett. 55, 2471 (1985).
- Allen and Cardona (1981) P. B. Allen and M. Cardona, Phys. Rev. B 23, 1495 (1981).
- Zollner et al. (1992) S. Zollner, M. Cardona, and S. Gopalan, Phys. Rev. B 45, 3376 (1992).
- Lang et al. (1999) G. Lang, K. Karch, M. Schmitt, P. Pavone, A. P. Mayer, R. K. Wehner, and D. Strauch, Phys. Rev. B 59, 6182 (1999).
- Herchen and Cappelli (1991) H. Herchen and M. A. Cappelli, Phys. Rev. B 43, 11740 (1991).
- Schiferl et al. (1997) D. Schiferl, M. Nicol, J. M. Zaug, S. K. Sharma, T. F. Cooney, S. Y. Wang, T. R. Anthony, and J. F. Fleischer, J. Appl. Phys. 82, 3256 (1997).
- Baroni et al. (2001) S. Baroni, S. de Gironcoli, and A. D. Corso, Rev. Mod. Phys. 73, 515 (2001).
- Feynman (1972) R. P. Feynman, Statistical Mechanics (Addison-Wesley, New York, 1972).
- Ceperley (1995) D. M. Ceperley, Rev. Mod. Phys. 67, 279 (1995).
- Tuckerman et al. (1997) M. E. Tuckerman, D. Marx, M. L. Klein, and M. Parrinello, Science 275, 817 (1997).
- Shiga et al. (2001) M. Shiga, M. Tachikawa, and S. Miura, J. Chem. Phys. 115, 9149 (2001).
- Tachikawa and Shiga (2005) M. Tachikawa and M. Shiga, Chem. Phys. Lett. 407, 135 (2005).
- Chen et al. (2003) B. Chen, I. Ivanov, M. L. Klein, and M. Parrinello, Phys. Rev. Lett. 91, 215503 (2003).
- Della Sala et al. (2004) F. Della Sala, R. Rousseau, A. Görling, and D. Marx, Phys. Rev. Lett. 92, 183401 (2004).
- Ohta et al. (2004) Y. Ohta, K. Ohta, and K. Kinugawa, J. Chem. Phys. 121, 10991 (2004).
- Ramírez et al. (1998) R. Ramírez, E. Hernández, J. Schulte, and M. C. Böhm, Chem. Phys. Lett. 291, 44 (1998).
- Marx and Parrinello (1996) D. Marx and M. Parrinello, Science 271, 179 (1996).
- Ramírez and López-Ciudad (2001) R. Ramírez and T. López-Ciudad, J. Chem. Phys. 115, 103 (2001).
- Herrero and Ramírez (2001) C. P. Herrero and R. Ramírez, Phys. Rev. B 63, 024103 (2001).
- Porezag et al. (1995) D. Porezag, T. Frauenheim, T. Köhler, G. Seifert, and R. Kaschner, Phys. Rev. B 51, 12947 (1995).
- Goringe et al. (1997) C. M. Goringe, D. R. Bowler, and E. Hernández, Rep. Prog. Phys. 60, 1447 (1997).
- Gillan (1988) M. J. Gillan, Phil. Mag. A 58, 257 (1988).
- Kleinert (1990) H. Kleinert, Path Integrals in Quantum Mechanics, Statistics and Polymer Physics (World Scientific, Singapore, 1990).
- Martyna et al. (1996) G. J. Martyna, M. E. Tuckerman, D. J. Tobias, and M. L. Klein, Mol. Phys. 87, 1117 (1996).
- Tuckerman (2002) M. E. Tuckerman, in Quantum Simulations of Complex Many–Body Systems: From Theory to Algorithms, edited by J. Grotendorst, D. Marx, and A. Muramatsu (NIC, FZ Jülich, 2002), p. 269.
- Skinner (1957) B. J. Skinner, Am. Mineral. 42, 39 (1957).
- Tuckerman and Hughes (1998) M. E. Tuckerman and A. Hughes, in Classical & Quantum Dynamics in Condensed Phase Simulations, edited by B. J. Berne and D. F. Coker (Word Scientific, New Jersey, 1998), p. 311.
- Cao and Berne (1989) J. Cao and B. J. Berne, J. Chem. Phys. 91, 6359 (1989).
- Ramírez and López-Ciudad (2002) R. Ramírez and T. López-Ciudad, in Quantum Simulations of Complex Many–Body Systems: From Theory to Algorithms, edited by J. Grotendorst, D. Marx, and A. Muramatsu (NIC, FZ Jülich, 2002), pp. 325–375; for downloads and audio–visual Lecture Notes see www.theochem.rub.de/go/cprev.html.
- López-Ciudad et al. (2003) T. López-Ciudad, R. Ramírez, J. Schulte, and M. C. Böhm, J. Chem. Phys. 119, 4328 (2003).
- Ramírez and Herrero (2005) R. Ramírez and C. P. Herrero, Phys. Rev. B 72, 024303 (2005).
- Fischer (1989) G. Fischer, in Vibronic Processes in Inorganic Chemistry, edited by C. D. Flint (Kluwer, Dordrecht, 1989), p. 7.
- Logothetidis et al. (1992) S. Logothetidis, J. Petalas, H. M. Polatoglou, and D. Fuchs, Phys. Rev. B 46, 4483 (1992).
- Wang et al. (1990) C. Z. Wang, C. T. Chan, and K. M. Ho, Phys. Rev. B 42, 11276 (1990).
- Kopidakis et al. (1997) G. Kopidakis, C. Z. Wang, C. M. Soukoulis, and K. M. Ho, J. Phys.: Condens. Matter 9, 7071 (1997).
- Zouboulis et al. (1998) E. S. Zouboulis, M. Grimsditch, A. K. Ramdas, and S. Rodriguez, Phys. Rev. B 57, 2889 (1998).
- (39) C. P. Herrero, R. Ramírez, and E. R. Hernández, Phys. Rev. B, in press.