Present address:] Nano Science and Technology, Sejong University, Seoul, Korea.
Non-thermal origin of nonlinear transport across magnetically induced superconductor-metal-insulator transition
Abstract
We have studied the effect of perpendicular magnetic fields and temperatures on the nonlinear electronic transport in amorphous Ta superconducting thin films. The films exhibit a magnetic field induced metallic behavior intervening the superconductor-insulator transition in the zero temperature limit. We show that the nonlinear transport in the superconducting and metallic phase is of non-thermal origin and accompanies an extraordinarily long voltage response time.
pacs:
74.40.+k, 74.25.Fy, 74.78.-wIn recent years, the suppression of superconductivity in two-dimensions (2D) by means of increasing disorder (usually controlled by film thickness) or applying magnetic fields has been a focus of attention. Conventional treatments Abrahams et al. (1979); Finkelshtein (1987); Larkin (1999); Fisher (1990); Fisher et al. (1990) of electronic transport predict that in 2D the suppression of the superconductivity leads to a direct superconductor-insulator transition (SIT) in the limit of zero temperature (T = 0). This traditional view has been challenged by the observation of magnetic field (B) induced metallic behavior in amorphous MoGe Mason and Kapitulnik (1999, 2002); Ephron et al. (1996) and Ta thin films Qin et al. (2006). The unexpected metallic behavior, intervening the -driven SIT, is characterized by a drop in resistance () followed by a saturation to a finite value as . The metallic resistance can be orders of magnitude smaller than the normal state resistance () implying that the metallic state exists as a separate phase rather than a point in the phase diagram. Despite many theoretical treatments Ephron et al. (1996); Dalidovich and Phillips (2001, 2002); Galitski et al. (2005); Kapitulnik et al. (2001); Das and Doniach (2001); Spivak et al. (2001); Tewari (2004); Ng and Lee (2001), a consensus on the mechanism behind the metallic behavior is yet to be reached. Proposed origins of the metallic behavior include bosonic interactions in the non-superconducting phaseDalidovich and Phillips (2001, 2002), contribution of fermionic quasiparticles to the conductionGalitski et al. (2005); Kapitulnik et al. (2001), and quantum phase fluctuationsDas and Doniach (2001); Spivak et al. (2001).
In a recent paper Qin et al. (2006) on the magnetically induced metallic behavior in Ta films, we have reported the nonlinear voltage-current (-) characteristics that can be used to identify each phase. The superconducting phase is unique in having both a hysteretic - and an “immeasurably” small voltage response to currents below an apparent critical current . The metallic phase can be identified by a differential resistance () that increases with increasing , whereas the insulating phase is identified by a that decreases with increasing . The contrasting nonlinear - in the metallic and insulating phase are shown in Fig. 1(a).
The main purpose of this Letter is to report that the origin of the nonlinear transport, particularly in the superconducting and metallic phase, is not a simple reflection of -dependence of via the unavoidable Joule heating. We describe the effect of and on the nonlinear transport on which this conclusion is based. We also present our studies on dynamic voltage response which reveal strikingly long voltage response times that accompany the nonlinear transport.
Our samples are dc sputter deposited Ta thin films on Si substrates. The sputter chamber is baked at C for several days, reaching a base pressure of 10-8 Torr. The chamber and Ta source were cleaned by pre-sputtering for min at a rate of nm/s. Films are grown at a rate of nm/s at an Ar pressure of mTorr. Using a rotatable substrate holder up to 12 films, each with a different thickness, can be grown without breaking the vacuum. In order to facilitate four point measurements, the samples are patterned into a bridge (1 mm wide and 5 mm long) using a shadow mask. Even though there were noticeable batch to batch variations, the degree of disorder (evidenced by the values of ) for films of the same batch increases monotonically with decreasing film thickness. The superconducting properties of the films are characteristic of homogeneously disordered thin films Goldman and Markovic (1998), and consistent with the results of x-ray structural investigations Qin et al. (2006). The data presented in this paper are from 5 films grown in 4 batches. Parameters of the films are summarized in Table 1.
| sample | batch | |||||
|---|---|---|---|---|---|---|
| Ta 1 | 1 | 3.5 | 0.584 | 1769 | 0.72 | 21 |
| Ta 2 | 1 | 5.0 | 0.675 | 1180 | 0.88 | 19 |
| Ta 3 | 2 | 5.7 | 0.770 | 1056 | 0.9 | 19 |
| Ta 4 | 3 | 5.0 | 0.598 | 770 | - | - |
| Ta 5 | 4 | 36 | 0.995 | 69 | 2.0 | 13 |
The evolution of the - curves across the superconductor-metal boundary at mK is shown in Fig. 1(b) for sample Ta 1. The hysteretic -, unique to the superconducting phase, is indicated by the dashed lines. As is increased, the superconductivity is abruptly quenched at a well-defined critical current . As is decreased from above , the superconductivity suddenly appears at a different current . The hysteresis becomes smaller with increasing , and vanishes near 0.1 T as the system is driven into the metallic phase [solid lines in Fig. 1(b)]. Typical -dependence of at various is shown in Fig. 1(d) for another sample Ta 2. In this sample, which is less disordered than Ta 1, the superconducting phase extends up to 0.2 T [solid lines in Fig. 1(d)] and the metallic behavior is observed at higher up to 0.9 T (dashed lines). Hereafter, “superconducting regime” refers to the transport regime where I-V is hysteretic and “metallic regime” to the regime with nonlinear (and reversible) - with increasing with increasing .
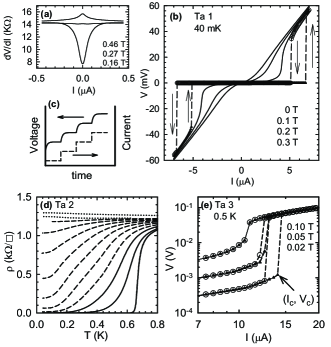
All our - curves are constructed by plotting the steady state voltage at each bias current that is changed in small discreet steps as illustrated in Fig. 1(c). In order to ensure that the steady state is reached at each step, the voltage is monitored every 50 ms for up to 55 s while the current is kept constant. The magnitude of the voltage jump at (or ), which could be as large as several orders of magnitude, was almost independent of the current step size in the range 5 - 100 nA. Even with our smallest steps of 5 nA, no steady state with a voltage within the range covered by the jump was observed.
Our investigations on how and influence the nonlinear transport indicate that these quantities play similar roles. The main effect of increasing is to lower the superconductor-metal “critical” field ; the -driven evolution of the - curves at an elevated [Fig. 1(e)] remains qualitatively the same as that in the low limit [Fig. 1(b)]. More importantly, the evolution of the - curves as a function of [shown in Fig. 2(a) and (c)] is strikingly similar to that caused by [shown in Fig. 1(b) and (e)].

The field decreases with increasing and reaches zero at a well-defined temperature , which is close to as shown by the arrows in Fig. 2(b) and (d). This, together with the observations described above, means that is a well-defined line in - plane separating the superconducting and metallic regime. We point out that, in terms of nonlinear transport, the electronic properties at in the low limit, where the unexpected metallic behavior intervening SIT is observed, are indistinguishable from those at high temperatures, for example at and .
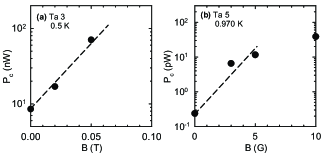
An important finding from our investigations is that the voltage jump in the superconducting regime is of non-thermal origin. If Joule heating is significant, the electron temperature would be determined by the balance of the Joule heating power and the heat drain rate to the stage where the sample is thermally anchored. A large heating power at a high bias current could make substantially higher than the stage temperature. If reaches near where sharply rises with , an increase in could cause an increase in the heating power, which in turn causes a further increase in . Such a positive self-feedback would make unstable and run away beyond , resulting in a sudden quenching of the superconductivity appearing as a voltage jump. This scenario can be tested by applying weak . The magnetic fields lower while the net thermal conductance between the sample and the stage would remain almost unaffected. Therefore, in the heating scenario the critical power, where and are the current and voltage at the onset of the voltage jump on the current increasing branch [marked by an arrow in Fig. 1(e)], is expected to be weakly decreasing function of . However, as shown in Fig. 3(a) and (b), is found to increase by an order of magnitude or more under weak . This clearly demonstrates that the voltage jump in the superconducting regime has a non-thermal origin. We note that is the highest steady state voltage in the superconducting state before the current-induced sudden quenching of the superconductivity. In repeated runs after thermal cyclings to above 10 K, the value of was reproducible within several percent even with different current step sizes in the range 5 - 100 nA.
The - curves in Fig. 1-2 clearly show that the discontinuity in - in the superconducting regime evolves into the point of the largest slope in the continuous - in the metallic regime. This strongly suggests that the sudden quenching of the superconductivity at and the nonlinear transport in the metallic regime are caused by the same mechanism, which has been shown above to be of non-thermal origin.
Now we turn to the discussion on the dynamic voltage response. The dynamic voltage response was studied by analyzing the voltage-time (-) traces to determine how fast the steady state is reached at each bias current. As shown by the solid line in Fig. 4(a), the -dependence is well described by an exponential function. The parameters and are determined from the measured steady state voltage and which is the steady state voltage at the previous bias current. The parameter is defined as the voltage response time constant, and obtained from a least squared error fitting procedure.
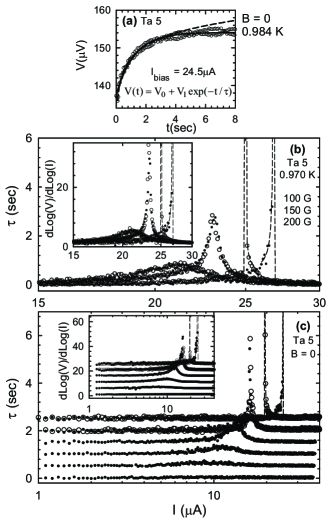
Figure 4(b) shows the - plots at three different across the superconductor-metal boundary. In the superconducting regime (=100 G), the time constant exhibits a hysteretic and diverging behavior with approaching from below ( from above) where the - is discontinuous. In the metallic regime (150 and 200 G) where - is continuous and reversible, the -traces are also continuous and reversible. However, a prominent peak structure is evident in the data. Interestingly, the peak or diverging feature in almost exactly coincides with the nonlinear transport. The inset shows the slopes of - curves in - scale. At current where is large the transport is nonlinear , and at current where is almost zero the transport is linear . Qualitatively the same behavior is observed when the superconductor-metal boundary is crossed by increasing . This is shown in Fig. 4(c). Note that the traces in Fig. 4(c) and the inset are successively shifted vertically.
It is surprising to find that the time constant in the peak or diverging region is as long as several seconds. We emphasize that the long time constant is not due to instrumentation. This is best demonstrated by the systematics of the data. Changing or systematically shifts the peak or divergence while outside the narrow peak or diverging region the time constants remain almost zero. The time constants were measured to be the same within the scatter of the data for current steps of 5 nA (not shown) and 100 nA (shown).
In the past, hysteresis accompanying a long response time has been studied in the context of irreversible magnetic properties in type II superconductors Yeshurun et al. (1996). Large magnetic relaxation rates observed in magnetization measurements Beasley et al. (1969) are believed to arise from thermal activation of magnetic flux lines out of pinning sites. The depinning process leads to a redistribution of flux lines causing a change in magnetization with time. Although our hysteresis with a long response time is observed in transport, not magnetization measurements, it still may be possible to understand in terms of pinning-depinning of vortices. A pinning-depinning transition arises from the competition between disorder-induced pinning force and Lorentz driving force due to the bias current. Under such a competition, the vortex motion is analogous to the flow of sand grains in a sand pile Pla and Nori (1991), where the competition is between the jamming due to the granularity of the system and gravitational force. Indeed, hysteresis Tennakoon et al. (1999) and slow relaxation rates Jaeger et al. (1988) have been observed in granular flow under mechanical vibrations. Logarithmic time dependence has been observed in measurements of relaxation of magnetization Yeshurun et al. (1996) and experiments on granular flowJaeger et al. (1988). The dashed line in Fig. 4(a) is the fit of our data to a logarithmic time dependence, and describes the data well for t 3 s. Nevertheless, over the entire range of the data, the exponential function (solid line) fits our data better.
Finally, we briefly discuss an interesting implication of the unusually long response time accompanying the nonlinear transport at and . Nonlinear transport of 2D superconductors at B = 0 is usually understood in the framework of Kosterlitz-Thouless (KT) theory Kosterlitz and Thouless (1973), where the superconducting transition corresponds to a thermodynamic instability of vortex-antivortex pairs in 2D. In this picture, current-induced dissociation of vortex pairs in the superconducting phase is expected to lead to nonlinear transport in the fashion, with a 3 Halperin and Nelson (1979). It has been argued Medvedyeva et al. (2000) that in a real system finite size effect can induce free vortices altering the power law -. The resulting - curves obtained in numerical simulations Medvedyeva et al. (2000) show a pronounced peak structure in resembling those shown in the inset of Fig. 4(c). However, the voltage response time which is observed to be as long as several seconds, is too long to be reasonable with the KT framework where the vortex dissociation is expected to occur in the time scale of quasiparticle scattering, typically s Ruck et al. (2000). At present, whether dynamics of KT vortices in the presence of disorder can have such long time scales is not clear, and the understanding of the nonlinear transport requires the development of a theoretical framework for nonequilibrium dynamics.
In summary, we have shown the magnetic field and temperature driven evolution of phase-identifying nonlinear - characteristics of Ta thin films that exhibit an unexpected metallic phase intervening SIT in the low limit. Our observations indicate that a non-thermal mechanism is behind both the nonlinear transport in the metallic phase and sudden current-induced quenching of the superconductivity in the superconducting phase. Our dynamic voltage response studies suggest a possible link of the metallic behavior to the dynamics of vortices in the presence of disorder.
Acknowledgements.
Authors acknowledge fruitful discussions with V. Galitski, H. Fertig, and E. Kolomeisky. This work is supported by NSF.References
- Abrahams et al. (1979) E. Abrahams, P. W. Anderson, D. C. Licciardello, and T. V. Ramakrishnan, Phys. Rev. Lett. 42, 673 (1979).
- Finkelshtein (1987) A. Finkelshtein, JETP Lett. 45, 46 (1987).
- Larkin (1999) A. Larkin, Ann. Phys. (Leipzig) 8, 785 (1999).
- Fisher (1990) M. P. A. Fisher, Phys. Rev. Lett. 65, 923 (1990).
- Fisher et al. (1990) M. P. A. Fisher, G. Grinstein, and S. M. Girvin, Phys. Rev. Lett. 64, 587 (1990).
- Mason and Kapitulnik (1999) N. Mason and A. Kapitulnik, Phys. Rev. Lett. 82, 5371 (1999).
- Mason and Kapitulnik (2002) N. Mason and A. Kapitulnik, Phys. Rev. B 65, 220505(R) (2002).
- Ephron et al. (1996) D. Ephron, A. Yazdani, A. Kapitulnik, and M. R. Beasley, Phys. Rev. Lett 76, 1529 (1996).
- Qin et al. (2006) Y. Qin, C. L. Vicente, and J. Yoon, Phys. Rev. B 73, 100505(R) (2006).
- Dalidovich and Phillips (2001) D. Dalidovich and P. Phillips, Phys. Rev. B 64, 052507 (2001).
- Dalidovich and Phillips (2002) D. Dalidovich and P. Phillips, Phys. Rev. Lett 89, 027001 (2002).
- Galitski et al. (2005) V. M. Galitski, G. Refael, M. P. A. Fisher, and T. Senthil, Phys. Rev. Lett 95, 077002 (2005).
- Kapitulnik et al. (2001) A. Kapitulnik, N. Mason, S. A. Kivelson, and S. Chakravarty, Phys. Rev. B 63, 125322 (2001).
- Das and Doniach (2001) D. Das and S. Doniach, Phys. Rev. B 64, 134511 (2001).
- Spivak et al. (2001) B. Spivak, A. Zyuzin, and M. Hruska, Phys. Rev. B 64, 132502 (2001).
- Tewari (2004) S. Tewari, Phys. Rev. B 69, 014512 (2004).
- Ng and Lee (2001) T. K. Ng and D. K. Lee, Phys. Rev. B 64, 144509 (2001).
- Goldman and Markovic (1998) A. M. Goldman and N. Markovic, Phys. Today 49, 39 (1998).
- Yeshurun et al. (1996) Y. Yeshurun, A. P. Malozemoff, and A. Shaulov, Rev. Mod. Phys. 68, 911 (1996).
- Beasley et al. (1969) M. R. Beasley, R. Labusch, and W. W. Webb, Phys. Rev. 181, 682 (1969).
- Pla and Nori (1991) S. Pla and F. Nori, Phys. Rev. Lett 67, 919 (1991).
- Tennakoon et al. (1999) S. G. K. Tennakoon, L. Kondic, and R. P. Behringer, Europhys. Lett. 45, 470 (1999).
- Jaeger et al. (1988) H. M. Jaeger, C.-H. Liu, and S. Nagel, Europhys. Lett. 62, 40 (1988).
- Kosterlitz and Thouless (1973) J. D. Kosterlitz and D. J. Thouless, J. Phys. C 6, 1181 (1973).
- Halperin and Nelson (1979) B. I. Halperin and D. R. Nelson, J. Low Temp. Phys 36, 599 (1979).
- Medvedyeva et al. (2000) K. Medvedyeva, B. Kim, and P. Minnhagen, Phys. Rev. B 62, 14531 (2000).
- Ruck et al. (2000) B. J. Ruck, H. J. Trodahl, J. C. Abele, and M. J. Geselbracht, Phys. Rev. B 62, 12468 (2000).