Phases of granular segregation in a binary mixture
Abstract
We present results from an extensive experimental investigation into granular segregation of a shallow binary mixture in which particles are driven by frictional interactions with the surface of a vibrating horizontal tray. Three distinct phases of the mixture are established viz; binary gas (unsegregated), segregation liquid and segregation crystal. Their ranges of existence are mapped out as a function of the system’s primary control parameters using a number of measures based on Voronoi tessellation. We study the associated transitions and show that segregation can be suppressed is the total filling fraction of the granular layer, , is decreased below a critical value, , or if the dimensionless acceleration of the driving, , is increased above a value .
I Introduction
Granular materials, i.e. ensembles of macroscopic discrete particles, are ubiquitous in our every day life, nature and of crucial importance in industrial processes Jaeger and Nagel (1992); Jaeger et al. (1996). The study of granular media has a long tradition amongst engineers and geologists who have had successes in specific problems using a combination of practical experience and empirical knowledge. More recently the physics community has taken an increased interest in granular materials since they pose a number of fundamental questions which challenge current ideas in non-equilibrium statistical mechanics Kadanoff (1999). Interactions between granular particles are intrinsically dissipative since energy is lost due to both inelastic collisions and frictional contacts. Hence, any dynamical study of a granular ensemble requires an energy input which typically takes the form of vibration or shear Melo et al. (1994); Miller et al. (1996). In this sense, detailed investigations of granular media provide examples of canonical systems where dynamical processes are far from equilibrium Egolf (2000).
An interesting and counter-intuitive feature of particulate matter is segregation of binary assemblies, where an initially uniform mixture of particles can spontaneously de-mix into its constituent components under flow Mullin (2002). Typically, the species of particles may differ in size, density, rigidity or surface properties. Such differences can often lead to separation and hence clustering of like particles Williams (1976); Bridgewater (1993). Intriguingly, segregation does not always happen and the conditions for its occurrence are difficult to predict. An extensive account of the issues involved can be found in the following reviews Shinbrot and Muzzio (2000); Ottino and Khakhar (2000); Kudrolli (2004); I. S. Aranson (2005).
The phenomena has been recognized for a considerable period of time Fan et al. (1990) but, despite more than half a century of research, the underlying nature of the mechanisms involved are not yet understood. Apart from posing various theoretical questions, insight into segregation would be beneficial for many applications. These include areas such as agriculture, geophysics, material science, and several branches of engineering, e.g. involving preparation of food, drugs, detergents, cosmetics, and ceramics Fan et al. (1990). In many of these examples processing and transporting of mixtures can lead to undesired separation. Segregation of mixtures can be brought about by the simple actions of pouring, shaking, vibration, shear and fluidization and is also found in industrial processes where the objective is to achieve particle mixing Bridgewater (1976); Williams (1976).
Over the last decade, significant interest in segregation has arisen in the physics community. A number of small scale laboratory experiments have been reported on vertically Williams (1963); Rosato et al. (1987); Duran et al. (1993); Shinbrot and Muzzio (1998) and horizontally Betat et al. (1998); Painter and Behringer (2000); Metcalfe et al. (2002); Aumaitre et al. (2001) vibrated beds, filling and emptying of vessels Drahun and Bridgewater (1983); Gray and Hutter (1997); Koeppe et al. (1998); Julien et al. (1997) and rotating cylindrical drums Donald and Roseman (1962); Clément et al. (1995); Gray and Hutter (1997); Hill and Kakalios (1995); Choo et al. (1997). The spatial distribution and dynamics of segregation of large and small particles appears to depend on a number of factors besides size difference including density ratio, friction between particles, shape of boundaries, particle velocity and the effects of the interstitial air. A great deal of research is required on the topic since the parameter space of such a system is large and seemingly trivial details turn out to have important effects in the segregation of mixtures. Designing simple and well controlled laboratory based experiments and developing appropriate models is therefore essential to make progress in understand segregation which in turn may give insights into the industrial problems outlined above.
We have recently developed an experiment to study the segregation of shallow layers of granular binary mixtures under horizontal vibration Mullin (2000); Reis and Mullin (2002); Reis et al. (2004a, b). The existence and self-organisation of three phases of segregation by systematically starting from homogeneous binary mixtures have been uncovered. These are, binary gas (unsegregated), segregation liquid and segregation crystal and they exist over ranges of the total filling fraction of the layer, . The principal result is the discovery of critical phenomena in the segregation process. This implies the existence of a transition point in below which the layer remains mixed and above which segregation occurs. An overview of this work will be given in Section III.
In this paper we present the results of an extensive experimental investigation where we show that this phase behavior of the granular mixture is robust over a range of control parameter space. Moreover, we investigate the role of the driving on the segregation process and uncover an additional transition between the segregated and mixed phases as the dimensionless acceleration of the tray is increased. We perform particle tracking and use the distribution of positions of the centers of one of the particle types to define a number of measures derived from Voronoi tessellation to characterize the state of the mixture. This detailed study points to a robust behavior of our granular mixture which invites the development of a predictive theoretical model.
This paper is organized as follows. A description of the experimental apparatus is given in Section II. In Section III we describe the nature of segregation patterns observed in our system and briefly review some results from our previous work. The microscopic measures obtained from Voronoi tessellation, namely the local Voronoi density and the angle between nearest neighbors, are discussed in Sections IV.1 and IV.2. In SectionV we report the results of an exploration of the parameter space of the system including the aspect ratio of the cell (Section V.1), the filling fraction of the mixture (Section V.2) and forcing parameters (Section V.3). Finally, in Section VI we relate our experimental results with recent numerical simulations and draw some conclusions.
II The experiment
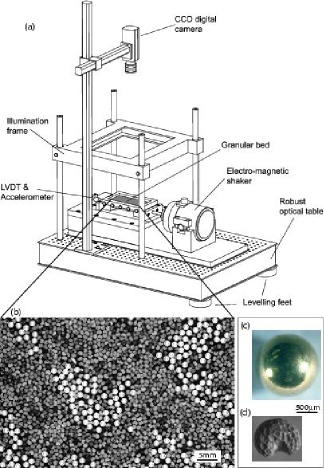
A schematic diagram of the apparatus is presented in Fig. 1a). The experimental set up consisted of a horizontal rectangular tray with dimensions . It was connected to an electro-mechanical shaker so that a mixture of granular particles placed on the tray was vibrated longitudinally. Individual particles or the granular layer were forced via stick-and-slip frictional contacts with the oscillating surface of the container. Different removable frames could be attached to the tray to make changes in size, shape and aspect ratio.
The tray was mounted on a horizontal platform which was connected to a Ling LDS V409 electro-mechanical shaker. Its motion was constrained to be unidirectional by four lateral high precision linear bush bearings. The shaker was driven sinusoidally using a HP 33120A function generator and the resulting dynamic displacement and acceleration of the shaking bed were monitored by a Linear Displacement Variable Transformer (LVDT) and a PCB quartz shear piezoelectric accelerometer.
The main granular mixture consisted of phosphor-bronze precision spheres and poppy seeds and photographs of representative particles are shown in Fig. 1c) and d). The poppy seeds were non-spherical (”kidney” shaped) with an average diameter of 1.06, polydispersity of 17% and a density of . The phosphor-bronze spheres had a diameter of , polydispersity of 3.0% and a density of . In addition to being non-spherical the poppy seeds had a considerably larger surface roughness than the spheres, which resulted in a stronger frictional interaction with the surface of the oscillating tray. This is evident from the series of ridges in the surface of the seeds, as shown in Fig. 1d)
We define the total filling fraction of the granular layer as,
| (1) |
where and are the numbers of poppy seeds () and phosphor bronze spheres () in the layer, and are the two dimensional projected areas of the respective individual particles and and are the longitudinal and transverse dimensions of the rectangular tray. and are the individual filling fractions for each of the particle species, respectively. Unless otherwise stated, was varied by keeping the filling fraction of the spheres fixed at and changing the filling fraction of the poppy seeds . This enabled more controlled changes to be made in but we also investigated changes in both and , as will be discussed in Section V.2.
In addition to the driving parameters and the total filling fraction, a geometrical dimensionless parameter, the aspect ratio, is defined as where is the longitudinal length of the tray and is the transverse width of the tray, perpendicularly to the direction of forcing. The values of and were changed using a variable frame which was positioned on all 4 side walls. Both and could be independently adjusted to the required value of .
All experimental runs were performed in an approximately monolayer regime. The larger heavy phosphor-bronze spheres were always in a monolayer but the lighter and flatter poppy seeds could overlap. This degree of overlapping was due to both the polydispersity of the poppy seeds and the difference in size between the poppy seeds and the spheres (size ratio of ). The mixture was deemed to be in the a monolayer regime if the extent of overlap of the poppy seeds was never such that the layer height exceeded the height corresponding to a diameter of the spheres. The failure of this criterion was readily noticed as smaller particles were observed to hop over domains of the larger particles. Hence, for the highest values of the total filling fraction, had values higher than those corresponding to maximum packing in two dimensions, which, for the case of monodisperse disks is . This choice of performing the experiments in this approximately monolayer regime has two advantages. Firstly, particles are always in contact with the oscillatory surface of the tray, such that the forcing was provided homogeneously throughout the layer through frictional contacts. Secondly, these approximately two dimensional experiments allowed the dynamics of the granular layer to be fully visualized by imaging the system from above.
All experimental runs were started using a homogeneous mixture as initial conditions. This was achieved using the following procedure. Firstly, a particular filling fraction of poppy seeds were vibrated at large amplitude, which created a homogeneous and isotropic layer. The phosphor-bronze spheres were then suspended above the layer, on a horizontal perforated plate with () diameter holes arranged in a triangular lattice and held by a shutter on an independent superposed frame. The shutter was then opened and the phosphor-bronze spheres fell onto the layer of poppy seeds, creating a near homogeneous mixture of the two types of particles. An example of such an initial configuration is presented in Fig. 2a). We found that if this procedure was not adopted, random initial clusters in a poorly prepared mixture could bias the results.
The dynamics of the segregation process were visualized using a near homogeneous illumination of the tray and the behavior monitored from above using a CCD camera as shown in Fig. 1a). Phosphor-bronze has a high reflection coefficient compared to the poppy seeds and the spheres appeared as sharp bright regions so that direct observation of their motion was relatively straightforward. The individual positions of the phosphor-bronze spheres were obtained in a central visualization window of the full granular layer in order to achieve the necessary resolution to obtain good estimates of the centers of the spheres. The spatial distribution of the positions of the phosphor-bronze spheres were obtained using image processing and particle tracking techniques which was then used to calculate a variety of measures. No tracking was carried out on the poppy seeds.
In summary, the control parameters of the experiment were the amplitude and frequency of the applied vibration, the total filling fraction of the mixture, , and the aspect ratio of the container, .
III The segregation process
In our previous work Mullin (2000); Reis and Mullin (2002); Reis et al. (2004a, b) we present experimental evidence for three qualitatively distinct phases of the binary mixture of poppy seeds and phosphor-bronze spheres. Each exists over a range of the filling fraction of the granular layer, . We identify these phases as binary gas (unsegregated), segregation liquid and segregation crystal Reis et al. (2004a).
The binary gas phase is found at low values of and is essentially a collisional regime. In this phase there is enough free area and agitation, such that the particles move randomly around the layer and a mixed state persists. In the segregation liquid phase, at intermediate values of , aggregation of the phosphor-bronze spheres occurs and mobile liquid-like clusters form. A representative segregation pattern of the mixture in this segregation liquid phase is shown in Fig. 1b). The snapshot corresponds to a segregated state which self-organizes after the mixture is vibrated for a period of 3 minutes, with forcing parameters and and aspect ratio . The movement of the segregation domains is reminiscent of oil drops on water. The motion of the particles within the clusters is highly agitated and the collective motion is slow with merging and splitting of the domains.
The transition from the binary gas to segregation liquid phase Reis and Mullin (2002) has the characteristics of a continuous phase transition with square-root dependence of the saturation levels as measured by the average stripe width which we treat as an order parameter. This critical phenomenon implies the existence of a transition point at , below which the layer remains mixed and above which segregation occurs. Moreover, critical slowing down of the segregation times scales is found near .
At high filling fractions, for a second qualitative change of the structure and dynamics of the domains occurs as well defined striped patterns, perpendicular to the direction of forcing, self-organizes from the initial homogeneous mixture. We denote this third regime by segregation crystal. The monodispersity of the phosphor-bronze spheres means that the segregation domains in this phase consist of particles disposed in a hexagonally packed lattice whereas the polydisperse poppy seeds always move around randomly.
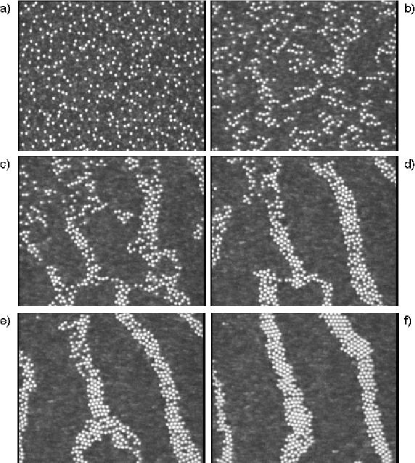
A time sequence which is typical of the behavior seen at at high filling fractions where crystalline stripes form, is presented in Fig. 2, for . Immediately after the vibration is applied, single large particles diffuse in a sea of the smaller ones, exploring different local configurations. When two large particles happen to come close together, the smaller particles cannot fit between them, and hence the pair is subjected to an asymmetric pressure that keeps it together. Subsequently, pairs may encounter others so that progressively larger clusters form. The unidirectionality of the driving induces an asymmetry in the segregated domains such that elongated domains of the larger phosphor-bronze spheres develop in a direction which is orthogonal to the direction of the drive. During this initial period, the rapid formation of clusters suggests an effective attractive force between the phosphor-bronze spheres, that leads to aggregation. Eventually, long domains form in the y-direction and well defined stripes grow across the full width of the tray. This self-organization into segregation domains occurs within timescales of tens of seconds. For longer timescales of the order of a few hours, these segregated domains progressively coarsen with time, thereby merging to form increasingly robust stripes. The width of the domains follows a power-law with time and this scaling is independent of the mixture used Mullin (2000). The coarsening takes place most obviously for values of in the range 0.1–0.2 above . An extensive parametric investigation of the coarsening behavior as a function of has yet to be carried out.
It is important to stress once more that, depending on the control parameters, the mixture does not always evolve into a robust striped pattern. This was only for filling fractions with . At lower filling fractions, in particular closer, but above, to the segregation transition point the segregated domains are increasingly mobile and blob-like, as shown in the representative liquid state of Fig. 1b).
IV Voronoi Measures
We now focus on the description of the segregation in our granular mixture using a number of microscopic measures. By microscopic, we mean that both structural and dynamical quantities are analyzed using the positions of the centers of the individual phosphor-bronze spheres obtained from the particle tracking analysis. This is by way of contrast with the macroscopic average width of the segregated domains and respective fluctuations used in our previous work Reis and Mullin (2002); Reis et al. (2004a, b).
The construction of Voronoi cells through tessellation (also know as Wigner-Seitz cells) is a standard tool for the study of spatial configurations of particle ensembles which is widely used in condensed matter physics Okabe et al. (1992) and is outlined as follows. Consider a set of coplanar particles with their centers located at for . For each particle , Voronoi tessellation yields a polygonal cell that encloses a region inside which any point is closer to the center of the particle than any other in the set . We have used the voronoi(x,y) routine in the package MATLAB 7.0 to implement this procedure. It is straightforward to extract a measure of the local area density associated with each phosphor-bronze sphere for this geometrical construction. It is also possible to obtain another useful measure of the angle between nearest neighbors. These two quantities are introduced in the following two Sections, IV.1 and IV.2, respectively.
IV.1 Local Voronoi density
The first quantity considered is a measure of the local area density associated with each phosphor-bronze sphere Reis et al. (2004a). Following a standard procedure Kumar and Kumaran (2005), the local Voronoi area density of the sphere of an individual video frame can be defined as the ratio,
| (2) |
where is the two-dimensional projected area of the imaged spheres with diameter and is the area of its Voronoi polygon.

In Fig. 3 we present examples of typical Voronoi configurations, at four different values of , constructed using the positions of the phosphor-bronze spheres. In the binary gas regime at no segregation occurs and the network of Voronoi polygons appear random, as shown in Fig. 3(a). By way of contrast, at where definite segregation develops, structure appears in the domains as can be seen in Fig. 3(d). Two snapshots of the network of Voronoi cells for intermediate values of are presented in Fig. 3b) and (c). Note that the particles at the edges of the segregation clusters have an associated area density significantly lower than those in the bulk of the domains.
We first discuss the time evolution of the local Voronoi area density from the initial mixed state. A time window of , which corresponds to 100 video frames (i.e. drive cycles) has been used to obtain dynamic averages for the area density of individual spheres, , as,
| (3) |
where the brackets denote averaging over all the particles, , found within the time window, with . A time dependent Probability Distribution Function for the local Voronoi area density, , was obtained by constructing normalized histograms of as a function of the discretised time, . Each , for any time window , typically contained statistical ensembles with 35,000 to 40,000 particles.
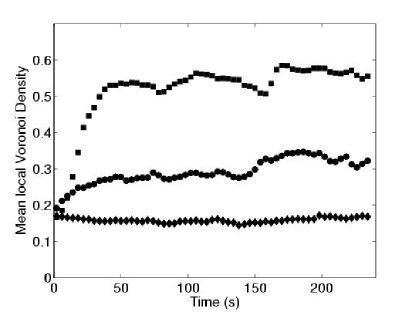
In Fig. 4 we plot the mean value of the distribution , , for three values of the filling fraction. Let us first focus on the behavior at early times, i.e. within the period . At , is flat since the layer remains mixed. At intermediate values of , where is a typical example, exhibits a slow increase up to a value of as segregation clusters form. At high values of filling fraction, of which is representative, there is a rapid initial evolution, since increasingly dense clusters form, up to a value of after which the mean area density levels off. This behavior is consistent with the observation of saturation in the macroscopic mean stripe width presented in our previous work Reis and Mullin (2002); Reis et al. (2004a, b).
At later times, i.e. , the mean Voronoi area density for the two cases of and only shows small deviations from the level off value of and the system has reached a segregated state with a characteristic Voronoi density. The small dips in correspond to the long term splitting and merging of stripes mentioned in Section III. An error estimate of the closeness to a steady state can be obtained from the ratio of the standard deviation to the mean of , which was below for all values of filling fraction considered.
The dynamical behavior of the segregation process can now be analysed as a function of the filling fraction using the local Voronoi density. We focus on the initial stages of the formation of domains. During this regime of fast initial segregation growth, exhibits an approximately linear behavior of the form,
| (4) |
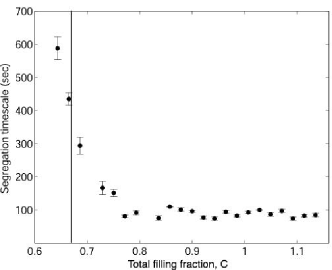
where is the mean area density of the initial homogeneous mixture and is the corresponding rate of segregation. A value of provides a good fit to all experimental runs since the layer is consistently started from an homogeneous mixture. The inverse of the rate of segregation yields a measure of the segregation timescale, . The quantity is plotted in Fig. 5. The segregation timescale rapidly increases as is approached from above, indicating a slowing down of the dynamics which is consistent with the critical slowing down found previously from the macroscopic measures Reis and Mullin (2002); Reis et al. (2004b).
In Reis et al. (2004a) we showed that the behavior of the distributions obtained in the steady state regime (i.e. after the initial segregation growth) is useful in the characterization of the segregation in a mixture. At low values of , the PDFs are peaked at small . As is increased a qualitative change in the shape of the PDFs is seen and at they flatten out indicating that there is a greater probability of finding particles with an area density across the entire range. As is increased further, a new peak develops at high area densities corresponding to particles within the segregation clusters. This peak at high becomes increasingly sharper for high , with a drop at values of , which is consistent with maximum packing in 2D of for a perfect hexagonal arrangement of disks.
The value of the median of the distributions, , measures the characteristic Voronoi density of the spheres in the mixture and is used in Section V to aid mapping out the phase diagram of the granular mixture.
IV.2 Angle between nearest neighbors
Another quantity that can be calculated from the Voronoi tessellation procedure is the angular distribution between nearest neighbours of each sphere. The configuration of a section of a schematic Voronoi polygon for a particle with coordinates and two of its nearest neighbours, and , is given in the inset of Fig. 6. We define to be the angle between nearest neighbours set by , and . This can be obtained from the Voronoi tessellation procedure which yields the position of the coordinates of the vertices of the Voronoi polygon , and . Hence, it follows from the geometric construction around the particle that,
| (5) |
where,
| (6) |
and
| (7) |
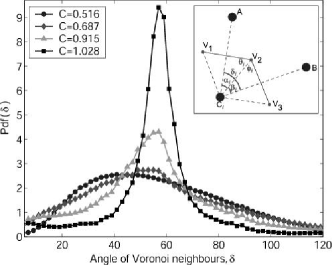
Representative curves of are presented in Fig. 6 for four different values of . For example, for small the distribution is broad which indicates that the spheres do not exhibit a preferred orientation as expected for a mixture. However, as the filling fraction is increased the main peak of the distribution shifts towards and the width of the peak decreases significantly.
The location, , and width, , of the peak of the distributions is therefore a measure of the local orientational structure nearby each phosphor-bronze sphere. Both of these quantities are used in Section V to aid mapping out the phase diagram of the granular mixture.
V Exploration of parameter space
V.1 Aspect ratio
Since is a dimensionless ratio between the total projected area occupied by all the particles and the area of the tray, it is now of interest to explore the effect of varying the total area and aspect ratio of the tray. A frame with movable walls in both and was used to accomplish this. Its side walls were mounted in precision machined parallel grooves and the respective dimensions adjusted using a Vernier scale which was accurate to within 0.05mm. The range of the aspect ratio explored was . The filling fraction of the layer was fixed at with phosphor-bronze spheres. Since the total area of tray varied while changing , both and had to be changed accordingly in order to keep and constant. The forcing parameters, as before, were set at and .
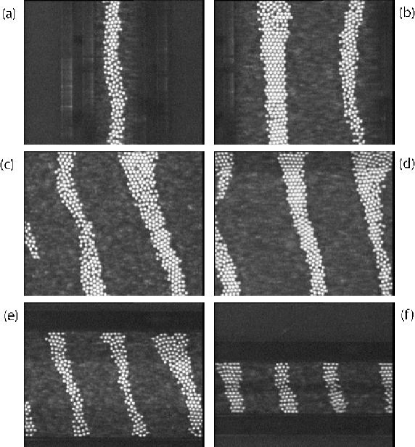
Example snapshots of the granular layer taken after of vibration of an initially homogeneous mixture are presented in Fig. 7(e-f), for various values of . Note that the photographs correspond to a central imaging window of the full tray () and hence in all experimental frames of Fig. 7 only a portion of the granular layer is shown. The vertical boundaries of the tray are, therefore, only observable in Fig. 7 (a) and (b) and the horizontal boundaries in Fig. 7 (e) and (f ).
For , of which the frame in Fig. 7(a) is a representative example, a single stripe formed perpendicular to the direction of forcing. For larger values of , a number of similar well defined vertical stripes rapidly developed in the same way of the particular case of , which was studied in detail in Sections III–IV.2. Moreover, the number of stripes in the system increased as was increased. For example, increasing the tray’s aspect ratio from (Fig. 7a) to (Fig. 7b) resulted on a increase from one to two stripes.
Even if larger number of stripes could be attained by varying , in all cases the stripes had a similar form i.e. they had approximately the same longitudinal width even if their transverse height (set by of the tray) decreased with . The characteristic local Voronoi area density of the spheres, was measured as a function of . As the aspect ratio of the tray was changed, the local area density of the phosphor-bronze spheres remained approximately constant (to within ) with an average value of . This suggests that the segregation behavior appears to be independent of both the total area and aspect ratio of the tray.
V.2 Filling fraction parameter space
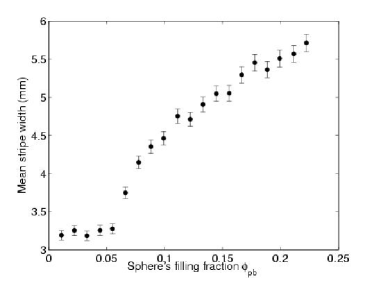
The majority of the experiments were performed by keeping the filling fraction of the phosphor-bronze spheres fixed at , and incrementally increasing the filling fraction of the poppy seeds, . Hence it is possible that the transition sequences might be caused by reaching a critical fill ratio of the domain. In order to make sure that this was not the case, a series of experiments were performed where the dependence of the segregation transition on the relative composition of the binary mixture was investigated, while keeping the constant. The amounts of spheres and poppy seeds, set by and , were varied accordingly, with the constraint of keeping the total filling fraction of the layer fixed at . The mean longitudinal width, , of the domains of phosphor-bronze spheres has been used as the order parameter to measure the state of the system. Details concerning this measure can be found in Reis and Mullin (2002); Reis et al. (2004b). A plot of versus is given in Fig. 8 where it can be seen that for low values of , the mean domain width is . This corresponds to approximately two sphere diameters and is consistent with the chance occurrence of neighboring particles averaged over the layer. Therefore, these are not segregated domains and the layer is in a mixed state. As is increased past =0.055, increases continuously. We emphasize again that has to be changed accordingly in order to keep constant. This result suggests that, for segregation to occur, not only has the total filling fraction to be large enough (i.e. above a critical value as reported in Reis and Mullin (2002)) but also the amount of spheres in the layer is required to be above a threshold value . This result emphasizes the fact that the total filling fraction is a two dimensional parameter .
Therefore, the dependence of the segregation behavior on was further explored in the filling fraction parameter space, by increasing the number of poppy seeds and hence scanning along for four values of .
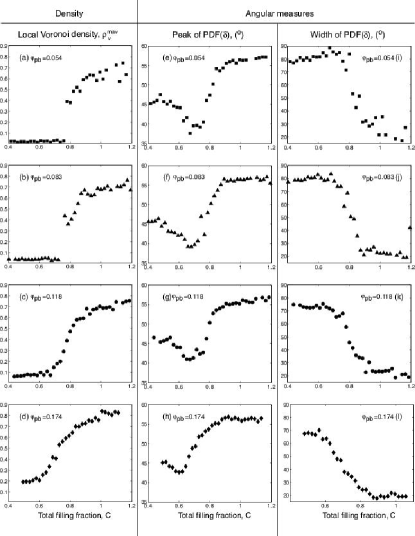
The measure used to characterize the state was Voronoi area density, , and the results are presented in Fig. 9(a-d). All four data sets exhibit a clear transition between a mixed state (low area density) and segregated (high area density) state. A particularly interesting feature is that the transition becomes sharper in the mixtures with lower values of and yet the position of the segregation critical point remains fixed. The mean value for the estimate of the mixed state at the left hand edge of each graph is proportionally lower as is decreased. This is expected since the overall area density of the phosphor-bronze spheres in the mixture is decreased, i.e. the total number of spheres in the tray is smaller for lower . However, the branches corresponding to the segregated phases do not show any significant change, for different . Estimates of the local densities of were attained in all four cases, at the highest values of .
The location of the maximum of the distributions presented in Section IV.2 yields the characteristic angle between nearest neighbors, . In Fig. 9(e-h) we present the results of for the four data sets with different , plotted as a function of . Striking behavior becomes apparent in this measure for lower values of . Take, for example, the data in Fig. 9e) for . At the lowest values of , tends to . However, as was increased, follows a non-monotonic variation, as the mixture goes through the segregation transition. The characteristic angle first decreases to only to then sharply increase past the segregation transition point. The nature of this non-monotonic dependence of on is unclear, even though it appears to be robust and persists in the other three datasets. At the highest values of the phosphor-bronze spheres self-organize into a nearly hexagonal pack, for which one would expect . This is consistent with the value of attained in the experiment at high .
The second quantity that we extract from the distributions is the width at half maximum, , of the peak which is a measure of the fluctuations in and is plotted in Fig. 9(i-l), for the four values of . In all curves, three distinct regimes are evident where each corresponds to one of the phases of the binary mixture. As an example, consider the curve for given in Fig. 9(j). At low the distribution is broad, indicating that a wide range of angles between nearest neighbors are possible. This implies that a disordered binary gas phase exists and there is no segregation. At , the point at which the segregation transition occurs, there is a quantitative change of behavior and rapidly drops with increasing . This region corresponds to the segregation liquid phase. At , levels off at low values and is now sharply centered at , implying that the transition from the segregation liquid into the segregation crystal has taken place. This three step behavior in can be seen in all four datasets confirming that the scenario of three segregation phases as a function of is robust over a range of the filling fraction parameter space.
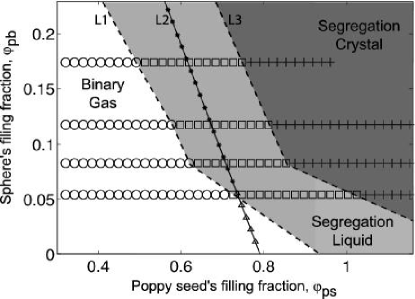
In Fig. 10 the four data sets discussed thus far are combined in a phase diagram where the phase boundaries and were calculated from the points demarking the three regimes of discussed above. The aim is to determine the locus of existence of the three segregation phases. The binary gas is located in the left hand side of the diagram in the regions of low . The segregation liquid exists in the central region of the diagram. The segregation crystal is observed at large values of , on the right hand side of the phase diagram. Note also that the phase boundaries and (dashed lines in Fig. 10) are approximately parallel for the data sets with , to within . This indicates that in this region of the phase diagram the total filling fraction is the primary parameter in determining the behavior, rather than the absolute amounts of each of the particle types. However, larger deviations occur for the dataset with . The deviations in this region of the phase diagram with low is confirmed by the dataset discussed above where the total filling fraction was kept constant at with and varied accordingly (data along the oblique solid line in Fig. 10).
We stress that strong deviations from the results presented here are to be expected in the limiting cases as the mixture approaches the single component regimes: i) and ii) . Two sub-limits of particular interest are those for the dense cases: iii) () where crystallization of the phosphor-bronze spheres prevails and () where the dense liquid-like nature of the poppy seeds dominates and segregation is suppressed. This is consistent with the polydispersity and shape of the poppy seeds preventing crystallization.
V.3 Forcing parameter space
In the results discussed thus far, the drive parameters have been kept fixed at and . We now report the results of an investigation of the parameter space. The aspect ratio and total filling fraction were fixed at and with . All experimental runs in this section, as before, were initiated from a homogeneously mixed configuration.
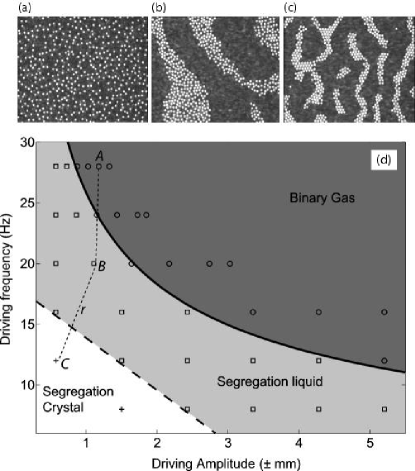
With the above conditions produced a dense segregation ‘liquid’ from the initial mixture. However, all three phases can be obtained at appropriate locations in the space. Examples of each of these phases can be seen in the experimental frames presented in Fig. 11(a-c). An example of a binary gas is shown in Fig. 11(a) for . The forcing is sufficiently large to induce apparently random motion in the phosphor-bronze spheres across the layer and no segregation occurs. This example of a binary gas differs from the cases considered previously for in the sense that, at this high filling fractions (), the particles in the layer have persistent contacts with their neighbors and there is only a small amount of free area in the tray. Therefore this is a highly agitated but non-collisional state. At , segregation occurred and the segregation liquid shown in Fig. 11(b) was observed. A representative example of a segregation crystal is shown in Fig. 11(c) for , where spheres within the domains were disposed in hexagonally packed configurations.
The corresponding phase diagram for the parameter space is presented in Fig. 11d). Two clear examples of the segregation crystal phase were found at parameter values located in the lower right hand corner of the diagram i.e. for low amplitudes and frequencies. At intermediate values of the forcing, a segregation liquid phase was observed. At relatively large values of and segregation did not occur and a binary gas phase was dominant. The nature of the phase boundary between the segregation liquid and the binary gas phases (solid line in Fig. 11d) is discussed below.
In order to obtain quantitative estimates of the behavior, the of the distribution of the local Voronoi area density was calculated for each point in space. The characteristic local Voronoi area density, , was then obtained from the location of the maximum of the distribution, as before.
The dimensionless maximum acceleration of the tray is used to parameterize the forcing. It is given by ,
| (8) |
where is acceleration due to gravity. The parameter is commonly used in vertically vibrated granular systems Melo et al. (1995) in which gravity plays a dominant role and the granular layer requires to leave the vibrating base. In our horizontal set up, gravity enters the problem indirectly through the frictional forces acted on individual particles, where is the particle mass and its friction coefficient. In the ideal scenario of no rolling, the value of the non-dimensional acceleration at which relative motion between the particle and the oscillatory tray appears would occur at .
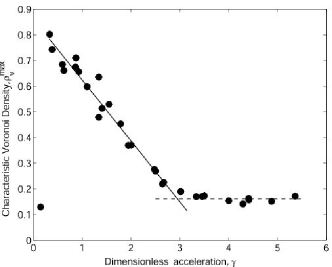
In Fig. 12 the characteristic local Voronoi area density is plotted as a function of . All data points from the parameter space study collapse on to a single curve, where two clearly distinct regimes can be observed. This indicates that is, indeed, an appropriate parameter to describe the forcing of the granular mixture through oscillatory motion of the tray.
At high accelerations, for , the characteristic Voronoi area density remains approximately constant with increasing . In this regime, the layer was in the highly agitated binary gas phase discussed above and no segregation occurred. As is decreased below the final state achieved becomes increasingly more dense in an approximately linear fashion. The solid and dashed lines in Fig 12 were obtained from the best least squares fits of the form , in the region (segregation phase) and in the region (binary gas phase), respectively. The intercept of the two lines yields the location of the transition point which was measured to be .
The relationship,
| (9) |
provides a good fit to the phase boundary, , between the binary gas and segregation liquid phases as shown by the solid curve in Fig. 11d). This also suggests that is the appropriate parameter to describe the forcing of the tray.
VI Conclusion
We have carried out a detailed experimental investigation of segregation behavior in a monolayer of two types of particles contained in a horizontal oscillating tray. The particles are set into motion via stick slip interaction with the base and this effectively randomizes their motion. An initially homogeneous mixed layer gives rise to spontaneous robust patterns when set into motion. The patterns have the form of clusters of one particle type and they persist over a wide range of the experimental conditions. The two principal control parameters of the system were found to be the layer filling fraction and the dimensionless acceleration of the driving. Moreover, we demonstrated that the essential mechanisms of the segregation process appeared to be independent of the aspect ratio of the tray.
Three qualitatively distinct phases were identified: a disordered binary gas for low values of , segregation liquid with mobile domains of one of the particle types at intermediate values and segregation crystal where the domains are stripes oriented in a direction orthogonal to that of the driving at high values of . Moreover, we have reported a novel transition between the segregated and mixed phases as the dimensionless acceleration of the driving was increased.
Recently, there has been a number of numerical studies where systems analogous to that of these experiments have been simulated Pooley and Yeomans (2004); Ehrhardt et al. (2005); Ciamarra et al. (2005a, b). The segregation behavior of these numerical systems is found to be in partial qualitative agreement with our experiments. Ciamarra et. al. Ciamarra et al. (2005a, b) have suggested that the segregation process is a result of dynamical instability which resembles the classical Kelvin-Helmholtz instability observed at a fluid interface. Similar stripe formation has also been observed in a continuum model of a binary fluid in which the components are differentially forced Pooley and Yeomans (2004); S/’anchez et al. (2004). These studies suggest that the principal mechanism underlying segregation in this class of systems is the differential driving between each of the particle species. In our experiments, this could relate to the different surface properties of the phosphor-bronze spheres and the poppy seeds which induce different frictional interactions with the surface of the oscillatory tray.
However, even though the segregation patterns of the simulations are qualitatively similar to those observed in our experiments, none of the numerical models are as yet able to reproduce the critical behavior. In particular, there is no evidence for the associated critical slowing down of the dynamics near the transition region. Moreover, our parametric study of the driving parameters and the additional transition we have uncovered as a function of the dimensionless acceleration of the tray demonstrates that the forcing also plays a crucial role in the phase behavior of the granular mixture. This point has so far been overlooked in the numerical studies. We believe that this extensive investigation of the parameter space of our experimental system will be crucial for further testing and refinement of numerical models of the type mentioned above.
Acknowledgments: PMR was supported by a scholarship from the Portuguese Foundation of Science and Technology. The research of TM is supported by an EPSRC Senior Fellowship. The authors would like to thank D. Bonamy for advice on the Voronoi tessellation analysis and G. Ehrhardt for helpful discussions.
References
- Jaeger and Nagel (1992) H. Jaeger and S. Nagel, Science 255, 1523 (1992).
- Jaeger et al. (1996) H. Jaeger, S. Nagel, and R. Behringer, Physics Today pp. 32–38 (1996).
- Kadanoff (1999) L. Kadanoff, Rev. of Mod. Phys. 71, 435 (1999).
- Melo et al. (1994) F. Melo, P. Umbanhowar, and H. L. Swinney, Phys. Rev. Lett. 72, 172 (1994).
- Miller et al. (1996) B. Miller, C. O’Hern, and R. P. Behringer, Phys. Rev. Lett. 77, 3110 (1996).
- Egolf (2000) D. Egolf, Science 287, 101 (2000).
- Mullin (2002) T. Mullin, Science 295, 1851 (2002).
- Williams (1976) J. C. Williams, Powder Tech. 15, 245 (1976).
- Bridgewater (1993) J. Bridgewater, Mixing and segregation mechanisms in particle flow (In: Granular Matter A. Metha (Ed.) 161–195, Springer-Verlag, 1993).
- Shinbrot and Muzzio (2000) T. Shinbrot and F. Muzzio, Physics Today pp. 25–30 (2000).
- Ottino and Khakhar (2000) J. M. Ottino and D. V. Khakhar, Annu. Rev. Fluid Mech. 32, 55 (2000).
- Kudrolli (2004) A. Kudrolli, Rep. on Prog. in Phys. 67, 209 (2004).
- I. S. Aranson (2005) L. S. T. I. S. Aranson (2005), cond-mat/0507419, submitted to Rev. Mod. Phys.
- Fan et al. (1990) L. T. Fan, Y. Chen, and F. S. Lai, Powder Tech. 61, 255 (1990).
- Bridgewater (1976) J. Bridgewater, Powder Technology 15, 215 (1976).
- Williams (1963) J. C. Williams, Fuel Soc. 14, 29 (1963).
- Rosato et al. (1987) A. Rosato, K. J. Strandburg, F. Prinz, and R. H. Swendsen, Phys. Rev. Lett. 58, 1038 (1987).
- Duran et al. (1993) J. Duran, J. Rajchenbach, and E. Clément, Phys. Rev. Lett 70, 2431 (1993).
- Shinbrot and Muzzio (1998) T. Shinbrot and F. J. Muzzio, Phys. Rev. Lett. 81, 4365 (1998).
- Betat et al. (1998) A. Betat, C. Dury, I. Rehberg, G. Ristow, M. Cherer, M. Scroter, and G. Straßgurger, Formation of Patterns in Granular Materials (In: F. Busse and S. C. Muller (eds.), Evolution of spontaneous structures in dissipative continuous systems Springer, 1998).
- Painter and Behringer (2000) B. Painter and R. P. Behringer, Phys. Rev. Lett. 85, 3396 (2000).
- Metcalfe et al. (2002) G. Metcalfe, S. G. K. Tennakoon, L. Kondic, D. G. Schaeffer, and R. P. Behringer, Phys. Rev. E 65, 031302 (2002).
- Aumaitre et al. (2001) S. Aumaitre, C. A. Kruelle, and I. Rehberg, Phys. Rev. E 64, 041305 (2001).
- Drahun and Bridgewater (1983) J. A. Drahun and J. Bridgewater, Powder Tech. 36, 39 (1983).
- Gray and Hutter (1997) J. M. N. T. Gray and K. Hutter, Contin. Mech. & Thermodyn. 9, 341 (1997).
- Koeppe et al. (1998) J. P. Koeppe, M. Enz, and J. Kakalios, Phys. Rev. E 58, R4104 (1998).
- Julien et al. (1997) P. Julien, Y. Lan, and Y. Raslan, Experimental mechanics of sand stratifications (In: Behringer R. and Jenkins J (eds.), Powder & Grains 97, Balkema, Rotterdam, 1997).
- Donald and Roseman (1962) M. Donald and B. Roseman, Br. Chemical Engineering 7, 749 (1962).
- Clément et al. (1995) E. Clément, J. Rajchencach, and J. Duran, Europhys. Lett. 30, 7 (1995).
- Hill and Kakalios (1995) K. M. Hill and J. Kakalios, Phys. Rev. E 52, 4393 (1995).
- Choo et al. (1997) K. Choo, T.C.A. Molteno, and S.W. Morris, Phys. Rev. Lett. 79, 2975 (1997).
- Mullin (2000) T. Mullin, Phys. Rev. Lett. 84, 4741 (2000).
- Reis and Mullin (2002) P. M. Reis and T. Mullin, Phys. Rev. Lett 89, 244301 (2002).
- Reis et al. (2004a) P. M. Reis, G. Ehrhardt, A. Stephenson, and T. Mullin, Europhys. Lett. 66, 357 (2004a).
- Reis et al. (2004b) P. M. Reis, T. Mullin, and G. Ehrhardt, in Unifying Concepts In Granular Media And Glasses, edited by A. Coniglio, H. J. Herrmann, A. Fierro, and M. Nicodemi (Elsevier Science, Amsterdam, 2004b), pp. 99–109.
- Okabe et al. (1992) A. Okabe, B. Boots, and K. Sugihara, Spacial Tesselations: Concepts and Applications of Voronoi Diagrams (Wiley, 1992).
- Kumar and Kumaran (2005) V. Kumar and V. Kumaran, J Chem Phys. 123, 114501 (2005).
- Melo et al. (1995) F. Melo, P.B. Umbanhowar, and H.L. Swinney, Physical Review Letters 75, 3838 (1995).
- Pooley and Yeomans (2004) C. M. Pooley and J. M. Yeomans, Phys. Rev. Lett. 93, 118001 (2004).
- Ehrhardt et al. (2005) G.C.M.A. Ehrhardt, A. Stephenson, and P. M. Reis, Physical Review E 71, 041301 (2005).
- Ciamarra et al. (2005a) M. P. Ciamarra, A. Coniglio, and M. Nicodemi, Phys. Rev. Lett. 94, 188001 (2005a).
- Ciamarra et al. (2005b) M. P. Ciamarra, A. Coniglio, and M. Nicodemi, J. Phys.: Condens. Matter 17, S2549 (2005b).
- S/’anchez et al. (2004) P. Sanchez, M. R. Swift, and P. J. King, Phys. Rev. Lett. 93, 184302 (2004).