Coupling of phonons and electromagnons in GdMnO3
Abstract
The infrared and Terahertz properties of GdMnO3 have been investigated as function of temperature and magnetic field, with special emphasis on the phase boundary between the incommensurate and the canted antiferromagnetic structures. The heterogeneous incommensurate phase reveals strong magnetodielectric effects, characterized by significant magnetoelectric contributions to the static dielectric permittivity and by the existence of electrically excited magnons (electromagnons). In the commensurate canted antiferromagnetic phase the magnetoelectric contributions to the dielectric constant and electromagnons are suppressed. The corresponding spectral weight is transferred to the lowest lattice vibration demonstrating the strong coupling of phonons with electromagnons.
pacs:
75.80.+q,75.47.Lx,78.30.-j,75.30.DsMultiferroic materials with the simultaneous occurrence of magnetism and ferroelectricity, are a hot topic in recent solid-state research. They provide interesting and spectacular physical properties and promise attractive applications hill ; fiebig ; khomskii . Multiferroic behavior occurs in a variety of systems originating from very different physical mechanisms, including materials with independent magnetic and ferroelectric subsystems, like some boracites, Aurivillius phases, hexagonal manganites, and the lone-pair ferroelectrics with magnetic ions khomskii . Recently a new class of multiferroics, namely ferromagnetic sulfospinels with relaxor-like short range ferroelectric (FE) order have been detected peter with a strong coupling of the electric and magnetic properties al low frequencies. In these spinel compounds the ferromagnetism is induced via strong indirect exchange interaction, but the origin of ferroelectricity remains unclear sofar. Finally, in the perovskite manganites there is robust experimental evidence kimura ; kimura05 that the onset of helical magnetic order induces spontaneous FE polarization kenzelmann ; arima . Dzyaloshinskii-Moriya type interactions have been utilized to explain the ferroelectricity which is induced by the helical spin structure katsura05 ; mostovoy ; sergienko . A similar spin-driven ferroelectricity is believed to be operative in Ni3V2O8 lawes .
After having established the ground-state properties of this interesting class of materials, the study of their novel dynamic properties will significantly enhance our knowledge of the magneto-electric (ME) coupling katsura . Magnons are the characteristic excitations of magnetic structures, while soft phonons as inferred by the Lyddane-Sachs-Teller relation condense at canonical ferroelectric phase transitions. It seems clear that soft phonons cannot be relevant excitations in the ferroelectric manganites, as (improper) ferroelectricity is induced by the magnetic order coupled to the lattice. Recently it has been shown that electro-magnons are relevant collective modes in this new class of ferroelectrics nphys . Electromagnons are spin waves that are excited by an ac electric field. By measurements in TbMnO3 and GdMnO3 it has been documented that these new excitations exist not only in the magnetic phase characterized by the helical spin structure, but also in the longitudinally modulated (sinusoidal) structure, provided that a ”helical-type” vector component of the spin-wave is dynamically induced via the ac electric field nphys .
In this Letter we present detailed investigations of the Terahertz and FIR properties of GdMnO3. We investigate electromagnons and phonons as function of temperature and magnetic field. We provide striking experimental evidence that i) electromagnons are strongly coupled to phonons with a considerable shift of optical weight between these excitations and ii) electromagnons contribute considerably to the static dielectric constant.
Single crystals of GdMnO3 have been prepared using the floating-zone method with radiation heating. The samples have been characterized using X-ray, magnetic and dielectric measurement jo . The basic properties of our samples agree well with the results obtained by other groups goto ; kimura05 . The experiments at Terahertz frequencies were carried out in a Mach-Zehnder interferometer volkov which allows the measurements of transmittance and phase shift. The absolute values of the complex dielectric permittivity were determined directly from the measured spectra using the Fresnel optical formulas for the complex transmission coefficient. The spectra in the infrared frequency range have been obtained using a Bruker IFS-113 Fourier-transform spectrometer. The experiments in external magnetic fields were performed in a superconducting split-coil magnet with polyethylene windows allowing to carry out reflectance experiments in magnetic fields up to 7 T.
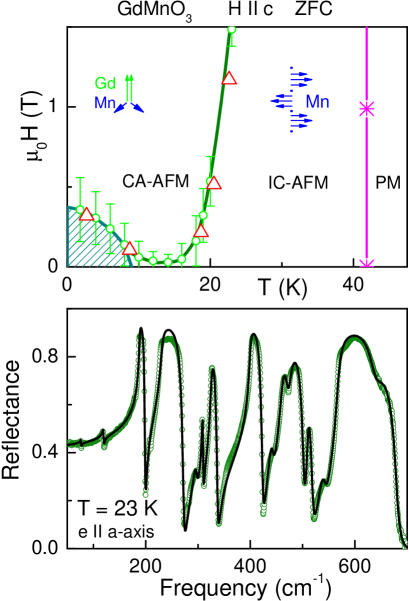
Lower panel: Reflectance of GdMnO3 with polarization along the a-axis and at phonon frequencies. Symbols: experiment, solid line: model calculation assuming the sum of 15 Lorentzians (see text).
The upper panel of Fig. 1 shows the H-T phase diagram of GdMnO3 for H c in the zero-field-cooled (ZFC) regime nphys which basically coincide with the diagrams published previously jo ; kimura05 . GdMnO3 is paramagnetic above K and transforms into an incommensurate antiferromagnetic (IC-AFM) state below this temperature. Depending upon the value of the external magnetic field along the c-axis, the magnetic state becomes canted antiferromagnetic (CA-AFM) below 20 K. For K and in low fields the spin structure reveals increasing complexity due to an additional ordering of Gd-subsystem. This region, which is indicated by a hatched area in the phase diagram of the upper panel of Fig. 1, is not further discussed in the course of this work. There is one important difference compared to the phase diagram published in Ref. jo : under zero-field cooling conditions no phase transition occurs and the AC-AFM state remains stable down to 9 K. This fact allows to switch between the magnetoelectric IC-AFM and the CA-AFM phases with very low fields. The IC-AFM region is especially interesting from the spectroscopic point of view, because unusual excitations of mixed magnetoelectric origin (electromagnons) exist nphys . As have been shown previously, the electromagnons are magnons which can be excited by the electric component of the electromagnetic wave. These excitations are suppressed in the CA-AFM state. It is the aim of this work to study magnetic-field and temperature dependence of electromagnons in a broad frequency range and to investigate their possible coupling to phonon modes.
The lower panel of Fig. 1 shows the reflectance spectrum of GdMnO3 at phonon frequencies and for the ac electric field component parallel to the crystallographic a-axis. We note that this direction of the electric field reveals large effects in the temperature and field dependence of the dielectric constant kimura05 and is especially important for the magnetodielectric effects in this compound. The solid line in the lower panel of Fig. 1 has been calculated using a sum of 15 Lorentzians. Here ten strongest excitations correspond to phonons polarized along the a-axis at frequencies 119, 188, 231, 308, 325, 400, 460, 475, 509, and 568 cm-1. Weaker features at 296, 441, 539, and 641 cm-1 are due to leakage of the b-axis component, most probably because of a small misorientation of the crystal. The weak excitation at 76 cm-1 is of unknown origin and might be due to a forbidden exchange excitations of Mn or Gd subsystem, which becomes IR allowed via strong magnetoelastic coupling.
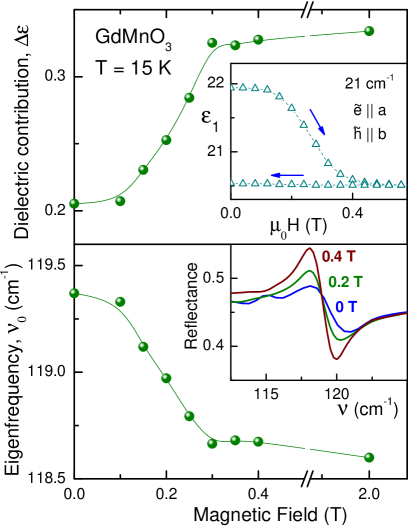
Except for the lowest frequency phonon at 119 cm-1, no measurable changes in the phonon parameters have been detected between different magnetic phases. On the contrary, the 119 cm-1 phonon, which is observed for a-axis polarization only, reveals substantial changes between the IC-AFM and CA-AFM phases. We recall that the peculiarity of this transition into the CA-AFM phase is the occurrence of strong magnetodielectric effects, e.g. the magnetic field dependence of the a-axis dielectric constant in the frequency range from zero to about one Terahertz ( cm-1) nphys . As have been shown previously nphys , these effects can be directly related to the existence of electromagnons at cm-1.
The magnetic field dependence of the 119 cm-1 phonon excitation on crossing the IC-CA magnetic phase boundary is shown in the lower inset of Fig. 2 which represents the reflectance spectra at three typical fields. The dielectric contribution (, strength of the mode) and the eigenfrequency () of the phonon are shown in the main panels. The transition is manifested by a significant softening of the phonon frequency and by a increase of the mode strength on increasing magnetic field. The characteristic fields and the width of the transition closely coincide with the corresponding changes of the dielectric constant at lower frequency, which is demonstrated in the upper inset of Fig. 2. The difference in on increasing and decreasing fields documents the meta-stable character of the IC-CA phase boundary. Similar behavior of the high- and low-frequency dielectric constant indicates that the same mechanism is operative for both effects, namely that at the IC-CA transition electromagnons are suppressed by the external magnetic field nphys .
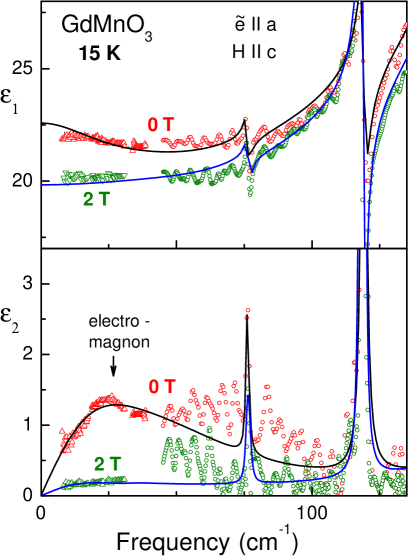
In order to analyze the interplay between electromagnons and phonons the complex dielectric permittivity has been calculated from the reflectance spectra via the Kramers-Kronig transformation adding the Terahertz spectra at low frequencies. The results both in IC-AFM (15 K, 0 T) and in CA-AFM state (15 K, 2 T) are shown in Fig. 3. Here the data above 40 cm-1 represent the results of the Kramers-Kronig analysis and the data below this frequency have been taken directly from the Terahertz transmittance experiments. The lower panel of Fig. 3 clearly demonstrates the over-damped almost relaxational nature of the electromagnon and its suppression by the external magnetic field. On the other hand, we know from Fig. 2 that the phonon mode at 119 cm-1 gains considerable spectral weight on increasing magnetic field. The substantial spectral weight which is removed from the low-frequency range, with the dielectric constant decreased for all frequencies below cm-1, is transformed into phonon intensity at 119 cm-1. In order to obtain the estimate of the spectral-weight transfer, the complex dielectric permittivity has been fitted assuming the phonon parameters as obtained from the fits of the reflectance and a single over-damped Lorentzian representing the electromagnon with cm-1, cm-1 and . Here is the damping. These parameters correspond to the maximum in at cm-1 and to the spectral weight cm-2. From the data in Fig. 2 the spectral-weight increase of the phonon is obtained as cm-2. Taking into account strong scattering of the data between 40 and 100 cm-1 we conclude rough coincidence of these values and the transformation of the spectral weight of the electromagnon into the phonon mode at 119 cm-1.
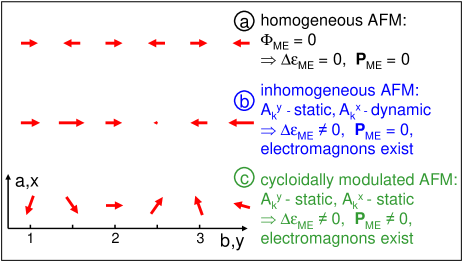
A remaining question is why electromagnons are observed both in GdMnO3, in a non-ferroelectric collinear magnetic structure, as well as in TbMnO3, in a ferroelectric with helical spin structure nphys . In order to understand this point, Fig. 4 provides a closer inspection of the free-ME energy in terms of the Fourier components of the dynamic variables related to the main AFM vector of modulated spin structure bertaut (see also Refs. lawes ; kenzelmann ):
| (1) | |||||
where is electric polarization. The ME coefficients for the nearest neighbors within the ab-plane are determined by , where are constants, the number of Mn ions, and the lattice constant. This expression was derived using the crystallographic symmetry (Pbnm space group) and a modulated spin structure with . We omitted weak contributions from other AFM vectors bertaut which exist in this structure. In space representation and continuum limit Eq. (1) corresponds to nphys , and for is reduced to Dzyaloshinski-Moriya type interactions katsura05 ; mostovoy ; sergienko .
It is clear that in a homogeneous magnetic state, like in the CA-AFM phase (Fig. 4a), the ME free energy is zero and no contribution to the dielectric constant, no electromagnons and no spontaneous polarization can exist. To obtain the ME contribution to the electric susceptibility in sinusoidal and spiral states we consider the total free energy of the system:
| (2) | |||||
where the first three terms correspond to exchange and anisotropy energies, the forth and fifth terms represent dielectric contributions from external electric fields and the last term is the spin entropy. By minimizing Eq. (2) with respect to the free energy can be represented as a function of the non-equilibrium values of . In a sinusoidal spin structure with and keeping only the main harmonic of the modulated structure, the electric susceptibility, e.g. along the a - axis, can be expressed as
| (3) | |||||
In the sinusoidal phase no spontaneous polarization can exist since only one component is nonzero, but the ME contribution to electric susceptibility arises according to Eq. (3). It originates from an electric field-induced rotation of the spins in the ab-plane, i.e. from spin components. Similar contribution can also exist along c-axis. Their relative values are determined by both, the corresponding magnetoelectric () and magnetic anisotropy () constants. Finally in case c) of Fig. 4 with helical or cycloidally modulated spins, e.g. , a spontaneous ferroelectric polarization along the c-axis , finite contribution to the dielectric constant along the a-axis , and electromagnons exist.
Very recently Katsura et al. katsura have calculated the collective mode dynamics of helical magnets coupled to the electric polarization. For the ac dielectric properties their main findings are the occurrence of two modes, one of which is derived from the phonon mode with a frequency close to the eigenfrequency of the uncoupled phonon, and one originating from the spin wave with a frequency proportional to , where is the spin value, the exchange coupling and the anisotropy. Using realistic parameters they calculate an electromagnon frequency of 10 cm-1, close to the experimental observation. It also follows from their calculation that in the electromagnetic phase the phonon eigenfrequency () is enhanced by , where is the frequency of the spin-plane rotation mode, which from the lower panel of Fig. 2 can now be estimated as 13 cm-1.
In conclusion, studying the low-frequency electrodynamics of GdMnO3 with a finite magneto-electric (ME) coupling, we were able to demonstrate i) the existence of electromagnons, ii) that these collective modes of ME magnets contribute to the static dielectric constant, and iii) that at the transition to a homogeneous magnetic phase with no ME coupling the electromagnons are wiped out and their spectral weight is transferred to an optical phonon, which in addition reveals a slight softening of the eigenfrequency. To conclude with an outlook for the future applications, a material with similar effects at room temperature will directly allow the design of a new class of magneto-optical devices. The dielectric constant and hence the refractive index can be tuned by moderate magnetic fields.
This work was supported by BMBF(13N6917B - EKM), by DFG (SFB 484), and by RFBR (04-02-16592, 06-02-17514).
References
- (1) N. A. Hill, J. Phys. Chem. B 104, 6694 (2000).
- (2) M. Fiebig, J. Phys. D: Appl. Phys. 38, R123 (2005)
- (3) D. Khomskii, J. Magn. Magn. Mater., in press (2006).
- (4) J. Hemberger et al., Nature 434, 364 (2005); S. Weber et al., Phys. Rev. Lett., Phys. Rev. Lett. 96, 157202 (2006).
- (5) T. Kimura et al., Nature 426, 55 (2003).
- (6) T. Kimura et al., Phys. Rev. B 71, 224425 (2005)
- (7) M. Kenzelmann et al., Phys. Rev. Lett. 95, 087206 (2005)
- (8) T. Arima et al., Phys. Rev. Lett. 96, 097202 (2006)
- (9) H. Katsura, N. Nagaosa, and A. V. Balatsky, Phys. Rev. Lett. 95, 057205 (2005).
- (10) M. Mostovoy, Phys. Rev. Lett. 96, 067601 (2006).
- (11) I. A. Sergienko and E. Dagotto, Phys. Rev. B 73, 094434 (2006).
- (12) G. Lawes et al., Phys. Rev. Lett. 95, 087205 (2005).
- (13) H. Katsura, A. V. Balatsky, and N. Nagaosa, cond-mat/0602547.
- (14) A. Pimenov et al., Nature Physics 2, 97 (2006).
- (15) J. Hemberger et al., Phys. Rev. B 70, 024414 (2004).
- (16) T. Goto et al., Phys. Rev. Lett. 92, 257201 (2004).
- (17) A. A. Volkov et al., Infrared Phys. 25, 369 (1985).; A. Pimenov et al., Phys. Rev. B 72, 035131 (2005).
- (18) E. F. Bertaut, in Magnetism, edited by T. Rado and H. Suhl (Academic, New York, 1963), vol. III, p.149.