Phase Behavior of Polyelectrolyte-Surfactant Complexes
at Planar Surfaces
Abstract
We investigate theoretically the phase diagram of an insoluble charged surfactant monolayer in contact with a semi-dilute polyelectrolyte solution (of opposite charge). The polyelectrolytes are assumed to have long-range and attractive (electrostatic) interaction with the surfactant molecules. In addition, we introduce a short-range (chemical) interaction which is either attractive or repulsive. The surfactant monolayer can have a lateral phase separation between dilute and condensed phases. Three different regimes of the coupled system are investigated depending on system parameters. A regime where the polyelectrolyte is depleted due to short range repulsion from the surface, and two adsorption regimes, one being dominated by electrostatics, whereas the other by short range chemical attraction (similar to neutral polymers). When the polyelectrolyte is more attracted (or at least less repelled) by the surfactant molecules as compared with the bare water/air interface, it will shift upwards the surfactant critical temperature. For repulsive short-range interactions the effect is opposite. Finally, the addition of salt to the solution is found to increase the critical temperature for attractive surfaces, but does not show any significant effect for repulsive surfaces.
pacs:
82.35.Gh, 82.35.Rs, 61.41.+eI Introduction
Complexation between surfactants and macromolecules has generated a great deal of research, both theoretically deGennes ; andelmanjoanny ; chatellier ; harries1 ; mbamala ; harries2 ; may ; tzlil ; tzlil2 ; roux ; gonzalez ; may1 ; bieshuvel ; netz and experimentally leonenko1 ; leonenko2 ; leonenko3 ; maier1 ; wu ; Ianoul ; merkle ; monteux1 ; monteux2 . This research is motivated in part by the role surfactant-macromolecule complexes plays in biological systems tzlil ; roux , where the adsorption of a variety of macromolecules onto charged lipid cell membranes is a precursor to many important biological processes.
The complexation of charged surfactants and macromolecules, besides its relevance to biological physics, carries interesting questions about the interplay of short-range interactions between surfactants and macromolecules, as compared with long-range electrostatic interactions. We consider a multicomponent monolayer where the possibility of a lateral phase demixing between the various constitutes exists and is characterized by a demixing (miscibility) curve in the temperature-concentration plane. For very long polyelectrolyte (PE) chains, the electrostatic interactions have two opposite effects on the adsorption. Electrostatic attraction between surfactants and PE chains increases the complexation, while the electrostatic repulsion between the PE monomers tends to decrease the complexation. This interplay also stimulated the interest in the adsorption of polyelectrolytes on oppositely charged surfaces wiegel ; muthu ; chatj ; varoqui2 ; varoqui1 ; joanny ; itamar1 ; itamar2 ; itamar3 ; us1 ; us2 ; wang1 ; borisov ; dobrynin .
Several authors have addressed a closely related problem of neutral polymers adsorbing on a surfactant monolayer chatellier ; tzlil ; roux . It was shown that for polymer-surfactant systems the surfactant demixing occurs for higher temperatures as compared to a pure surfactant system. Other works dealt with another similar problem of globular proteins (rigid macromolecules with no flexibility) adsorbed on charged membranes harries1 ; harries2 . A recent paper tzlil2 also deals with the adsorption of one flexible polyelectrolyte chain on a surfactant monolayer using Monte Carlo simulations. The possibility that the polyelectrolytes can desorb entirely from the charged surface when the solution has sufficiently strong ionic strength us1 was not previously discussed.
In this paper, we analyze the demixing of surfactants on the monolayer plane using numerical solutions of the mean-field equations. We find that the short-range interactions between the PE and the surfactants have a greater effect on the shape of the phase separation curve than the long-range electrostatics. Three regimes for the surfactant-polyelectrolyte complexes are found: (i) a depletion regime, where the polyelectrolytes do not adsorb at all onto the surfactant layer; (ii) an electrostatic adsorption regime, where the main attractive interaction between surfactants and polyelectrolytes is the electrostatic attraction; and (iii) a chemical adsorption regime, where the main interaction between the polyelectrolytes and the surface is short-ranged (chemical) and attractive. In the first two regimes, the surfactant demixing curve (binodal line) decreases in comparison to that of the pure surfactant monolayer, while in the third regime the demixing curve increases. We also find that for the electrostatic adsorption regime, the adsorbed amount for a system in the coexistence region is almost the same as a monophasic system with the same average concentration. In the chemical adsorption case the adsorbed amount increases more substantially due to the phase demixing.
The outline of this paper is as follows: we start by introducing the free-energy functional for a PE solution with salt in contact with a charged surfactant monolayer. In Sec. III we present our numerical results and discussion. In Sec. IV we present a simple scaling analysis for three limits: (i) PE depletion from a short-range repulsive surface; (ii) PE electrostatic adsorption to a short-range repulsive surface; and (iii) the short-range attractive surface case. Finally, we present some concluding remarks in Sec. V.
II Free Energy Formulation
Consider an aqueous solution of polyelectrolyte chains and salt ions. The bulk PE solution is in contact with a planar and rigid interface, on which resides an insoluble monolayer of charged surfactants. This monolayer can be thought of as a Langmuir monolayer at the air-water interface, or as the outer leaflet of a lipid bilayer membrane. The charged surfactants are assumed to be able to move freely on the interface, but can not dissolve into the solution (see Figure 1).
The free energy of such a system is composed of three contributions. The monolayer free energy , the solution free energy and the interaction free energy . We use a standard lattice-gas formalism andelmanjoanny to derive the demixing free energy of the surfactant monolayer:
| (1) | |||
where is the close packing area of the surfactant head groups. The first two terms account for the surfactant entropy of mixing, where is the surfactant area fraction. The third term represents a short-range interaction between the surfactants with as the interaction parameter. The fourth term is electrostatic contribution of the charged surfactant layer, where is the valency of the surfactant head group (assumed henceforth to be negative) and is the surface potential on the monolayer plane in units of .

Without the fourth term, is the free energy commonly used for neutral Langmuir monolayers. For simplicity, we take it to be symmetric under the exchange of and . The non-convexity of implies that there is a demixing region with two phases: (i) a dense phase with high surfactant concentration, and (ii) a dilute phase with low surfactant concentration. The phase demixing curve is determined by:
| (2) |
where is the binodal line. Below a critical value and for the monolayer phase separates into two coexisting phases. Inside the coexistence region, another line of interest is the spinodal line, satisfying . The spinodal line, separating the unstable and metastable regions with respect to surfactant density fluctuations, is given by:
| (3) |
Its maximum coincides with that of the binodal line at the critical point, and . Therefore, examination of the spinodal line gives a good initial approximation to the phase behavior.
The free energy of the bulk PE and salt solution, , is more complex, and is composed of three parts: (i) the polymer free energy ; (ii) the small ion entropy ; and (iii) the electrostatic free energy . The polymer free energy is itamar1 :
| (4) |
where the first term accounts for the polymer chain flexibility with the monomer size, the bulk concentration of monomers and the local monomer concentration renormalized by its bulk value. The parameter is the polymer excluded volume (second virial) coefficient. The second term originates from the excluded volume interactions between the monomers as well as the equilibrium condition of the PE solution in contact with a bulk reservoir.
The change in small ion entropy with respect to the reservoir is:
| (5) |
where is the local concentration of the positive and negative ions and is their bulk concentration.
The last term of , the electrostatic energy, is:
| (6) | |||
where the dimensionless electrostatic potential (rescaled by the temperature) is . The first three terms are the interaction of the electrostatic potential with the positive ion, negative ion and polyelectrolyte concentrations, respectively, where the parameter is the fraction of charged monomers on the PE chain. The last term is the self-energy of the electric field, where is the Bjerrum length. For water with dielectric constant at room temperature K, is equal to about Å.
The last contribution to the free energy, the non-electrostatic interaction free energy , can be written as chatellier :
| (7) |
In the above is the renormalized monomer concentration at the surface, . The strength of the PE-surfactant interaction is defined by a phenomenological parameter , which has usints of volume. For positive values of , the short-range interaction of the PEs with the surfactant is more favorable than those between the PE and the bare interface, while for the opposite occurs. At concentration the surface is indifferent (“special transition” line) deGennes ; chatellier . For and low surfactant concentrations , the short-range interactions between the surface and the PE are repulsive, while for higher surfactant concentrations these interactions are attractive.
In order to find the equilibrium state of the PE-surfactant system we minimize the total free energy, with respect to the local small ion densities , electrostatic potential and monomer order parameter . This minimization yields the following equations itamar1 ; itamar2 ; us1 :
| (8) |
| (9) |
where is the Debye-Hückel length scale for the screening of the electrostatic potential in the presence of added salt and is the corresponding length for the potential decay due to counterions. Note that the actual decay of the electrostatic potential is determined by a combination of salt, counterions, and polymer screening effects.
The solution of Eqs. (8) and (9) requires four boundary conditions. Two of them are chosen at the bulk, far from the surfactant monolayer, and two at the surfactant layer. At the bulk we set the electrostatic potential as , while the monomer concentration is set equal to the bulk monomer concentration . The other two boundary conditions are obtained by integrating Eqs. (8) and (9) from to a small distance near the surface incorporating the surface interactions of Eqs. (8), (9):
| (10) | |||||
| (11) |
Equation (10) is the usual electrostatic boundary condition for a given surface charge density , while Eq. (11) is the Cahn - de Gennes boundary condition degennes , which is often used for neutral polymers joanny .
Equations (8)-(11) are solved numerically using the relaxation method nr , as was described previously us1 . For each surfactant concentration, we calculate the value of for which , corresponding to the spinodal curve. Then the full binodal line is calculated numerically. We find that despite the electrostatic interactions between the surfactants and the PE chains, the main characteristics of the spinodal and binodal lines depend on the short-range (non-electrostatic) PE-surfactant interactions. There are two main regimes for the demixing curve. For large and positive values (short-range attractive surface), the demixing curve is shown to be always higher than the pure monolayer one, Eq. (3). For large negative values (short-range repulsive surface), the curve is always lower than the pure one, Eq. (3).
In order to incorporate the temperature dependence of the various parts, we note that , the inverse Flory-Huggins parameter, is proportional to the temperature . The chemical interaction strength parameter is proportional to . The other parts of the free energy have a weaker dependence on , which can be ignored in this simple model chatellier . Their contribution is neither purely enthalpic nor purely entropic, and is less significant. Therefore, in order to simulate the change in temperature in our simple model, we follow the method shown previously in Ref. chatellier and choose to be constant.
III Numerical Results
III.1 The Three PE-Surfactant Regimes
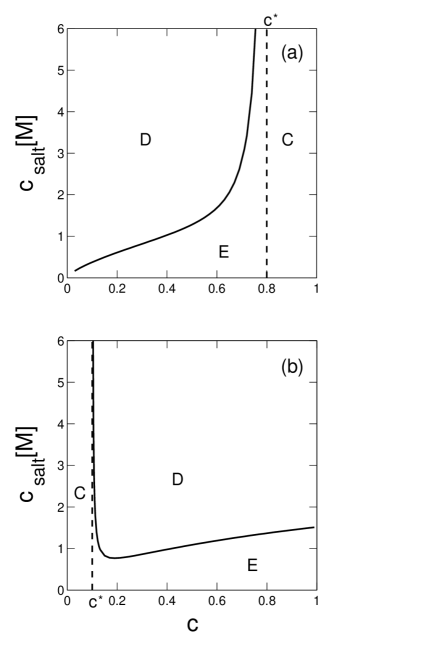
We find three distinct regimes for the PE-surfactant system. These regimes are presented in Fig 2, and discussed more thoroughly in Sec. IV. For repulsive surfaces, very low and high , the PEs deplete from the interface. The high amount of salt screens the electrostatic interactions between the constituents of the solution, and the free energy can be written as a sum of three terms: an interface term, a neutral polymer term and a salt solution term. For higher , short-range repulsive surfaces and low salt, the PEs adsorb electrostatically on the surface. In this case, the free energy is dominated by the electrostatic attraction between the PE chains and the surfactant layer. For the opposite case of sort-range attractive surfaces, the adsorption is dominated by the short-range attraction.
In Fig. 2a we present the phase diagram in the plane (, ) differentiating the three regimes in the case of , namely, when the surfactant-PE interaction is more favorable than the PE - bare surface interaction. For , in the area marked E, the short-range interaction between the surface and the PE chains is repulsive, and the adsorption is dominated by the electrostatic attraction between the PEs and the surfactants. For high amounts of added salt, this electrostatic attraction is screened, and the PE chains deplete (marked D). For , (marked C) the PE chains chemically adsorb on the surface for all . The electrostatic interactions in this region are dominated by the monomer-monomer electrostatic repulsion, and hence the addition of salt increases the adsorption, rather than causing depletion. In Fig. 2b we show the opposite case of . In this case the line separating the phases is no longer monotonic. For , the adsorption is mainly chemical, and is enhanced by addition of salt. For , the adsorption becomes electrostatic and depends on . The amount of salt necessary for depletion decreases with for low since the increase in increases the short-range repulsion between the surface and the PE chains, while the surface charge is not strong enough to electrostatically attract the PEs. For higher , the increase in the surface charge with increases mainly the electrostatic adsorption, and the necessary amount of salt increases with .
III.2 The Demixing Curve
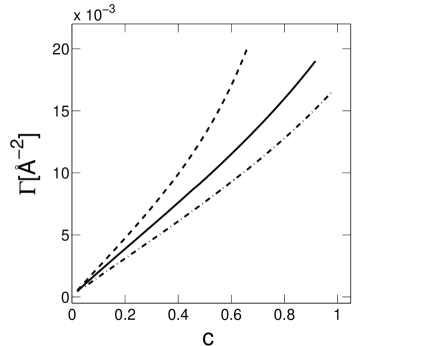
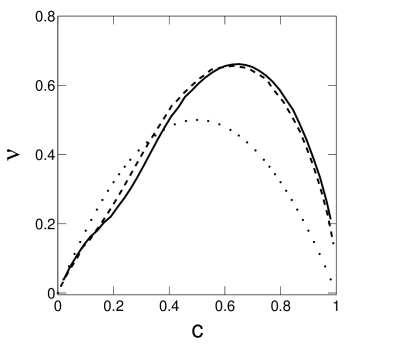
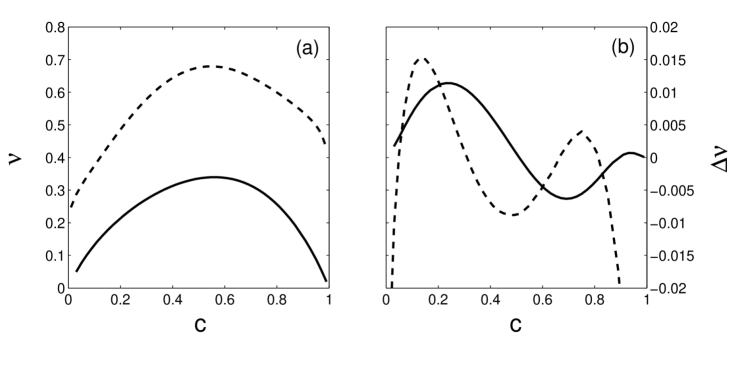
Repulsive Surface The spinodal lines of repulsive PE-surfaces () for several values of are presented in Fig. 3a. The spinodal of the pure surface monolayer, Eq. (3), is shown to be always higher than any of the charged-surface spinodals. All three spinodal lines are almost symmetric under the change , and the critical points are very close to the
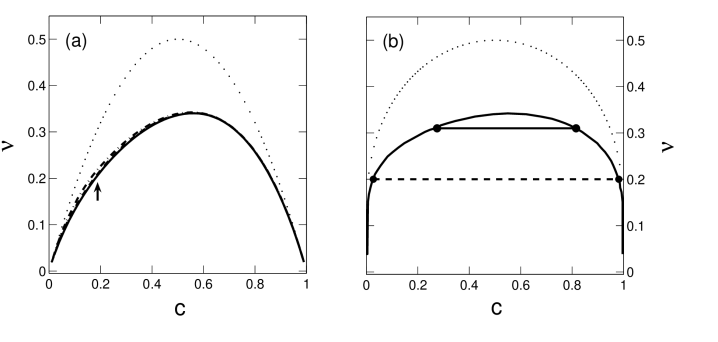
pure surface one at . In Fig. 3b we present the binodal line of a repulsive surface for M. The binodal line of the pure surface, Eq. (2), is also presented, and is higher than the numerical binodal for all . Like the spinodal line, the numerical binodal is almost symmetric with respect to the change . For high values, all spinodal lines of Fig. 3a overlap almost identically, showing that the dependence of the spinodal on the amount of added salt is very weak. For low values, careful observation of the three spinodal lines shows a difference between the lines, where the low salt lines are higher than the high salt ones. The three lines join together at (see arrow). This difference between the spinodal lines results from the PE depletion at low . For low values, the spinodal resembles a depletion spinodal, where addition of salt has a strong effect on the spinodal. For higher values, the surface charge is high enough to allow PE adsorption. All three lines then move toward the electrostatic adsorption spinodal, that is weakly dependent on salt. The point where all lines join together is where the high salt spinodal crosses over from the depletion regime to the electrostatic adsorption regime, and its numerical value agrees with the adsorption-depletion crossover at M of salt taken from Fig. 4. The spinodal lines in the different regimes are discussed further in Sec. IV.
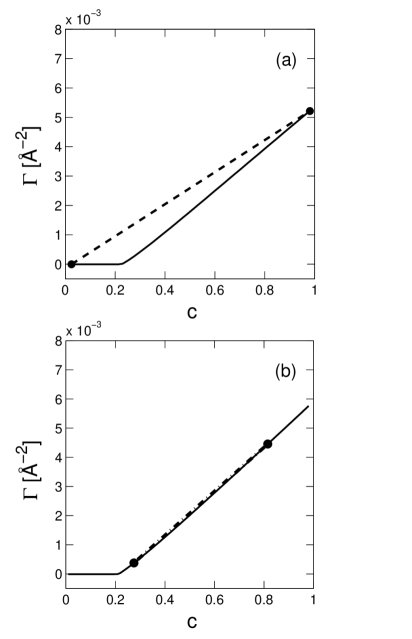
In Fig. 4 the adsorbed amount is plotted as a function of the surfactant surface coverage for M. We set in Figs. 4a, 4b, respectively. The adsorption is seen to be positive only from a threshold surface coverage , which is similar to the crossover point between spinodal lines shown in Fig. 3. Above this threshold, the adsorbed amount increases linearly with the surface coverage, in agreement with previous results us1 ; us2 . The threshold is found not to change with .
It is interesting to note the effect of the adsorption-depletion crossover on in the coexistence region. In Fig. 3b we mark on the binodal line the coexisting phases for (dashed line) and for (dashed-dotted line). In Fig. 4 we show for the same coexisting phases. Using the lever rule construction chatellier , inside the phase coexistence lies on a straight line between the two marked phases. For (dashed line in Fig. 4a), the PE adsorbs in one of the phases while depleting from the other. As a result, the adsorption in the phase separated region is always higher than onto a reference single phase (solid line), having the same mean surface coverage , For the PE adsorbs on the two coexisting phases. The adsorption in the phase separated region (dashed-dotted line in Fig. 4b) is almost identical to the adsorption to the single corresponding mixed phase (solid line), and there is no gain in the adsorption due to demixing.
The difference between these two behaviors can be qualitatively explained by the following argument. In the electrostatic adsorption case, the adsorbed amount of monomers scales linearly with the surface charge itamar1 , and hence also with . The adsorption of the PE chains aims mainly to balance the surface charge, and since the demixing does not change the overall surface charge, the total adsorbed amount does not change as well. In the case of a depletion phase- adsorption phase coexistence, the charges on the low (depletion) domain are screened by salt ions, while the higher surface charge domains are screened by the PE chains. In this case, even if the total surface charge is too weak to allow PE adsorption in a single mixed phase, the phase separation allows adsorption at a part of the surface area, and thus allows for a positive adsorbed amount. The crossover between these two behaviors is at , corresponding to the low phase being at . Namely, that the low phase is at the adsorption-depletion transition.
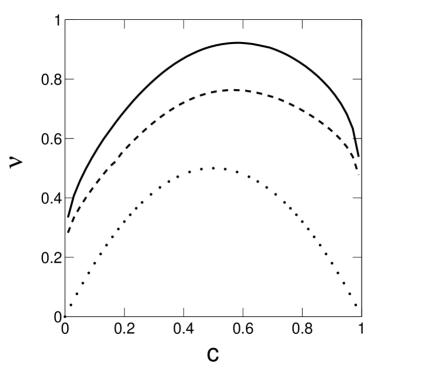
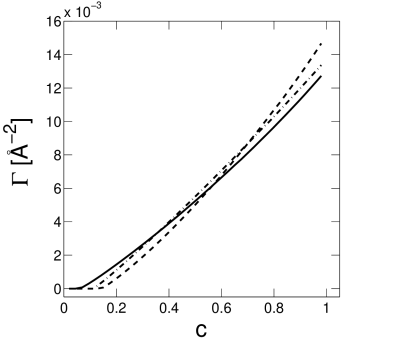
Short-Range Attractive Surface The opposite case of a short-range attractive surface is presented in Fig. 5. As can be seen from the figure, the spinodal line is much higher than the corresponding pure-surface spinodal line, and it is far less symmetrical. The addition of salt is shown to increase the spinodal temperature. This increase with salt can be explained by both the screening of the electrostatic repulsion between the lipids, and by the increase in the adsorbed amount of monomers in this case us2 , which increases the effective attraction between the lipids. The corresponding adsorbed amount of monomers is shown in Fig. 6. The adsorbed amount here is convex in , showing that the adsorption to a demixed two-phase system is always larger than to a single phase system.
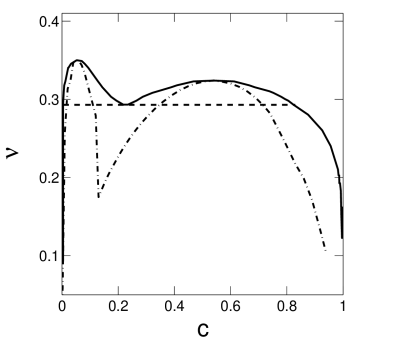
Attractive-Repulsive Crossover In Fig. 7 we show the spinodal lines of monomers for and both M and M. It is easily seen that the low salt spinodal is higher than the high salt one for (repulsive surface), while the opposite occurs for , consistent with Fig. 5. Although all three regimes occur in this spinodal, the curve has only one critical point, located near the crossover between the spinodal behavior of the electrostatic adsorption limit to the chemical adsorption limit, at . This shows that the transition of the spinodal line between the regimes is gradual rather than abrupt. The M line changes convexity at , creating a “shoulder” in the spinodal. This shoulder marks the transition from a depletion regime to an electrostatic adsorption regime. For extremely strong short-range interactions (very high ), this shoulder may transform into a triple point on the spinodal. However, we did not find such a triple point numerically for reasonable values of our parameter.
In Fig. 8 the adsorbed amount for is plotted against the surface coverage . For low values, we see the PEs deplete, similar to Fig. 4, while for higher the adsorption crosses over from a linear electrostatic adsorption profile to a convex chemical adsorption profile. The addition of salt decreases the adsorption for low values, and increases it for higher surface coverage. Note, however, that the crossover between the two salt dependencies is not at but for a lower . This result is in agreement with a previous one us2 , which shows that when the short-range repulsion between the surface and the PE chains becomes small enough, the adsorbed amount starts to increase with even before the surface becomes attractive, due to an increase in the surface monomer concentration .
So far we discussed the case where the short-range interactions between the PE chains and the surfactant are more favorable than with the bare surface (). In the case of a neutral polymer, changing the sign of is exactly equivalent to replacing and . However, in our case the fact that the surfactant and polymers are oppositely charged breaks this symmetry.
For very strong short-range interactions (large negative ) and , a triple point can emerge in the following way. For low values, the spinodal resembles the attractive surface spinodal. The spinodal line in this region is always higher than the pure surface spinodal Eq. (3), as was shown in Fig. 5. For , the spinodal line decreases substantially to the depletion spinodal, and for it moves to the electrostatic adsorption spinodal. Both of the latter spinodal lines are similar to those in Fig. 3a, both are lower than the pure surface spinodal, and have a critical point at . Therefore, there must be a triple point at , connecting three coexisting phases: (i) a low chemical-adsorption phase; (ii) a low adsorption phase; and (iii) an electrostatic adsorption phase, as shown in Fig. 9.
In Fig. 9 we show the numerically calculated triple point corresponding to the above conditions. At high temperatures , the phase coexistence for low surface coverage connects a chemical-adsorption phase with either another chemical adsorption phase, or a depletion phase. For higher surface coverage, the phase coexistence connects either a depletion phase or an electrostatic adsorption phase with another electrostatic adsorption phase. A triple point connecting all three phases occurs for .
IV Analytical Results
In this section we present a theory to explain the three PE-surfactant regimes, and, in particular, aimed at explaining the physics behind the spinodal behavior in each regime. We derive an approximate form for the free energy in each regime, and show the resulting spinodal line. Our model is based on the scaling results of Refs. itamar1 ; us1 , and is shown to capture the correct behavior of the spinodal lines in each limit. The analytical equations can be compared to the numerical results with good accuracy, as shown below.
IV.1 Polyelectrolyte Depletion Regime
When the surface repels the PE chains, and thus the only driving force for adsorption is the electrostatic attraction between the surfactants and the PE chains. This electrostatic attraction strongly depends on the amount of small ions in the solution us1 . When this amount increases beyond a threshold value, the salt ions neutralize the surface and PE charges, and the solution behaves like a neutral polymer solution. In this case, the repulsive short-range interaction between the PE chains and the surface causes the PE chains to desorb entirely from the surface. This threshold value of salt was previously shown us1 to depend on the surface charge density of the interface and on the charge of the PEs via the scaling law . This relation can be inverted to give a threshold surfactant concentration :
| (12) |
below which the PE chains do not adsorb on the charged surface. The prefactor can be calculated by comparison of Eq. (12) with the numerical results as in Figs. 3-4, yielding .
When the PE chains desorb from the surface, the electrostatic potential depends only on the adsorption profile of the small ions. According to the well known Poisson-Boltzmann theory andelmanmembranes , this decay is exponential as function of the distance from the surface . This exponential decay causes the interaction term between the PE chains and the electrostatic potential in Eq. (6) to be small in comparison to the other terms. The free energy hence decouples and describes a neutral polymer and an ionic solution. Using the Debye-Hückel approximation for the small electrostatic potentials, the total free energy becomes:
The second term is the free energy of a solution of small ions under the Debye-Hückel approximation, the third term is the free energy of a neutral polymer solution as in Ref. chatellier , and the first term is the free energy of the neutral surfactant monolayer:
| (14) | |||
where we note that the surface charge term was already taken into account in the small ion solution term of Eq. (IV.1). Differentiating this free energy twice with respect to , we obtain the following equation for the spinodal:
| (15) | |||||
The first term of the spinodal Eq. (15) is the pure surfactant monolayer spinodal as in Eq. (3), while the second term accounts for the electrostatic interactions between the salt ions and the surface and the third term for the neutral polymer solution chatellier . The neutral polymer term, as was shown in Ref. chatellier , causes the spinodal line to increase slightly. The magnitude of this term is inversely proportional to the short-range interaction strength , and can be discarded in the limit of strong short-range repulsion. The salt term, in turn, pushes the spinodal line downwards, as was previously shown by Ref. harries1 ; harries2 . The decrease in the spinodal line is substantial, and depends on the amount of added salt. In this (Debye Hückel) approximation, for very large amounts of added salt all electrostatic interactions between the monomers and the surfactants are totally screened, resulting in a strong decrease in . The spinodal line then fully recovers the neutral polymer limit from Ref. chatellier . For lower amounts of salt, which include most physical cases, the spinodal is pushed downwards from the pure monolayer spinodal, as seen in Fig. 3a.
IV.2 Electrostatic Adsorption Regime
For and , the PEs are attracted to the surface only via their electrostatic interactions, but cannot approach the surface because of the short-range repulsive interactions. Due to the exclusion from the surface, the PE surface concentration becomes very small, and can be ignored at first approximation.
In previous publications itamar1 ; us1 ; us2 , we discussed at length the adsorption of polyelectrolytes to charged surfaces, which have short-range repulsive interactions with the PE chains. We summarize here the main results. It was shown that the dominant interaction is the electrostatic interaction between the PE and the surface. The excluded volume interaction was found to be negligible in the numerical solutions of the mean-field Eqs. (8,9). The PE adsorption was shown to decrease with the addition of salt us1 ; us2 for low amounts of added salt, while for higher amounts the polymer chains were shown to desorb entirely from the surface us1 . It was shown that the adsorbed polyelectrolyte layer can be characterized by a single (rescaled) monomer concentration scale (denoted by ) and a single length scale for the adsorbed layer width (denoted by ). The free energy of the solution can be calculated using a Flory-like approximation itamar1 . While the full details can be found in the previous publications, we present here the main results:
| (16) | |||
where the surface charge is denoted by . The first term is the elasticity term of the polyelectrolyte, the second is the electrostatic attraction between the surface and the monomers, and the third is the electrostatic repulsion between monomers. This repulsion is assumed to be strong enough to dominate over the excluded volume interactions. The last term is the interaction of the electrostatic potential and the surface charge, where the rescaled potential is . The short-range interaction between the surfactants and the PE chains depends on the surface monomer concentration, and can be ignored because of the strong short-range repulsion. Minimization of Eq. (16) with respect to and yields:
| (17) | |||||
| (18) | |||||
| (19) |
where the prefactor can be shown to be positive. In this case, the full free energy can be written as:
Note that this free energy has a fractional power (non-analytic) in . The spinodal equation is obtained by differentiating Eq. (IV.2) twice with respect to , yielding:
| (21) |
Eq. (21) shows that the spinodal temperature is always lower than that of the pure surfactant monolayer, Eq. (3). This result is consistent with results derived for the spinodals of protein solutions may ; harries1 . The critical point is the maximum of this spinodal line in Eq. (21), satisfying:
| (22) |
The critical point is at , regardless of the sign of . For our chosen parameters of Å, , Å, Å and the critical concentration from Eq. (22) turns out to be at , showing that the spinodal is almost symmetric, in agreement with Fig. 3.
IV.3 Strong Short-Range Attraction Regime
For large enough (strong short range attraction) the adsorbing polymer layer is highly charged, more than the initial surface wang1 ; us2 . In this case, the main electrostatic contribution to the free energy comes from the monomer-monomer repulsion, rather than the electrostatic attraction to the surface.
When the amount of small ions in the solution is small, the length scale for electrostatic potential decay is the same as that of the monomer concentration. The single length scale allows us to use similar scaling ideas as in the repulsive surface case. The highest monomer concentration occurs at the surface itself , and acts as the scale for the monomer concentration. Similarly to Ref. itamar1 , we can produce scaling rules for the monomer adsorption using a Flory-like free energy. The free energy in this case is:
| (23) | |||
where the first term is again the contribution of the chain elasticity, the second term is the short-range attraction of the polymer chains to the surface, and the last term is the electrostatic repulsion between the monomer layers. The electrostatic interactions between the surface and the monomer concentrations are assumed to be small in comparison to the short-range ones, and are omitted from this free energy. Minimization of this free energy yields the following scales for and :
| (24) | |||||
| (25) | |||||
| (26) |
where is a constant of order unity. The adsorption free energy is negative, as expected, and is very strongly dependent on the strength of the short range interactions. The total free energy is now the sum of the pure monolayer free energy and the adsorption free energy, and the spinodal line can be readily obtained as:
| (27) |
where we denote . In this case, the spinodal temperature is always larger than the corresponding temperature of the pure-surface spinodal. The critical point is obtained by differentiating Eq. (27) once more with respect to .
| (28) |
which for gives , and vice versa. The resulting spinodal line is less symmetric than in the
electrostatic adsorption case, and the critical point is further from the pure surface value of than the repulsive-surface spinodal Eq (21). This result is also in agreement with the numerical results of Fig. 5.
IV.4 Comparison of the analytical and numerical results
Both spinodals, Eqs. (21,27), contain one free parameter each, and can be compared to the numerical spinodals. The comparison is presented in Fig. 10. As can be seen, both of the spinodal equations show good agreement with the numerical lines, using the values for the repulsive surface case and for the attractive surface case.
The analytical model given above for the two adsorption regimes is accurate only for the case of low amounts of added salt. This is because the main assumption is the existence of a single length scale for the decay of the electrostatic potential and the monomer concentration. More work is necessary to extend the present model for the high salt regime.
V Conclusions
We present numerical and analytical results for the phase separation of a surfactant monolayer in presence of polyelectrolytes (PEs). We show that the short-range interactions between the surfactant and polyelectrolytes have a strong impact on the surfactant critical temperature and critical concentration. We also present analytical results in two limits: (i) strong short-range repulsive, and (ii) attractive surfactant-polyelectrolyte interactions.
For short-range repulsive interactions, our results show that surfactant phase separation occurs for lower temperatures than for a non-interacting surfactant layer. For such systems, the polyelectrolyte chains may desorb completely from the low surfactant concentration domains, while for higher concentration phases the PE adsorption increase linearly with the surfactant surface coverage. The critical surfactant concentration slightly deviates from the bare one , showing nearly symmetrical spinodal and binodal lines. In addition, we find a temperature range in which phase separation does not increase the PE adsorption. For lower temperatures, where the phase separation occurs between a strongly adsorbing phase and a depleting phase, the gain in adsorption becomes substantial. For short-range attractive interactions, in contrast, the phase separation always increases adsorption, and the demixing temperatures are always larger than the pure-surface ones. The critical point moves more significantly away from the pure-surface symmetric value. The convexity of the adsorption is more pronounced, showing that phase separation indeed increases the PE adsorption on the surfactant monolayer. In intermediate cases, where the short-range interaction between the polyelectrolyte chains and the surface changes sign as function of the surfactant surface coverages, a triple point can be found on the binodal line connecting three coexisting phases on the same surface.
The addition of salt is shown to increase the threshold surfactant-concentration for the desorption phase. It has a weaker effect on the spinodal line for the case of electrostatic adsorption. For short-range adsorbing surfaces, the addition of salt increases the spinodal line considerably.
Our results are derived within mean-field, using the ground state dominance approximation. This treatment neglects correlation effects between the different constituents, and they may be strong in some cases. We also assume that the lipids are entirely insoluble, and neglect the effects of the line tension between the surfactant phases. Despite these drawbacks, we believe that our main results still hold. Our results may serve as a starting point for more complex models.
Acknowledgments: We thank Avinoam Ben-Shaul, Yoram Burak and Shelly Tzlil for helpful discussions. Support from the Israel Science Foundation (ISF) under grant no. 160/05 and the US-Israel Binational Foundation (BSF) under grant no. 287/02 is gratefully acknowledged.
References
- (1) P.G. de Gennes, J. Phys. Chem. 94, 8407 (1990).
- (2) D. Andelman, J-F Joanny, J. Phys II (France) 3, 121 (1993).
- (3) X. Chatellier, D. Andelman, J. Phys. Chem. 100, 9444 (1996).
- (4) D. Harries, S. May, A. Ben-Shaul, Coll. and Surf. A 208, 41 (2002).
- (5) S. May, D. Harries, A. Ben-Shaul, Phys. Rev. Lett. 89, 268102 (2002).
- (6) C. L. Baciu, S. May, J. Phys.: Condens. Matter 16, S2455 (2004).
- (7) E.C. Mbamala, A. Ben-Shaul, S. May, Biophys. J. 88, 1702 (2005).
- (8) S. Tzlil, M. Deserno, W.M. Gelbart, A. Ben-Shaul, Biophys. J. 86, 2037 (2004).
- (9) S. Tzlil, A. Ben-Shaul, BioPhys. J. 89, 2972 (2005).
- (10) D. von Effenterre, D. Roux, Europhys. Lett. 64, 543 (2003).
- (11) O. González-Amezcua, M. Hernández-Contreras, J. Chem. Phys. 121, 10742 (2004).
- (12) May S., J. Phys:Condens. Matter 17, R833 (2005).
- (13) P.M. Biesheuvel, M. van der Veen, W. Norde, J. Phys. Chem. B 109, 4172 (2005).
- (14) C. Fleck, R.R. Netz, H.H. von Grünberg, Biophys. J. 82, 78 (2002).
- (15) Z. Leonenko, D. Cramb, Nano Letters 2, 305 (2002).
- (16) Z. Leonenko, D. Merkle, S.P. Lees-Miller, D.T. Cramb, Langmuir 18, 4873 (2002).
- (17) Z.V. Leonenko, E. Finot, H. Ma, T.E.S. Dahms, Cramb D.T, Biophys. J. 86, 3783 (2004).
- (18) B. Maier, J.O. Rädler, Macromolecules 33, 7185 (2000).
- (19) C. M. Wu, L. Willisa, H.L. Chen, T.L. Lin, U.S. Jeng, Macromolecules 37, 4974 (2004).
- (20) A. Ianoul, P. Burgos, Z. Lu, R.S. Taylor, L.J. Johnston, Langmuir 19, 9246 (2003).
- (21) D. Merkle, S.P. Lees-Miller, D.T. Cramb, Biochemistry 43, 7263 (2004).
- (22) C. Monteux, M-F Llauro, D. Baigl, C.E. Williams, O. Anthony, V. Bergeron, Langmuir 20, 5358 (2004).
- (23) C. Monteeux, C.E. Williams, V. Bergeron, Langmuir 20, 5367 (2004).
- (24) F.W. Wiegel, J. Phys A: Math. Gen. 10, 299 (1977).
- (25) M. Muthukumar, J. Chem. Phys. 86, 7230 (1987).
- (26) X. Chatellier and J.F. Joanny, J. Phys. II (France) 6, 1669 (1996).
- (27) R. Varoqui, A. Johner, A. Elaissari, J. Chem. Phys. 94, 6873 (1991).
- (28) R. Varoqui, J. Phys. II (France) 3, 1097 (1993).
- (29) J.F. Joanny, Eur. Phys. J. B. 9, 117 (1999).
- (30) I. Borukhov, D. Andelman, H. Orland, Macromolecules 31, 1665 (1998); Europhys. Lett. 32, 499 (1995).
- (31) I. Borukhov, D. Andelman, H. Orland, Eur. Phys. J. B 5, 869 (1998).
- (32) I. Borukhov, D. Andelman, H. Orland, J. Phys. Chem. B 103, 5042 (1999).
- (33) A. Shafir, D. Andelman, R.R. Netz, J. Chem. Phys. 119, 2355 (2003).
- (34) A. Shafir, D. Andelman, Phys. Rev. E 70, 061804 (2004).
- (35) Q. Wang, Macromolecules 38, 8911 (2005).
- (36) O.V. Borisov, E.B. Zhulina, T.M. Birshtein, J. Phys. II (France) 4, 913 (1994).
- (37) A.V. Dobrynin, A. Deshkovski, M. Rubinstein, Macromolecules 34, 3421 (2001).
- (38) P.G. de Gennes, Macromolecules 14, 1637 (1981).
- (39) W.H. Press, B.P. Flannery, S.A. Teukolsky, W.T. Vetterling, Numerical Recipes in C: The Art of Scientific Computing, (Cambridge University, Cambridge 1992), Chap. 17, p. 762.
- (40) D. Andelman, in “Handbook of Biological Physics: Structure and Dynamics of Membranes”, Vol. 1B, edited by R. Lipowsky and E. Sackmann, (Elsevier Science B.V., Amsterdam, 1995), Chap. 12, p. 603.