Asymmetric response of a jammed plastic bead raft
Abstract
Fluctuation-dissipation relations have received significant attention as a potential method for defining an effective temperature in nonequilibrium systems. The successful development of an effective temperature would be an important step in the application of statistical mechanics principles to systems driven far from equilibrium. Many of the systems of interest are sufficiently dense that they are close to the jamming transition, a point at which interesting correlations develop. Here we study the response function in a driven system of plastic beads as a function of the density in order to elucidate the impact of the jamming transition on the use of fluctuation-dissipation relations. The focus is on measuring the response function for applied shear stress. We find that even when the amplitude of the applied stress leads to a linear response in the strain, the time scale of the response is dependent on the direction of the applied stress.
pacs:
05.70.Ln,61.20.Lc,83.50.AxThe identification of an “effective temperature” for systems driven far from equilibrium that is analogous to a true thermodynamic temperature would represent a major step toward developing a general theory of nonequilibrium behavior. One of the reasons that the concept of an “effective temperature” is so attractive is the centrality of real temperature in thermodynamics and statistical physics. At its most basic, temperature defines when two systems are in thermodynamic equilibrium and determines the direction of heat flow, if any, for systems in contact. Equipartition provides a connection between temperature and average quantities. Temperature enters the relation between thermodynamic quantities, such as specific heat and derivatives of free energies. Einstein-type relations relate various transport coefficients, such as diffusion constants and viscosities, through the temperature. Finally, in linear response theory, temperature enters the relationship between time (or frequency) dependent response functions and correlation functions. The challenge for studies of nonequilibrium systems is the determination of which, if any, of the above uses of temperature is meaningful as an effective temperature. To be a useful concept, a minimum expectation is that multiple definitions of effective temperature agree, and that there is an understanding of why some definitions agree and others do not.
The use of effective temperatures in driven systems has a relatively diverse history. For example, granular flows are often characterized by a “granular” temperature that is based on the average kinetic energy of the particles. Another approach can be described as a “configurational” temperature. In these studies, (usually with dense granular matter) the “atoms” are grains, and the phase space is the set of static mechanical configurations in which they can be arranged. By considering all possible jammed configurations, entropy as a function of density is calculated and used to define an effective temperature Cugliandolo and Kurchan (1999); Han and Grier (2004); Edwards and Makse (2005). Another approach has been to focus on fluctuations in the system as a means of defining a temperature. In this case, the probability distribution of an appropriate macroscopic variable, such as the power or stress, is studied, and the temperature is related to various measures of this distribution. This approach has been used in turbulent fluid systems Ciliberto et al. (2004); Goldburg et al. (2001); Toth-Katona and Gleeson (2003) and driven complex fluids D’Anna et al. (2003); Feitosa and Menon (2004).
In this paper, we focus on definitions of effective temperature based on the relationship between linear response functions and correlation functions Cugliandolo et al. (1997); Zamponi et al. (2005). There are two basic approaches: static response theory relating equal time fluctuations with infinite-time response and time-dependent methods. Considering a number of different static response relations, it was found that multiple definitions of effective temperature converge to the same value within the context of an athermal model of foam Ono et al. (2002). In contrast, the use of time-dependent relations have revealed the impact of multiple time scales on the dynamics. In simulations of driven, thermal systems, it has been shown that the system exhibits the real temperature at short times, but it has a higher effective temperature on long time scales Berthier and Barrat (2002). In this case, the static effective temperature and time-dependent effective temperature do not (and can not) agree with each other. A recent surprising result is that when considering different conjugate pairs of variables, the static effective temperature determined from one pair can agree with the time-dependent effective temperature from a different pair O’Hern et al. (2004). The conditions for such agreement are not yet understood, but recent simulation work for granular systems suggests interesting directions of study Potiquar and Makse (2006).
Experiments probing fluctuation-dissipation measures in granular systems have considered both diffusivities (a static measurement) Utter and Behringer (2004) and the time-dependent fluctuation dissipation relationship Song et al. (2005). The results on diffusivities is consistent with simulations, at least in the sense that effective temperatures from equipartition definitions do not tend to agree with fluctuation-dissipation definitions if the inertial terms are not relevant. The fluctuation-dissipation work considered a single definition of temperature for a range of particle probe properties Song et al. (2005), but it remains to compare different definitions of effective temperature experimentally. Finally, an interesting system that has been studied is ping-pong balls driven by flowing air. In this case, the fluctuation-dissipation relation has been confirmed Ojha et al. (2004).
In this paper, we focus on a definition of effective temperature using a time-dependent linear response measure and consider the behavior as a function of density. The time dependent method probes both the time-scale dependence of the effective temperature and the directional dependence of the effective temperature. The central issue is the behavior of the response function as a function of the systems density. As the density increases, one approaches the jamming transition. The jamming transition is the point at which the system becomes “frozen” and can be characterized by a diverging viscosity or the development of a static elastic shear modulus for the system Liu and Nagel (1998); Trappe et al. (2001). Our results suggest that the jamming transition is a special point where directional effects become important. Surprisingly, it is also the point where time-dependent linear response measure is most suggestive of a meaningful effective temperature.
The specific system reported on in this paper consists of plastic spheres floating on the surface of water. The details of the apparatus and measurement techniques are found in Ref. Ghaskadvi and Dennin (1998); Pratt and Dennin (2003). The spheres are confined to the air-water interface and placed between two concentric cylinders. A 50/50 mixture of spheres with radii of 0.32 cm and 0.24 cm is used. The packing fraction is the total cross-sectional area of the spheres at their midplane divided by the total area of the trough. The radius of the outer cylinder is varied between 6 cm and 11.5 cm to vary the packing fraction. As jamming occurs with increasing packing fraction, it is often useful to consider the behavior in terms of the inverse of the packing fraction: . Measurements of the critical packing fraction for the jamming of bead rafts have been previously reported Twardos and Dennin (2005). Based on these measurements, we focus on the range of packing fractions close to, but below, the jamming transition. In this regime, the system exhibits the properties of a power-law fluid (viscosity proportional to the rate of strain to a power), and there is no evidence of a yield-stress. Approaching the jamming transition by varying the packing fraction at a fixed rate of strain, the average stress, and by definition the viscosity, diverge Twardos and Dennin (2005).
We are interested in the behavior of the system with an imposed constant rate of strain, or flow. Flow is generated by rotating the outer cylinder. In order to measure the stress generated by the flow, the inner cylinder is suspended on a torsion wire and free to rotate. Angular displacements of the inner cylinder are measured. The stress on the inner cylinder is determined using . Here is the torsion constant of the wire and is the radius of the inner cylinder. Therefore, angular fluctuations of the inner cylinder allow for measurement of stress fluctuations. From a time series of the angular position of the inner cylinder, we can measure correlation functions for either the angular displacement of the inner cylinder or the stress generated by the flow.
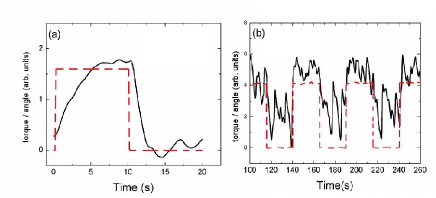
In addition to its use as a passive measuring device, an external torque can be applied to the inner cylinder, and the corresponding angular response measured. This is achieved through a coil of wire that is attached to the inner cylinder and suspended within a second coil, referred to as the outer coil. A current in the outer coil generates a magnetic field, and by applying a voltage to the inner coil to change its magnetic moment, a torque can be applied to the inner coil Ghaskadvi and Dennin (1998). Because the position of the inner cylinder is fluctuating during flow, in order to measure the response function a repeated square wave pulse is applied to the inner coil, and the response for each cycle is averaged. For each measurement, the square pulse is applied several hundred times, and the results averaged. An example of an average response for a 10 s on/10 s off pulse is shown in Fig. 1a. This represents a period of 20 s. Figure 1b shows the individual response in the case of pulses with a period of 50 s. To ensure that the system has equilibrated after each on/off pulse, for the rest of the paper all results used pulses with a 40 s period. This ensures that turning on the pulse corresponds to applying a torque in the direction of the external rotation, and because the system has fully equilibrated, turning off the pulse is equivalent to applying a torque opposite the direction of external rotation.
We will follow the conventions of Ref. O’Hern et al. (2004) and consider the correlation function for the angular displacements of the inner cylinder, , and the integrated response of to a small, constant applied torque given by . Defining rescaled quantities, and , the fluctuation dissipation relation gives , where is the temperature, or in our case, the effective temperature. It is worth briefly considering the case of an overdamped, torsional oscillator in a thermal bath described by Langevin equation: , where is the torsion constant, is the damping coefficient and is the random force term for which . For such a system, and . From this, we see that the fluctuation dissipation relation is a statement that the relaxation times for the correlation and response function are the same.
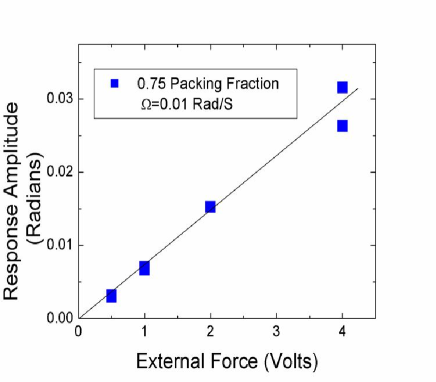
To test for linear response, we applied square waves of increasingly larger amplitude voltages to the inner coil, generating a torque on the inner cylinder. Figure 2 is a plot of the final angular displacement of the inner cylinder versus applied voltage for a packing fraction of 0.75 and a rotation rate of 0.01 rad/s. This illustrates the linearity of the response. For the range of voltages used, the response functions all collapsed onto a single curve when scaled by the applied voltage, confirming linear response. It should be noted that turning on the voltage pulse corresponded to decreasing the applied rate of strain. Likewise, turning off the pulse corresponded to increasing the applied rate of strain.
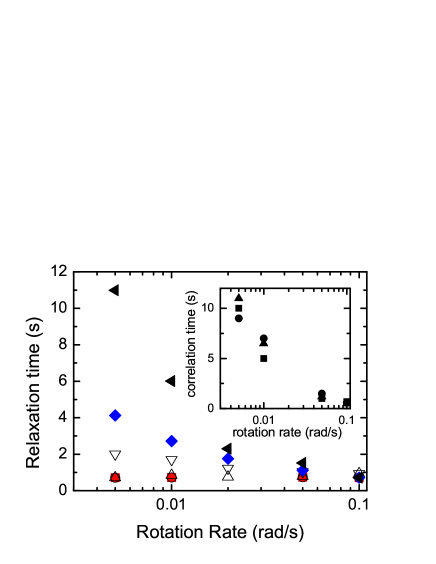
Before considering the connection between the response function and the correlation function, it is useful to consider the time scales associated with each separately. Figure 3 is a plot of the relaxation times for different densities and rotation rates that were obtained by fitting the response function to an exponential curve. For comparison, the insert shows the correlation times for the same densities as a function of rotation rate. It should be noted that the correlation function in time was well fit by an exponential (in frequency space, it was Lorentzian). This behavior is consistent with modelling the inner cylinder as an over-damped harmonic oscillator in a bath. The main feature of Fig. 3 is the fact that the discrepancy between relaxation times for applied torques parallel and anti-parallel to the applied rotation rate develops only for high densities and slow rotation rates. For this system, as the rotation rate is decreased, the average stress during flow is decreased Twardos and Dennin (2005). The jamming transition is approached either by increasing the packing fraction or decreasing the stress Liu and Nagel (1998). Therefore, the anisotropy in response develops as the jamming transition is approached.
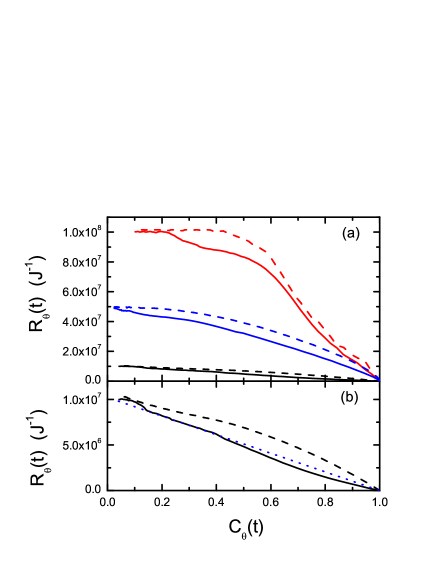
To highlight the features of the response and correlation functions illustrated in Fig. 3, Fig. 4a consists of a series of parametric plots of as a function of for packing fractions, 0.72, 0.74, and 0.78, respectively. The solid lines are for the response when the applied torque is in the direction of flow (decreasing the rate of strain). The dashed lines are for the response when the applied torque is in the opposite direction as the rotation of the outer cylinder (increasing rate of strain). If the system had a single effective temperature, these plots would be straight lines with a slope of and a y-intercept of . Also, if the direction of applied torque did not matter, the two curves for each density would superimpose. As expected, as the density is increased, the curves do not superimpose because the relaxation times are different for the different directions of applied torques (see Fig. 3).
In terms of defining an effective temperature, it is interesting to note that as the packing fraction is increased, the response as a function of the correlation approaches a straight line for the case of a torque applied in the same direction as the flow. This is illustrated in Fig. 4b where the results for a packing fraction of 0.78 are plotted. The dotted line is a straight line guide to the eye. In this case, it is interesting to compare the result this gives for an effective temperature with other measures of effective temperature to determine what, if any, significance there is to the linear behavior. This will be the subject of future studies.
The results reported here for the measured response functions during the flow of plastic beads have a number of interesting implications for generalizing fluctuation-dissipation relations as methods of defining effective temperatures. First, they highlight the fact that the applied rate of strain can break the symmetry of the system and result in a directional dependence for the response function. The existence of a directional dependence to the response function is consistent with previous measurements of the stress in granular systems in response to changes in applied stress or rate of strain Losert et al. (2000). These experiments focused on the question of flow start up in an opposite direction to a recently stopped applied flow. The initial applied rate of strain forms stress chains with a directional preference. The difference between flow start up in the direction and opposite the direction of the initial flow can be understood in terms of the development and breaking of these stress chains. This behavior occurs in the context of a highly nonlinear change in rate of strain. In the studies reported here, we observe similar directional dependence, but in a regime where the applied torque is small enough that the response is linear in the applied torque. An important question is the behavior of the system as one continues to decrease the driving amplitude. By definition, the truly linear response function can not have the directional asymmetry. We are currently working on increasing the resolution of the experiments to determine if the true linear response function is experimentally accessible. However, if the linear response regime is not experimentally achievable, this will have important implications for any practical definition of effective temperature.
Finally, this asymmetry in the response function will not be a generic feature of all definitions of effective temperature. For example, experimental measurements in another granular system probed the fluctuations perpendicular to the applied rate of strain, where one would not expect anisotropic effects Song et al. (2005). It will be important for future studies of effective temperatures to determine when the directional asymmetry will matter and how this impacts the generalization of definitions of effective temperature in such cases.
Acknowledgements.
This work was supported by Department of Energy grant DE-FG02-03ED46071. The authors thank C. O’Hern, J. L. Barrat, L. Bocquet, and P. Sollich for useful discussions.References
- Edwards and Makse (2005) S. F. Edwards and J. B. H. A. Makse, cond-mat p. 0503057 (2005).
- Cugliandolo and Kurchan (1999) L. F. Cugliandolo and J. Kurchan, Physica A 263, 242 (1999).
- Han and Grier (2004) Y. Han and D. G. Grier, Physical Review Letters 92, 148301 (2004).
- Ciliberto et al. (2004) S. Ciliberto, N. Garnier, S. Hernandez, C. Lacpatia, J. F. P. JF, and G. R. Chavarria, Physica A 340, 240 (2004).
- Goldburg et al. (2001) W. I. Goldburg, Y. Y. Goldschmidt, and H. Kellay, Phys. Rev. Lett 87, 245502 (2001).
- Toth-Katona and Gleeson (2003) T. Toth-Katona and J. T. Gleeson, Phys. Rev. Lett 91, 264501 (2003).
- D’Anna et al. (2003) G. D’Anna, P. Mayor, A. Barrat, V. Loreto, and F. Nori, Nature 424, 909 (2003).
- Feitosa and Menon (2004) K. Feitosa and N. Menon, Phys. Rev. Lett 92, 164301 (2004).
- Cugliandolo et al. (1997) L. F. Cugliandolo, J. Kurchan, and L. Peliti, Phys. Rev. E 55, 3898 (1997).
- Zamponi et al. (2005) F. Zamponi, F. Bonetto, L. F. Cugliandolo, and J. Kurchan, J. Stat. Mech.: Theory and Experiment p. P09013 (2005).
- Ono et al. (2002) I. K. Ono, C. S. O’Hern, D. J. Durian, S. A. Langer, A. J. Liu, and S. R. Nagel, Phys. Rev. Lett. 89, 095703 (2002).
- Berthier and Barrat (2002) L. Berthier and J.-L. Barrat, Phys. Rev. Lett. 89, 095702 (2002).
- O’Hern et al. (2004) C. S. O’Hern, A. J. Liu, and S. R. Nagel, Phys. Rev. Lett. 93, 165702 (2004).
- Potiquar and Makse (2006) F. Q. Potiquar and H. A. Makse, Euro. Phys. Jour. E 19, 171 (2006).
- Utter and Behringer (2004) B. Utter and R. P. Behringer, Physical Review E 69, 031308 (2004).
- Song et al. (2005) C. Song, P. Wang, and H. Makse, Proc. Nat. Academy 102, 2299 (2005).
- Ojha et al. (2004) R. Ojha, P.-A. Lemieux, P. Dixon, A. Liu, and D. Durian, Nature 427, 521 (2004).
- Liu and Nagel (1998) A. J. Liu and S. R. Nagel, Nature 396, 21 (1998).
- Trappe et al. (2001) V. Trappe, V. Prasad, L. Cipelletti, P. N. Segre, and D. A. Weitz, Nature 411, 772 (2001).
- Ghaskadvi and Dennin (1998) R. S. Ghaskadvi and M. Dennin, Rev. Sci. Instr. 69, 3568 (1998).
- Pratt and Dennin (2003) E. Pratt and M. Dennin, Phys. Rev. E 67, 051402 (2003).
- Twardos and Dennin (2005) M. Twardos and M. Dennin, Granular Matter 7, 92 (2005).
- Losert et al. (2000) W. Losert, L. Bocquet, T. C. Lubensky, and J. P. Gollub, Phys. Rev. Lett. 85, 1428 (2000).