Detecting the breached pair phase in a polarized ultracold Fermi gas
Abstract
We propose a method for the experimental detection of a new quantum phase, the breached pair state, in a strongly interacting ultracold Fermi gas with population imbalance. We show that through the time-of-flight Raman imaging, the presence of such a phase can be unambiguously determined with a measurement of the momentum-space phase separation of the minority spin component. To guide the experimental efforts, the momentum-space density profiles are calculated under typical experimental conditions.
The search for new quantum phases has long been a persistent goal of many-body physics. Ultracold atomic gas, with its remarkable controllability, has provided a powerful platform to realize and probe such phases. Among the various many-body phases, a few have been realized in this system, including, for instance, the Bose or the Fermi superfluid states 1 , and the Mott insulator state in an optical lattice 2 . Here, we propose a method for the experimental detection of a new quantum phase, the breached pair state, in a strongly interacting gas of fermionic atoms with population imbalance. Such a system, with its recent experimental realization 3 ; 4 ; 4a , has raised strong interest 5 ; 5a ; 6 ; 6a ; 7 ; 8 ; 9 ; mc ; 10 ; 10a ; 10b ; 10c . In particular, a quantum phase transition from a BCS superfluid to a normal state has been observed 3 ; 4a .
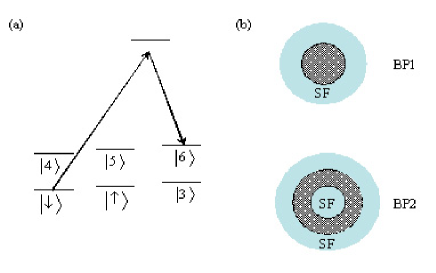
The breached pair (BP) state, proposed in Refs. 5 ; 5a ; 6 and studied in detail in 7 ; 8 ; 9 ; 10 , is a non-BCS superfluid phase with gapless fermionic excitations. A unique feature of this state is its phase separation in the momentum space, although in real space it is a homogeneous, polarized superfluid. This feature also distinguishes the breached pair phase from a simple mixture of molecular condensate and fermionic atoms, where there is no phase separation in the momentum space. As illustrated in Fig. 1, there are two kinds of BP states, with one or two Fermi surfaces for the excess fermions 5a ; 9 , respectively. To distinguish the two scenarios, we simply label them the BP1 and the BP2 states. Except for the number of Fermi surface, the properties of these two states are very similar. The quasi-particle excitations in both of the BP phases have non-monotonic dispersion relations 5 ; 5a ; 8 . There exists a well-defined quantum phase transition from the BCS superfluid to either one of the two phases. Such a phase transition is not characterized by symmetry breaking, but rather by the change in the topology of the Fermi surface 9 ; 10 .
The BP phases have been predicted to exist in theory, but it is hard to detect them experimentally. These phases show polarized superfluidity. However, even if one can confirm polarized superfluidity in the future experiments, it is not an unambiguous signal for the BP phase. Many phases can have polarized superfluidity. In particular, as we have shown in 9 , the conventional BCS state in the polarized gas also gives polarized superfluidity at any finite temperature (which is necessarily the case for experiments) due to the polarized quasi-particle excitations. So, it is hard to distinguish the more exotic phases from the conventional thermal BCS superfluid in experiments.
To overcome this difficulty, we propose a method to detect the BP phases by measuring the momentum-space density profile of the minority spin component. This method has the following desirable features: first, it can give an unambiguous signal for the BP phases. From the basic physical picture of the BP states shown in Fig. 1(b), we see already that there exists a finite region in the momentum-space with no minority atoms. This region, enclosed by the Fermi surface(s), is occupied only by the majority spin component. Therefore, if one measures the momentum-space density profiles, the profile for the minority atoms should be non-monotonic with a dip in the momentum distribution. This dip, if observed, is an unambiguous signature of the BP phase as no other phases have that character. Second, this method can also unambiguously distinguish different kinds of BP states. In Fig. 1(c), we show schematically the characteristic momentum distributions for the minority atoms associated with different BP phases. The different structures of the dips in the momentum distributions clearly tell the nature of the corresponding phases. More detailed calculations of the momentum space profiles later in the paper will further confirm the feasibility of this detection method.
For non-interacting atomic gases, the time-of-flight imaging provides a way to measure the momentum-space density profile. The absorption image of the expanded cloud is proportional to the initial atomic momentum distribution (after column integration). However, to realize the BP states, the atoms need to be strongly interacting in the trap. One therefore has to devise a method to suddenly turn off this strong interaction right before the expansion. For 40K atoms, such an interaction turn-off can be achieved with a fast switch of the magnetic field, as has been demonstrated in the recent experiment J10 . The experiments on the polarized Fermi gases are done so far with 6Li atoms, whose inter-atomic interaction, due to the large resonance width of 6Li at , is hard to be turned off through the magnetic filed switching without introducing significant influence on the momentum distribution of the atoms.
To overcome this problem, we propose a method to tune the atomic interaction almost instantaneously by applying an impulsive Raman pulse consisting of two co-propagating laser beams. For 6Li atoms close to a Feshbach resonance (the magnetic field ranging from G to G), the energy eigen-levels in the ground-state manifold are shown in Fig. 1(a). The three lower (or upper) levels differ mainly by their respective nuclear spins, while the states between the two sets have different electronic spins. The Feshbach resonance at resonantly couples the lowest two energy levels ( and ) in the ground state manyfold. Near this resonance point, the intra-set level splitting (e.g., between the states and ) is about MHz, while the inter-set splitting (e.g., between the states and ) is around GHz. We assume that the atoms are initially in the levels and , with spin as the minority component. Right before the time-of-flight imaging, we apply an impulsive Raman pulse to fully transfer the minority component from the state to (see Fig. 1(a)). As the level is detuned from by GHz, which is larger than the width of the Feshbach resonance at ( GHz, where is the width of the Feshbach resonance at ), it does not participate in the resonant coupling and thus only weakly interacts with the spin component. Since the gas is dilute and the atoms in the two different states and can be quickly separated, as a good approximation, the momentum distribution of the component has a negligible variation during the free expansion and can be recorded with the absorption image. As the Raman pulse consists of co-propagating laser beams, the momentum distribution of the atoms are not changed during the transfer. Therefore, using the method outlined above, one effectively measures the in-trap momentum-space density profile for the minority atoms.
We add a few remarks on this detection method before going on to the theoretical calculation. Firstly, in this scheme the Raman pulse is impulsive with its duration significantly smaller than , where is the characteristic chemical potential of the gas. The dynamics of the system during such a short interval is negligible, and thus the Raman transfer faithfully keeps track of the momentum distribution of the atoms. As a result of the impulsiveness of the Raman pulse, this method does not resolve the energy spread in the atomic gas, and is therefore different from the Bragg or the r.f. spectroscopy 11 ; rf . The two methods are actually complementary to each other, as the spectroscopy measures the energy spread while the Raman imaging detects the momentum distribution. Secondly, an impulsive Raman pulse without resolving the energy spread may have a practical advantage as it is insensitive to small variation of the energy splitting between the levels and caused by the fluctuation of the magnetic field. Finally, we can also let the two laser beams of the Raman pulse propagate along different directions (say, along and axis). Such a pulse will not change the momentum distribution in the plane, while imprinting a momentum kick along the direction, which helps to quickly separate the atomic components and , and thus further reduces the influence of interaction during the expansion.
To guide the experimental effort, in the following we include some calculations on the momentum-space density profile of the minority atoms. The calculations show that on the BEC side of the resonance BECnote , a non-monotonic momentum profile with a dip in the center should be visible, even if we take average in real space over all the phases in the trap note1 and perform a column integration in the momentum space. Our calculation method 9 is a generalization of the self-consistent diagram scheme 12 to the case with unequal spin population, which at zero temperature reduces to the mean-field approach 7 ; 8 ; 9 ; 10 (the latter recovers the crossover theory in the equal population case 12 ). We use the local density approximation for a three-dimensional (anisotropic) harmonic trap, and pick up the phase corresponding to the global minimum of the thermodynamic potential. The detailed formalism has been described in Refs. 9 . The properties of the system are universally characterized by three dimensionless parameters, the population imbalance , the dimensionless interaction strength , and the temperature , where and are defined through the Fermi energy at the center of the trap for a non-interacting Fermi gas with equal spin populations under the local density approximation. ¿From this definition, , where is the total particle number, () is the trapping frequency along the th direction. The atomic scattering length is connected with the magnetic field detuning through , where is the background scattering length and is the width of the Feshbach resonance.
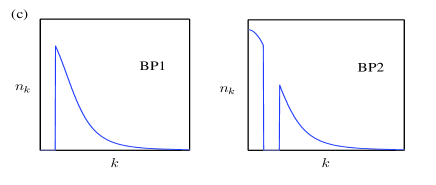
The phase diagram of this system has been shown in 9 , according to which the BP1 phase appears on the BEC side of the resonance with at low temperature. To calculate the momentum space density profile, however, we need to average over all the phases in the trap note2 . Under the local density approximation, the atom number distribution depends on both the atomic momentum and the position in the trap . The momentum-space density profile is given by . At , , and at zero temperature, this density profile is plotted in Fig. 2 for the minority spin component (spin ), together with its column integration It is clear that a non-monotonic behavior should be visible for this density profile, even after the column integration note3 . The dip is smaller than the one in the schematic figure 1(c) as one needs to average over different phases here in the trap. With the above parameters, there is a large region of the BP1 phase near the center of the trap (there is still a small BCS superfluid core right at the center), which is surrounded by a normal gas of the majority spin component. To achieve the interaction strength , one can take a moderately negative detuning with G for the 6Li atoms, where the system still has a long lifetime. This parameter then corresponds to atoms in a trap with typical trap frequencies and 3 (or with atoms in a slightly weaker trap with the trap frequencies reduced by a factor of ).
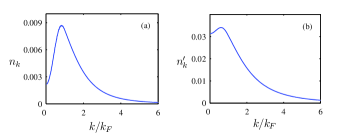
To check stability of the signal for the momentum-space phase separation even at finite temperature, and to verify that this signal is indeed uniquely connected with the BP phase, we calculate the momentum-space density profiles at different interaction strengths () and temperatures (), and with different population imbalance parameters (). The results are shown in Fig. 3, from which several observations can be made. First of all, this signal (the non-monotonic profile ) remains stable at finite but low temperatures. For instance, at (which corresponds a real temperature for atoms in a trap with and ), the dip in the profile only becomes a bit shallower. At significantly higher temperatures, the BP state is eventually replaced by a normal phase, and the dip signal disappears. Secondly, when one goes slightly further to the BEC side note4 , such as with , the dip signal becomes more pronounced, which corresponds to a larger BP phase region at the trap center. On resonance and on the BCS side, the dip disappears (the dip first disappears on the BEC side where the BP phase ceases to exist in the trap 9 ). Finally, as one varies the interaction strength or the population imbalance , the dip size varies, which correlates with the variations in the size of the BP region in the phase diagram. This shows that the dip signal is indeed uniquely connected with the BP phase.
Before ending the paper, a few remarks are in order. Firstly, in our calculation, only the BP1 phase can be stabilized in this system, and it only appears on the BEC side of the resonance note5 . Our proposed detection method, however, can detect both the BP1 and the BP2 phases, and an experimental detection surely can scan the whole region across the Feshbach resonance. Similar to the real-space density profile 3 ; 4 ; 4a , a momentum-space density profile will help us to understand a lot about this strongly interacting system with various competing phases, whether the experiment confirms the theoretical prediction here or finds new surprise. Secondly, we use a single impulsive Raman pulse here to fast tune the atomic interaction. If one applies two consecutive impulsive Raman pulses propagating along different directions, as shown in Ref. 13 , one can reconstruct the full real-space or momentum-space correlation function through Fourier sampling with the laser phase gradient. The full correlation function can reveal very detailed information of the system, e.g., the tiny spatial structures in the system. With such a capability, one may find some other interesting quantum phases, such as the FFLO state 14 ; 14a ; 10b , if the latter does show up in this atomic gas.
We thank Cheng Chin and Martin Zwierlein for helpful discussions. This work was supported by the NSF awards (0431476), the ARDA under ARO contracts, and the A. P. Sloan Fellowship.
References
- (1) C.A. Regal, M. Greiner and D.S. Jin, Phys. Rev. Lett. 92, 040403 (2004); M.W. Zwierlein et al., Phys. Rev. Lett. 92, 120403 (2004); C. Chin et al., Science 305, 1128 (2004); J. Kinast et al., Science 307, 1296 (2005); M.W. Zwierlein et al., Nature 435, 1047 (2005).
- (2) M. Greiner, et al., Nature 415, 39 (2002); C. Orzel, et al., Science 291, 2386 (2001); D. Jaksch, et al., Phys. Rev. Lett. 81, 3108 (1998).
- (3) M.W. Zwierlein, A. Schirotzek, C.H. Schunck, and W. Ketterle, Science 311, 492 (2006).
- (4) G.B. Partridge et al., Science 311, 503 (2006).
- (5) M. W. Zwierlein, C. H. Schunck, A. Schirotzek, W. Ketterle, cond-mat/0605258.
- (6) W.V. Liu and F. Wilczek, Phys. Rev. Lett. 90, 047002 (2003).
- (7) M. M. Forbes et al., Phys.Rev.Lett. 94, 017001 (2005).
- (8) G. Sarma, J. Phys. Chem. Solids 24, 1029 (1963).
- (9) P. F. Bedaque, H. Caldas, and G. Rupak, Phys. Rev. Lett. 91, 247002 (2003).
- (10) J. Carlson and S. Reddy, Phys. Rev. Lett. 95, 060401 (2005).
- (11) D.E. Sheehy and L. Radzihovsky, Phys. Rev. Lett. 96, 060401 (2006).
- (12) C.-H. Pao, S.-T. Wu, and S.-K. Yip, Phys. Rev. B 73, 132506 (2006).
- (13) W. Yi, L.-M. Duan, Phys. Rev. A 73, 031604(R) (2006); W. Yi, L.-M. Duan, Phys. Rev. A 74, 013610 (2006).
- (14) T.N. De Silva, E.J. Mueller, Phys. Rev. A 73, 051602(R) (2006); cond-mat/0604638; M. Haque, H.T.C. Stoof, Phys. Rev. A 74, 011602(R) (2006).
- (15) P. Pieri, G.C. Strinati, Phys. Rev. Lett. 96, 150404 (2006); F. Chevy, Phys. Rev. Lett. 96, 130401 (2006).
- (16) J. Kinnunen, L.M. Jensen, P. Torma, Phys. Rev. Lett. 96, 110403 (2006); K. Machida, T. Mizushima, M. Ichioka, cond-mat/0604339.
- (17) T.-L. Ho and H. Zhai, cond-mat/0602568; K. Yang, cond-mat/0603190; Z.-C. Gu, G. Warner, F. Zhou, cond-mat/0603091; M. Iskin, C. A. R. Sa de Melo, cond-mat/0604184; A. Imambekov, C. J. Bolech, M. Lukin, E. Demler, cond-mat/0604423; C.-C. Chien, Q. Chen, Y. He, K. Levin, cond-mat/0605039.
- (18) C.A. Regal et al., Phys. Rev. Lett. 95, 250404 (2005).
- (19) For a review, see W. Ketterle, D.S. Durfee, D.M. Stamper-Kurn, cond-mat/9904034.
- (20) M. Bartenstein et al., Phys. Rev. Lett. 94, 103201 (2005).
- (21) Note that the parameter region discussed in this work is still close to the resonant point of a wide Feshbach resonance, with , where the fraction of the close channel molecules is much less than . So the wavefunction of the bosonic molecules only has negligible influence on the system.
- (22) Besides the BP phase, there are in general several separated phases in a trap as one moves from the trap center to the edge. See 9 for the phase diagram.
- (23) Q. Chen et al., Phys. Reports 412, 1 (2005).
- (24) We assume here that the Raman pulse transfers all the minority atoms in the trap to the spectator state . If one can focus this laser beam to transfer atoms only in a particular region (corresponding to the BP phase region) to the state , one can have a more sensitive detection of the BP phase.
- (25) From the experimentally measureable column integrated density, it is possible to reconstruct the full three-dimensional density profile (M. W. Zwierlein, private discussion), particularly in the case where the local density approximation holds well. The signal of the BP phase becomes sharper in this full density profile.
- (26) The deep BEC region with , however, is not a good choice. The Cooper pairs become tightly bound there ( becomes very broad), and the relative change in the momentum distribution becomes smaller. For or , the size of the dip is comparable with the width of the distribution , and the Cooper pair wave function is significnatly modified by the presence of the excess fermionic atoms.
- (27) Similar conclusion is drawn in Refs. 7 ; 8 ; 10 . A recent study using Monte Carlo simulation, however, suggests that the BP phase might be stable at resonance mc , but the result is not yet conclusive due to the large error bar there.
- (28) L.-M. Duan, Phys. Rev. Lett. 96, 103201 (2006).
- (29) P. Fulde and R. A. Ferrell, Phys. Rev. 135, A550 (1964).
- (30) A.I. Larkin and Y.N. Ovchinnikov, Sov. Phys. JETP 20, 762 (1965).