Mott Transition of MnO under Pressure:
Comparison of Correlated Band Theories
Abstract
The electronic structure, magnetic moment, and volume collapse of MnO under pressure are obtained from four different correlated band theory methods; local density approximation + Hubbard U (LDA+U), pseudopotential self-interaction correction (pseudo-SIC), the hybrid functional (combined local exchange plus Hartree-Fock exchange), and the local spin density SIC (SIC-LSD) method. Each method treats correlation among the five Mn orbitals (per spin), including their hybridization with three O orbitals in the valence bands and their changes with pressure. The focus is on comparison of the methods for rocksalt MnO (neglecting the observed transition to the NiAs structure in the 90-100 GPa range). Each method predicts a first-order volume collapse, but with variation in the predicted volume and critical pressure. Accompanying the volume collapse is a moment collapse, which for all methods is from high-spin to low-spin (), not to nonmagnetic as the simplest scenario would have. The specific manner in which the transition occurs varies considerably among the methods: pseudo-SIC and SIC-LSD give insulator-to-metal, while LDA+U gives insulator-to-insulator and the hybrid method gives an insulator-to-semimetal transition. Projected densities of states above and below the transition are presented for each of the methods and used to analyze the character of each transition. In some cases the rhombohedral symmetry of the antiferromagnetically ordered phase clearly influences the character of the transition.
pacs:
64.30.+t,75.10.Lp,71.10.-w,71.20.-bI Introduction
For fifty years the metal-insulator transition has been one of the central themesMIT of condensed matter physics. The type we address here does not involve spatial disorder nor change of the number of charge carriers per cell; the competing tendencies arise solely from the kinetic and potential energies in the Hamiltonian, favoring itineracy and localization respectively, and the many real-material complexities that arise. The classic categorization is that of the Mott transition, treated in its most basic form with the single-band Hubbard model. Much has been learned about this model, but there are very few physical systems that are modeled faithfully by such a model. Real materials involve multiorbital atoms and thus extra internal degrees of freedom, and an environment that is often very active and may even react to the configuration of active sites.
MnO is a transition metal monoxide (TMO) with open shell that qualifies as one of the simpler realizations of a prototypical, but real, Mott insulator. It is, certainly, a multiorbital system with the accompanying complexities, but the half-filled bands lead to a spherical, spin-only moment at ambient pressure. Applying pressure to such a system leads to a number of possibilities, including insulator-metal transition, moment reduction, volume collapse if a first-order transition (electronic phase change) occurs, and any of these may be accompanied by a structural phase transition, that is, a change in crystal symmetry. The band width W of such a Mott insulator is very susceptible to applied pressure, and is one of the main determining factors of the strength of correlation effects.
The “closed subshell” aspect makes MnO an atypical monoxide, as shown for example by Saito et al., who compiledsaito95a effective parameters for this system from spectroscopic information. An effective intra-atomic Coulomb repulsion energy as defined by them, for example, is roughly twice as large as for the other monoxides. The complexity of this compound can be considered in terms of the energy scales that are involved in the electronic structure and magnetism of these oxides. These include the bandwidth W, an intra-atomic Coulomb repulsion strength U, an intra-atomic exchange energy (Hund’s rule J, or exchange splitting ), the crystal field splitting , and the charge transfer energy (the difference in mean Mn and O site energies). In the magnetically ordered antiferromagnetic (AFM) state, there are further symmetry lowering and ligand field subsplittings involving hybridization. All of these scales change as the volume changes, making the pressure-driven Mott transition a challenging phenomenon to describe.
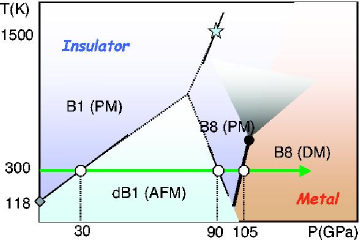
Although the objective of the current paper is to compare methods within the fcc (rocksalt) phase, it is useful first to recount what is known about the Mott transition at this time. The current experimental information, mostly at room temperature, on the behavior of MnO under pressure is summarized in Fig. 1. Resistance measurementsPattersonMnO provided the first evidence of the Mott transition in MnO near GPa. Recent x-ray diffraction and emission spectroscopy measurements of the crystal structure and magnetic moment by Yoo et al.YooMnO have clarified the behavior. Around 90 GPa there is a structural transformation from the distorted B1 (rocksalt) phase to the B8 (NiAs) structure. This structure change is followed at 105 GPa by the Mott transition, consisting of a simultaneous volume collapse and moment collapse signifying a qualitative change in the electronic structure of the compound.
On the theoretical side, little is known about how the Mott transition occurs in a real multiband TMO in spite of the extensive studies of the Mott transition in the single-band Hubbard model, which has a simple spin-half moment at strong coupling and half-filling. The numerous energy scales listed above, and the S= moment on Mn arising from the five electrons, allow many possibilities for how the moment might disintegrate as the effective repulsion decreases. The high pressure limit is clear: a nonmagnetic band metal in which kinetic energy overwhelms potential energy. This is the competition studied in the (simplified) Hubbard model. The multiband nature has attracted little attention until recently, when for example the question of possible orbital-selective Mott transitionsliebsch ; koga have aroused interest. One can imagine one scenario of a cascade of moment reductions S = before complete destruction of magnetism, as electrons use their freedom to flip spins (as some competing energy overcomes Hund’s rule, for example). In such a scenario there is the question of which orbital flips its spin at each spinflip, which involves a question of orbital selection and ordering. At each flip the system loses exchange (potential) energy while gaining kinetic energy (or correlation energy through ‘singlet’ formation). The manner in which kinetic energy changes is difficult to estimate because subband involvement means that there is no longer a single bandwidth W that is involved. The increasing hybridization with O states under pressure strongly affects the kinetic energy, directly and through superexchange (a kinetic energy effect).
It is known that conventional band theory (local density approximation [LDA]) that does so well for so many materials gives poor results for monoxides in many respects, and some predictions are qualitatively incorrect (viz. no band gap when there should be a large gap of several eV). Thus even at the density functional level (ground state energy, density, and magnetization) some correlated approach is required. In the past fifteen years several approaches, which we refer to as correlated band theories, have been put forward, and each has had its successes in providing an improved description of some aspects of correlated TMOs. Although commonly called mean-field approaches with which they share many similarities, they are not mean-field treatments of any many-body Hamiltonian. Rather, they are energy functionals based on the complete many-body Hamiltonian, which must then be approximated due to limited knowledge of the exchange-correlation functional.
In this paper, we provide a close comparison of certain results from four such methods: full potential LDA+U, the hybrid exchange functional (HSE) approach, the self-interaction-corrected local spin-density method (SIC-LSD), and a nonlocal pseudopotential-like variation of SIC (pseudo-SIC). Our main focus is to compare the predicted changes in energy, moment, and volume within the AFMII rocksalt phase of MnO. To keep the comparison manageable we confine our attention to the rocksalt phase, since our emphasis is on comparison of methods and not yet the ultimate but more daunting task of modeling structural changes that may precede, or accompany, the Mott transition.
II Structure and Symmetry
Rocksalt MnO has an experimental equilibrium lattice constant =4.45 Å (cubic cell volume V∘=88.1 Å3). Density functional theory, like Hartree-Fock theory, deals in its most straightforward form with ground state properties, i.e. zero temperature. The ground state is known to be the AFMII phase in which layers have spins aligned, and successive layers are antiparallel. The resulting symmetry is rhombohedral, with Mn and Mn being distinct sites (although related through a translation + spin-flip operation). Thus, while most of the lore about transition metal monoxides is based upon cubic symmetry of the Mn (and O) ion, in the ordered state the electronic symmetry is reduced. It is obvious that individual wavefunctions will be impacted by this symmetry, viz. fourfold symmetry around the cubic axes is lost. It has been emphasized by Massidda et al.massidda that zone-integrated, and even spin-integrated, quantities show the effects of this symmetry lowering; for example, Born effective charges lose their cubic symmetry. Since this issue arises in the interpretation of our results, we provide some background here.
In cubic symmetry the Mn states split into the irreducible representations (irreps) denoted by and . Rhombohedral site symmetry results in the three irreducible representations , , and , the latter two being two fold degenerate. The coordinate rotation from cubic to rhombohedral (superscript and respectively) is, with a specific choice for the orientation of the and axes in the rhombohedral system,
Applying this rotation of coordinates gives the orbitals in the rhombohedral frame in terms of those in the cubic frame ():
| (1) | |||||
| (2) | |||||
| (3) | |||||
| (4) | |||||
| (5) |
In rhombohedral coordinates it is useful to categorize the orbitals in terms of their orbital angular momentum projections along the rhombohedral axis: ; ; . It is easy to see that specifies groups of states that only transform into combinations of themselves under trigonal point group operations.
Note that the unique symmetry state in rhombohedral coordinates is the fully symmetric combination of the cubic states. The other two irreps are both doublets. While and form representations of these irreps, if there are components of the crystal field that are not diagonal in the L=(2,) basis, these states will mix. Then each of the resulting (orthonormal) irreps , and will contain both and components. Such mixing does occur in MnO and complicates the symmetry characterization of the states.
III Methods
III.1 LDA Calculations
For LDA band structure plot (Fig. 2) we used version 5.20 of the full-potential local orbital band structure method (FPLOKoe99 ). Relativistic effects were incorporated on a scalar-relativistic level. We used a single numerical basis set for the core states (Mn and O ) and a double numerical basis set for the valence sector including two and radial functions, and one radial function, for Mn, and two and radial functions, and one radial function, for O. The semi core states (Mn ) are treated as valence states with a single numerical radial function per -shell. The local density exchange-correlation functional PW92 of Perdew and WangPW92 was used.
III.2 LDA+U Method
The LDA+U approach of including correlation effects is to (1) identify the correlated orbital, in this case, (2) augment the LDA energy functional with a Hubbard-like term (Coulomb repulsion U) and Hund’s (exchange J) energy between like spins, (3) subtract off a spin-dependent average of this interaction energy to keep from double-counting repulsions (once in LDA fashion, once in this U term), and (4) include the correlated orbital occupation numbers in the self-consistency procedure, which leads to an orbital-dependent Hartree-Fock-like potential acting on the correlated orbitals. The addition to the energy functional has the schematic form
| (6) |
We actually use the coordinate-system independent form of
LSDA+U Esc03 ; Czy94 ; Ani97 implemented in FPLO,Koe99 which
leads to four indices on and which for simplicity
have not been displayed
(nor has the full off-diagonal form of the occupation matrices
). This treatment of the on-site interactions and
incorporates on-site correlation effects in the Mn 3d-shell. We have used the
so called ‘atomic-limit’ (strong local moment) form of the
double-counting correction, the last term in Eq. 6. This form is
appropriate for the high-spin state, but it is less obviously so for the
low-spin state that is found at reduced volumes. The
Slater parameters were chosen according to ,
and .
The shape of the basis orbitals has been optimized yielding a sufficient accuracy of the total energy over the range of geometries considered in this work. The -integrals are performed via the tetrahedron method with an irreducible mesh corresponding to 1728 () points in the full Brillouin zone.
III.3 SIC-LSD Method
The SIC-LSD method addresses the unphysical self-interaction in the LDA treatment of localized states. Itinerant states, being spread over space without finite density in any given region, do not experience this self-interaction within the LDA treatment. Should there be localized states, confined to some region and giving a finite density, they will suffer an unphysical self-interaction in the LSD method. This issue then clearly arises in the itinerant-localized transition in MnO and other correlated systems. The basic premise of the SIC-LSD method is that localized electrons should experience a different potential from that of itinerant electrons,Cowan67 ; Lindgren71 ; PZ81 analogous to that of an atomic state whose self-interaction must be removed. Then electrons on the surrounding atoms are allowed to accommodate self-consistently. This distinction of localized versus itinerant state is addressed in SIC-LSD by extending the energy functional in the form
| (7) | |||||
Here represent the Hartree (classical Coulomb) energy of a density . The self-Coulomb energy and self-exchange-correlation energies are subtracted off for each localized state with density . Whether states are localized or not (with non-zero, respectively zero self-interaction) is determined by minimization of this functional, allowing localized as well as itinerant states . Since the correction vanishes for itinerant states, the sum finally includes only the self-consistently localized states. The localized and itinerant states are expanded in the same basis set, and minimization becomes a process of optimizing the coefficients in the expansion of the states (as other band structure methods do, except that Bloch character is imposed in other methods). The implementation of Temmerman and collaboratorswalter used here incorporates the atomic-sphere approximation (ASA) of the linear muffin-tin orbital electronic structure methodLMTO (LMTO) in the tight-binding representation.lmtotb Further details can be found in Ref. walter2, .
III.4 pseudo-SIC Method
The large computing requirements (compared to LDA) of the SIC-LSD method, even for materials with small unit cells, has led to an alternative approach Vogel96 , in which the self-interaction part of the Kohn-Sham potential is approximated by a non-local, atomic-like contribution included within the pseudopotential construction. The original implementation of this scheme has given important improvements over LSDA results for non-magnetic II-VI and III-V semiconductors, but was not applicable to metals or to magnetic and highly-correlated systems where there is a coexistence of strongly localized and hybridized electron charges.
The pseudopotential self-interaction corrected calculations presented here were performed
using the recently developed “pseudo-SIC” method of Filippetti and Spaldin
Filippetti03 . This pseudo-SIC approach represents a
compromise between the fully self-consistent implementations of Svane et al.
walter ; svane1990 and the alternative method of
Vogel et al. Vogel96 , in that the SIC calculated for the atom
(as in Ref. PZ81 ) is scaled by the electron occupation numbers calculated
self-consistently within the crystal environment. This allows
the SIC coming from localized,
hybridized, or completely itinerant electrons to be discriminated,
and permits the treatment
of metallic as well as insulating compounds,
with minimal computational overhead beyond the LSDA.
In this pseudo-SIC procedure, the orbital SIC potential is taken from the
isolated neutral atom and included in the crystal potential in
terms of a nonlocal projector, similar in form to the nonlocal part of the
pseudopotential. The Bloch wave functions are projected onto the basis of
the pseudo-atomic orbitals, then, for each projection, the potential
acting on the Bloch state is
corrected by an amount corresponding to the atomic SIC potential.
Note that, within this formalism, a physically meaningful energy functional
which is related to the Kohn-Sham equations by a variational principle is
not available. However, a suitable expression for the total energy
functional
was formulated in Ref. Filippetti03 and shown to yield
structures
in good agreement with experiment. We use this functional here to calculate
the bondlength dependence of the total energy. We have used ultra-soft
pseudopotentials with an energy cutoff of 35 Ry.
An Monkhorst-Pack grid was used for -point sampling. The
low-spin and high-spin solutions were obtained by setting initial magnetization to
5 or 1 respectively.
III.5 Hybrid Functional Method
The hybrid-exchange DFT approximation mixes a fraction of the exact, non-local, exchange interaction (which uses the Hartree-Fock [HF] expression) with the local, or semi-local, exchange energy of the LDA or the generalized gradient approximation (GGA). The PBE0 functional takes the form:
| (8) |
where and are the exchange and the PBE GGA functionals. The mixing parameter = 1/4 was determined via perturbation theory [21] and is the PBE correlation energy.
In this work we use the hybrid method recently developed by Heyd, Scuseria and Enzerhof (HSE)).Heyd It is based upon the PBE0 functional, but employs a screened, short-range (SR) Hartree-Fock (HF) exchange instead of the full exact exchange, which results in a more efficient evaluation for small band gap systems. In this approach, the Coulomb operator is split into short-range (SR) and long-range (LR) components respectively
| (9) |
where is a parameter that can be adjusted for numerical or formal convenience.
The expression for the HSE exchange-correlation energy is
where E() is the SR HF exchange computed for the SR part of the Coulomb potential, E() and E() are the SR and the LR components of the PBE exchange, respectively. The cited papers should be consulted for further details. The HSE functional has been found to yield results in good agreement with experiment for a wide range of solids and molecules gust1 ; gust2 .
This functional is implemented in the development version of the Gaussian quantum chemistry package Frisch . We use the Towler basisTowler1 ; Karen ; Towler2 of Gaussian functions for our basis set. It consists of a [20s12p5d/5s4p2d] contraction for Mn and a [14s6p/4s3p] basis for O, optimized for HF studies on MnO. A pruned grid for numerical integration with 99 radial shells and 590 angular points per shell was used. The -space was sampled with a mesh. Low spin and high spin antiferromagnetic initial guesses were obtained using the crystal field approach by patching the density matrix obtained from diagonalization of the Harris functional harris with the density matrices obtained from calculation on ions in the appropriate ligand field kudin ; prodan .
IV Previous Electronic Structure Studies
The origin, and the proper description, of the moments and the band gaps in transition metal monoxides have a long history. The earliest question centered on the connection between the antiferromagnetic (AFM) order and the insulating behavior. Slater’s band pictureslater could account in a one-electron manner for a gap arising from AFM order, whereas Mott’s picture of correlation-induced insulating behaviormott was a many-body viewpoint with insulating behavior not connected to the magnetic order. The proper general picture in these monoxides arose from studies of transport above the Néel temperature and with introduction of defects, giving them the designation as Mott insulators.
Much progress on the understanding of MnO and the other monoxides came from early studies using LDA. While understanding that LDA does not address the strong correlation aspect of the electronic structure, Mattheissmattheiss and Terakura et al.terakura quantified the degree and effects of interactions, and pointed out the strong effect of magnetic ordering on the band structure. More recently, Pask and collaboratorspask have studied the structural properties, and the rhombohedral distortion, with LDA and GGA approximations. The symmetry lowering and resulting structure is described well, and in addition they found that AFM ordering results in significant charge anisotropy. Effects of AFM order were further probed by Posternak et al. by calculating and analyzing maximally localized Wannier functions for the occupied states.posternak
The application of correlation corrections in MnO already has a colorful history. The first work, by Svane and Gunnarssonsvane1990 and by Szotek et al.,szotek was in the application of the SIC-LSD method. The former pair correctly obtained that MnO, FeO, CoO, NiO, and CuO are AFM insulators, while VO is a metal. They calculated a gap of 4 eV for MnO. Szotek et al. used a fairly different implementation of the SIC-LSD approach but find a similar gap (3.6 eV). Their states lay about 6 eV below the center of the bands, although hybridization was still clearly present. In this same time frame, Anisimov, Zaanen, and Andersen introducedAni91 the LDA+U method with application to the transition metal monoxides. They obtained a band gap of 3.5 eV but few other results on MnO were reported.
Kotani implementedkotani1 ; kotani2 ; kotani3 the “DFT exact-exchange” method of Talman and Shadwicktalman to crystal calculations. This method consists of taking the Fock expression for the exchange energy in the DFT functional, then performing a Kohn-Sham solution (minimization), giving a local exchange potential (“optimized effective potential”). In Kotani’s results for MnO, the Mn and bands form very narrow (almost atomic-like) bands between the occupied O bands and the conduction bands. Takahashi and Igarashiigarashi proposed starting from the Hartree-Fock exchange and adding correlation from a local, three-body scattering viewpoint. Their corrections were built on a parametrized tight-binding representation, and they obtained small self-energy corrections for MnO, much smaller than they obtained for the other transition metal monoxides.
The effective potential approach used by Kotani was extended by Solovyev and Terakurasolovyev in an unconventional way. They obtained an effective potential using the criterion that it had to reproduce the spin-wave spectrum, i.e. that it had to describe the magnetic interactions correctly. They found clear differences when comparing to the LDA+U and the optimized effective potential results, and discussed limitations of the one-electron band method itself.
More recently, Savrasov and Kotliar applied a dynamical extensiondmft of the LDA+U method (dynamical mean field theory) to MnO and NiO. Being a self-energy method, this is not really a correlated band theory. For the properties they calculated (band gap, effective charges, dielectric constant, optic phonon frequencies) the dynamical results are similar to the LDA+U results and differ considerably from LDA values.
Even though hybrid-exchange DFT applications to solids are still in their infancy, there have been two previous studies of MnO. The first, by Bredow and Gerson,bredow utilized the B3LYP hybrid functional. Unlike the LDA and GGA, they found B3LYP provided an excellent band gap for MnO. More recently, Franchini et al. have examined MnO in more detail using the PBE0 approximation.franchini They also found a gap, lattice constant and density of states in quite good agreement with experiment. In particular, the distorted dB1 rhombohedral structure was determined to be the minimum energy geometry, in agreement with experiment. Neither the B3LYP nor the PBE0 approximation can be applied to the metallic side of the transition of interest here. For that, we must turn to the screened hybrid-exchange of HSE.
Therefore, while there has been thorough LDA studies of MnO and a variety of approaches to treatment of the correlation problem, nearly all of these have considered only ambient pressure or small variations of volume near zero pressure. The work described in the following sections focuses on testing the four different correlated band methods from ambient conditions to high pressures, through the volume collapse regime, to see whether some basic foundation can be laid for the understanding and theoretical description of pressure-driven Mott transitions in real materials.
V Results
Our principal results revolve around the first-order transition, highlow volume which is also highlow moment in nature. For convenience we use from here on the specific volume , the volume referenced to the experimental zero-pressure volume. The equations of state have been fitted for both high volume and low volume phases for each computational method, and the resulting constants are presented and analyzed below.
V.1 Baseline: LDA Bands and Equation of State
| FPLO | Gaussian | PW-USSP | LMTO-ASA | |
| 0.97 | 0.97 | 0.96 | 0.97 | |
| B (GPa) | 170 | 196 | 169 | 205 |
| Gap (eV) | 0.72 | 1.13 | 0.92 | 1.04 |
| Moment ( | 4.52 | 4.53 | 4.42 | 4.42 |
In Table 1 we illustrate the magnitude of variation of three properties calculated from the four codes used here, as an indication of what size of differences should be given meaning in properties presented below. Before the method-specific beyond-LDA corrections are applied, there are differences in the bandgap (0.950.2 eV) due to the algorithms applied in the codes, to the basis quality, and because different LDA functionals are used. It is evident that these variations have very little effect on the calculated equilibrium volume and minor effect on the calculated Mn moment (4.470.05 ). Such differences will not affect the comparisons of the results given here, at the level of precision of interest at this time.
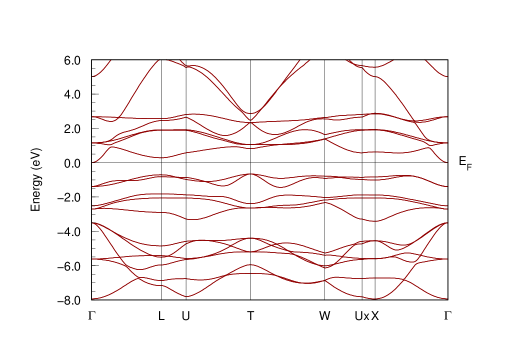
The LDA band structure of AFM MnO is shown in Fig. 2 as the reference point for the following calculations. There is a band gap of eV. The five bands immediately below the gap are the majority Mn bands, those lying below are the O bands. The charge transfer energy mentioned in the Introduction is = 6 eV, and the exchange splitting is 3.5 eV. It is tempting to interpret the 3+2 separation of occupied states as , but the rhombohedral symmetry renders such a characterization approximate. The five bands above the gap are primarily the minority Mn bands. However, a free-electron-like band at lies lower in energy than the bands, but disperses upward rapidly, so over most of the zone the lowest conduction band is Mn and the gap is 1 eV. The presence of the non- band does complicate the interpretation of the band gap for some of the correlated methods, presented below.
The behavior of MnO under compression within GGA has been given earlier by Cohen, Mazin, and Isaak.cohen They obtained an equilibrium volume 2% higher, and bulk modulus 13% smaller, than measured. Pressure studies including extensive structural relaxation have also been provided by Fang et al.fang Their structural relaxations make their study more relevant (within the restrictions of GGA) but also make comparison with our (structurally restricted) results impossible.
V.2 Energetics and Equation of State
| GGA | LDA+U | HSE | pseudo | SIC | |
| exchange | -SIC | -LSD | |||
| 1.02 | |||||
| 0.70 | 0.66 | 0.60 | 0.86 | 0.64 | |
| 0.62 | 0.61 | 0.55 | 0.73 | 0.52 | |
| 0.08 | 0.05 | 0.05 | 0.13 | 0.12 | |
| 196 | 192 | 187 | 138 | 159 | |
| - | 195 | 224 | 230 | 67 | |
| 3.9 | 3.2 | 3.3 | 3.6 | 3.3 | |
| - | 3.6 | 4.0 | 3.5 | 4.7 | |
| 149 | 123 | 241 | 56 | 204 |
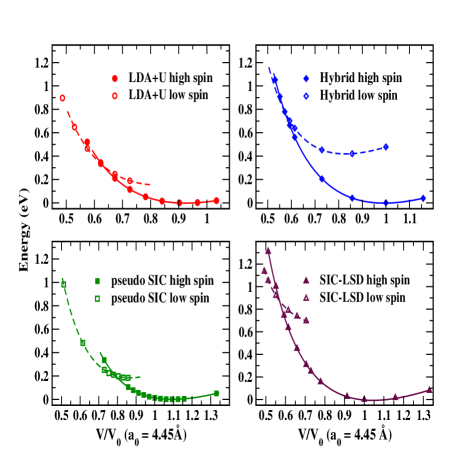
The equation of state (EOS) energy vs. volume curves for the various functionals are collected in Fig. 3. For each correlated band method a large volume, high-spin state and a small volume, low-spin state are obtained. The analysis to obtain the first-order volume collapse transition was done as follows. For each high volume and low volume phase separately, an EOS function was determined (=high, low) by a fit to the Murnaghan equation. Both fits give minima, with the most relevant one being for the high spin phase and being the predicted equilibrium volume . The pressure is obtained from the volume derivative of the EOS, which is inverted to get . Equating the enthalpies of the two phases gives the critical pressure . The volumes at this pressure then give the volume collapse = .
The various quantities for all four computational schemes are given in Table 2, along with the uncorrelated results of Cohen et al.cohen Not surprisingly given the other differences that will be discussed, there are substantial variations among the critical pressures and related quantities. Particularly noticeable already in the EOS is the result that the energy difference between the low-spin energy minimum and the high-spin one is 0.2 eV for the LDA+U and pseudo-SIC methods, while the HSE method gives roughly twice the energy difference (0.4 eV), and the SIC-LSD method gives roughly 0.6 eV.
We now mention other noteworthy features of the calculated data in Table
2.
(1) The predicted equilibrium volume from the LDA+U method
is the smallest of the four methods (=0.93), thus overbinding.
The HSE value is almost indistinguishable from the observed value,
while the SIC-LSD and pseudo-SIC methods give
underbinding ( = 1.04, 1.09 respectively).
(2) The pseudo-SIC method predicts the transition to occur at a relatively
small volume reduction (=0.86); the other methods give the onset of
transition at =0.630.03.
(3) The critical pressure Pc=56 GPa predicted by pseudo-SIC is smallest
of the methods. Pc in LDA+U (123GPa) is comparable to that of LDA; those
of SIC-LSD and HSE are higher (204, 241 GPa, respectively).
(4) The SIC-LSD method predicts a transition to a low volume phase that is
much softer than the high volume phase, a phenomenon that is extremely
unusual in practice but not disallowed. There are two possible sources of
this difference: (i) in
SIC-LSD the system becomes completely LDA-like in the low volume phase
whereas in the other methods the states are still correlated, or
(ii) the LMTO-ASA method involves approximations that pose limitations in
accuracy.lmtolimits
(5) The values of in the large volume phase vary although not anomalously
so, given the differences discussed just above.
(6) The values of in the high volume phase are reasonably similar across
the methods: . The variation in the collapsed phase is
greater.
V.3 Magnetic Moment
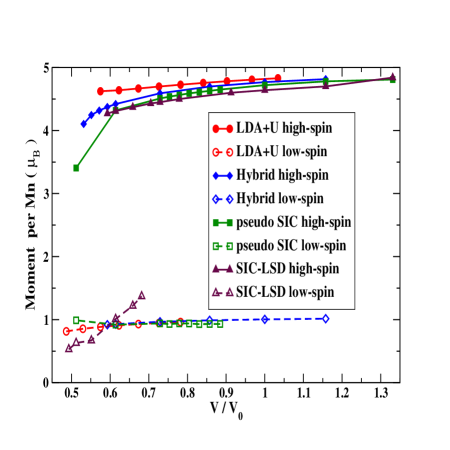
The moment collapse behavior of each method is collected in Fig. 4. For comparison, the GGA result presented by Cohen et al.cohen was a moment collapse from 3.4 to 1.3 at the volume given in Table 2. On the broadest level, the predictions for the Mn moment show remarkable similarity. At low pressure, all methods of course give the high-spin S= configuration of the Mn2+ ion, with the local moment being reduced slightly from 5 by mixing. This electronic phase persists over a substantial volume reduction, giving way in all cases to an S= state, not the nonmagnetic result that might naively be anticipated. Three methods give a stable moment very near 1 over a range of volumes. The SIC-LSD method (which in the collapsed phase is simply LDA) is alone in giving a varying moment, one that reduces from 1.4 at down to 0.5 at
One difference between the methods lies in how soon the low-spin state becomes metastable, i.e. when it is possible to obtain that state self-consistently, as opposed to when it becomes the stable solution (which was discussed in the EOS subsection). The state is obtained already at ambient volume in the HSE method; the pseudo-SIC method obtains the low-spin state just below ; for the LDA+U method, it was not followed above . It should be emphasized however that no concerted measures were taken to try to follow all solutions to the limit of their stability.
V.4 Fundamental Band Gap
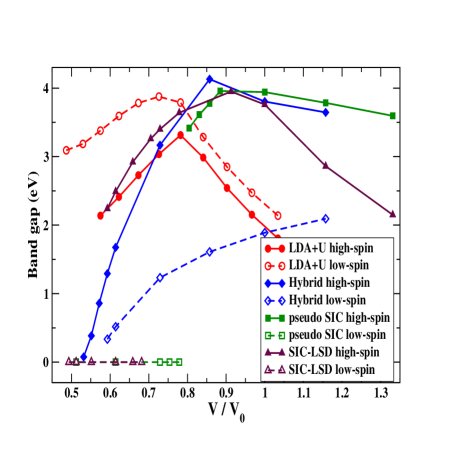
In Fig. 5 the calculated band gap of both high-spin and low-spin states are shown for all methods. Here the behavior differs considerably between the methods, in part because at certain volumes the gap lies between different bands for some of the methods. At ambient pressure the pseudo-SIC and HSE methods obtain a gap of 3.5-4 eV, while that for SIC-LSD is 2.9 eV, and that of the LDA+U method is even lower, less than 2 eV. Experimental values lie in the 3.8-4.2 eV range. Referring to Fig. 2, it can be observed that the large volume gap depends on the position of the majority states with respect to the free-electron-like band, i.e. it is not the Mott gap. Both of the former approaches show only a slight increase as pressure is applied, reaching a maximum around where a band crossing results in a decreasing gap from that point. For pseudo-SIC, there is an almost immediate collapse to a metallic low spin state. Within HSE, MnO collapses to the low-spin state at a volume , coincident with the closing of the gap in the low-spin state. The SIC-LSD and LDA+U gaps, smaller initially, show a much stronger increase with pressure, and also incur the band crossover that leads to decrease of the gap (within the high-spin state).
VI Analysis of the Transition
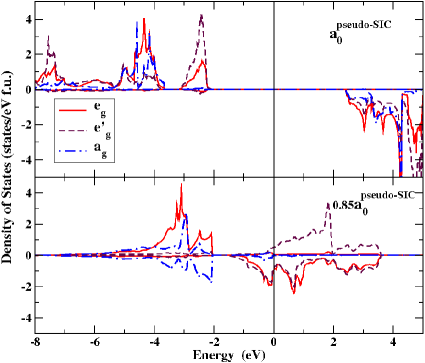
In this section we analyze the character of the states just above and just below the Mott transition, as predicted by each of the methods. Due to the differing capabilities of the codes, the quantities used for analysis will not be identical in all cases. In the Figs. 6-9 we present for uniformity the DOS in the high volume phase at the equilibrium volume () and in the collapsed phase at (=0.6). Note (from Table I) that this specific volume does not correspond to any specific feature in the phase diagram for any method, although it lies in the general neighborhood of the volume at the collapse. Changes within the collapsed phase are continuous, however, so the plots at are representative of the collapsed phase.
VI.1 LDA+U
The projected DOSs (PDOSs) in Fig. 6 refer to projections onto Mn orbitals, with the -axis being the rhombohedral axis, the (=0) state; the pair {} (=1); and the pair {} (=2). Because the two representations have the same symmetry, they can mix and the actual combinations are orthogonal linear combinations of which depend on interactions. For the LDA+U results, however, there is little mixing of the pairs. The character of the transition is simple to describe: the pair (=1 with respect to the rhombohedral axis) simply flips its spin.
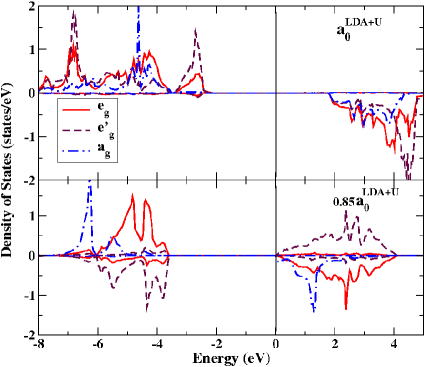
This S= state is unexpected and quite unusual. First, each orbital is still singly occupied, verified by plotting the charge density on the Mn ion and finding it just as spherical as for the high-spin state. Second, each orbital is essentially fully spin-polarized, with the configuration being . A plot of the spin densitydeepa reveals the unanticipated strong anisotropy with nodal character, characteristic of spin-up and =2 orbitals, and spin-down =1 orbitals (in the rhombohedral frame). Third, it makes this transition with essentially zero change in the gap, which is 3.5 eV. The band structure changes completely, however, so the close similarity of the gaps on either side is accidental.
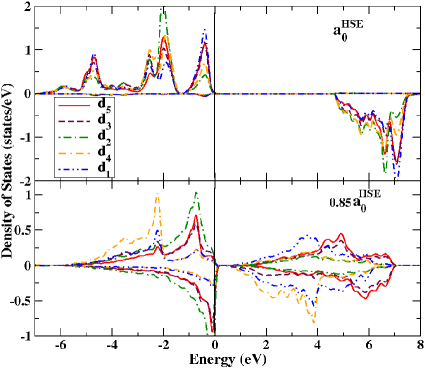
VI.2 HSE Method
In the high volume phase the distribution and overall width of the occupied states, shown in Fig. 7, is similar to that of the LDA+U method (previous subsection). The gap is larger, as discussed earlier. The collapsed phase shows new characteristics. The gap collapses from 4 eV at to essentially zero at the onset of the collapsed phase at =0.55, making this an insulator-to-semimetal transition. The metallic phase then evolves continuously as the pressure is increased beyond . The configuration can be characterized as , resulting in a moment of 1. The corresponding spin density is strongly anisotropic, although in a different manner than is the case for LDA+U.
VI.3 pseudo-SIC Method
The spin-decomposed spectrum from this method is shown in Fig. 8, symmetry-projected as done above for the LDA+U method. The PDOSs in the high-spin state are quite similar to those given by the LDA+U method. The transition could hardly be more different, however. The gap collapses in an insulator-to-good-metal character, the Fermi level lying within both majority and minority bands. The majority bands are the pair (=1) and are only slightly occupied. In the minority bands both and are roughly quarter filled. The reason this solution is (at least locally) stable seems clear: EF falls in a deep valley in the minority DOS.
In the collapsed, low-spin state, the orbital of both spins is occupied, and the majority pair is also fully occupied. This results in a configuration that can be characterized roughly as , giving spin Thus the fact that the same moment is found in the low-spin state as was found with the LDA+U and pseudo-SIC methods seems accidental, because in those methods the energy gap required integer moment whereas the pseudo-SIC solution is firmly metallic. It is in fact close to half metallic, which accounts for the near-integer moment. In pseudo-SIC, the orbital is unpolarized (spin-paired), the pair {} (=1) is positively polarized, and the pair {} (=2) is negatively polarized but to a smaller degree.
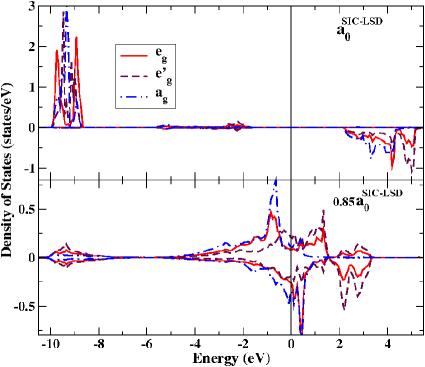
VI.4 SIC-LSD Method
This method give much more tightly bound state in the high-spin state than the other methods. An associated feature is that the majority-minority splitting, the “effective U” plus the exchange splitting 13 eV, more than twice as la large as used in the LDA+U method (both in this paper and elsewhere). Note that in the SIC-LSD method is a true Slater self-Coulomb integral, whereas in the LDA+U method the value of represents the (somewhat screened) Coulomb interaction between a electron and an additional electron, so agreement between the two is not expected. Nevertheless the difference is striking. All five majority states are localized, leading to the self-interaction potential that binds them. The majority states lie 6 eV below the center of the bands and hybridize very weakly, which accounts for the very narrow, almost core-like bands.
In the collapsed phase, there are no localized states and the usual LSDA results re-emerges. All states make some contribution to the moment, but the strongest contribution arises from the orbital. One might argue in the LDA+U result that the net moment arises from the orbital (with the moments arising from the and orbital canceling). However, the electronic structure in the collapsed phase of this SIC-LSD method is very different from that of the LDA+U method.
VII Discussion and Summary
The results of four correlated band methods – LDA+U, SIC-LSD, pseudo-SIC, and HSE – have been compared for the equation of state (for both normal and collapsed phases), electronic structure (including configuration), and the Mn moment under pressure. In order to make the comparison as straightforward as possible, the crystal structure was kept cubic (rocksalt). To compare seriously with experiment, one must account for the coupling of the AFM order to the structure, because this results in a substantial rhombohedral distortion of the lattice.fang Then structural transitions (particularly to the B8 phase) must also be considered.
The large volume, high-spin phases are qualitatively the same for the various functionals: AFM with a fully-polarized configuration. Due to the large charge transfer energy, the configuration remains at all volumes studied here. The predicted equations of state (which give the equilibrium volume, bulk modulus, and its pressure derivative) show rather strong variation, suggesting that the extension of the Mn and O functions, or their hybridization, differ substantially even in this large volume phase. Of course, since the functionals are different, any given density would lead to different energies.
Under pressure, the gap initially increases (all methods give this behavior), and the system suffers a first-order transition (isostructural, by constraint) to a collapsed phase where hybridization must be correspondingly stronger. Uniformly among the methods, the moment collapse reflects an S= to S= transition, rigorously so for the LDA+U method for which the collapsed phase retains a gap, and less rigorously so for the the other methods where the collapsed phase is metallic. It is remarkable that none of the methods gives a collapse to a nonmagnetic state, which probably would be the most common expectation.
This S= moment collapse is related in some cases to the local symmetry of the Mn orbitals in the AFM phase (being most obvious for the LDA+U results of Fig. 6). The symmetry is , i.e. a singlet and two doublets per spin direction. Without further symmetry-breaking (orbital ordering) an S= transition requires a single spin flip, which could only be the spin. However, the state is more tightly bound than as least one of the two doublets both for LDA+U (Fig. 6) and for pseudo-SIC (Fig. 8). In LDA+U the doublet flips its spin, while in pseudo-SIC the singlet flips its spin leaving the minority and doublets partially occupied and therefore metallic. This symmetry-related behavior depends of course on the magnetic ordering that gives rise to the (electronic) rhombohedral symmetry. Above the Néel temperature, the moment collapse at the Mott transition may proceed differently because the Mn moment would lie at a site of ‘cubic’ symmetry (a dynamic treatment could include the effect of short range spin correlations).
Our study provides some of the first detailed information on how magnetic moments in a real material may begin to disintegrate without vanishing identically, at or near a Mott transition, when correlation is taken into account. It is accepted that dynamic processes will be required for a truly realistic picture of the Mott (insulator-to-metal) transition. However, a moment collapse between two insulating phases (as described here by two of the methods) may be described reasonably by a correlated band (static) approach.
Beyond this similar amount of moment collapse, the four functionals give substantially different collapsed phases: differences in the Mn magnetic configuration (although all remain ) and differences in conducting versus insulating behavior. It is not surprising therefore that the collapsed-phase equations of state differ considerably between the methods.
The differences in predictions can be traced, in principle, to the different ways in which exchange and correlation are corrected with respect to LDA. One clear shortcoming of LDA is in the local approximation to the exchange energy. The HSE method deals with this problem directly, by using 25% Hartree-Fock exchange. The self-interaction of the SIC-LSD method is largely a self-exchange energy correction, subtracting out the spurious self-Coulomb energy that occurs in the Hartree functional if an orbital chooses to localize. A self-(local density) correlation correction is also included in SIC-LSD. The pseudo-SIC method includes the same correction if applied to an atom, but in a crystal the pseudo-SIC energy correction and change in potential takes a substantially different form, as the difference in predictions reflects. The LDA+U method is rather different in this respect: it specifically does not subtract out any self-interaction (although it is sometimes discussed in this way). In the form Eq. 6 of LDA+U correction, the second term is simply an LDA-like average of the first term. The on-site Coulomb repulsion is treated Hartree-Fock like, leading to an orbital-dependent, occupation-dependent potential. Each method has its own strengths, and each is only an anticipated improvement on LDA toward a better, more general functional. It is expected that more details of the results may be published separately by the respective practitioners.
VIII Acknowledgments
D.K., J.K. and W.E.P. acknowledge support from Department of Energy grant DE-FG03-01ER45876. R.L.M. and C.V.D. thank the DOE BES heavy element chemistry program and LANL LDRD for support. The work at Rice University was supported by DOE Grant DE-FG02-01ER15232 and the Welch Foundation. We acknowledges important interactions within, and some financial support from, the Department of Energy’s Stewardship Science Academic Alliances Program. L.P. and T.C.S. were supported by the Office of Basic Sciences, U.S. Department of Energy. N.S. was supported by the National Science Foundation’s Division of Materials Research Information Technology Research program, grant No. DMR-0312407, and made use of MRL Central Facilities supported by the National Science Foundation Award No. DMR-05-20415. This collaboration was stimulated by, and supported by, DOE’s Computational Materials Science Network.
References
- (1) M. Imada, A. Fujimori, and Y. Tokura, Rev. Mod. Phys. 70, 1039 (1998).
- (2) T. Saitoh, A. E. Bouquet, T. Mizokawa, and A. Fujimori, Phys. Rev. B 52, 7934 (1995).
- (3) J. R. Patterson, C. M. Aracne, D. D. Jackson, V. Malba, S. T. Weir, P. A. Baker, and Y. K. Vohra, Phys. Rev. B 69, 220101 (2004).
- (4) C. S. Yoo, B. Maddox, J.-H. P. Klepeis, V. Iota, W. Evans, A. McMahan, M. Hu, P. Chow, M. Somayazulu, D. Häusermann, R. T. Scalettar and W. E. Pickett, Phys. Rev. Lett. 94, 115502 (2005).
- (5) Y. Syono, RIKEN Rev. 27, 72 (2000).
- (6) A. Liebsch, Phys. Rev. Lett. 91, 226401 (2003).
- (7) A. Koga, N. Kawakami, T. M. Rice, and M. Sigrist, Phys. Rev. Lett. 92, 216402 (2004).
- (8) S. Massidda, M. Posternak, A. Baldereschi, and R. Resta, Phys. Rev. Lett. 82, 430 (1999).
- (9) K. Koepernik and H. Eschrig, Phys. Rev. B 59,1743 (1999)
- (10) J.P. Perdew and Y. Wang, Phys. Rev. B 45, 13244 (1992).
- (11) H. Eschrig, K. Koepernik, and I. Chaplygin, J. Solid State Chem. 176, 482 (2003)
- (12) M. T. Czyżyk and G. A. Sawatzky, Phys. Rev. B 49, 14211–28 (1994).
- (13) V. I. Anisimov, F. Aryasetiawan and A. I. Lichtenstein, J. Phys.: Condens. Matter 9, 767 (1997).
- (14) R. D. Cowan, Phys. Rev. 163, 54 (1967).
- (15) I. Lindgren, Intl. J. Quant. Chem. 5, 411 (1971).
- (16) J. P. Perdew and A. Zunger, Phys. Rev. B 23, 5048 (1981).
- (17) W. M. Temmerman, A. Svane, Z. Szotek, and H. Winter, in Electronic Density Functional Theory: Recent Progress and New Directions, edited by J. F. Dobson, G. Vignale, and M. P. Das (Plenum, New York, 1998).
- (18) O. K. Andersen, Phys. Rev. B 12, 3060 (1975).
- (19) O. K. Andersen and O. Jepsen, Phys. Rev. Lett. 53, 2571 (1984).
- (20) A. Svane, W. M. Temmerman, Z. Szotek, J. Laegsgaard, and H. Winter, Intl. J. Quant. Chem. 77, 799 (2000).
- (21) D. Vogel, P. Krüger, and J. Pollman, Phys. Rev. B 54, 5495 (1996).
- (22) Filippetti, A. and Spaldin, N. A., Phys. Rev. B, 67, 125109 (2003).
- (23) A. Svane and O. Gunnarsson, Phys. Rev. Lett. 65, 1148 (1990).
- (24) J. Heyd, G. Scuseria, and M. Ernzerhof, J. Chem. Phys. 118, 8207 (2003); ibid. 124, 219906 (2006).
- (25) J. Heyd and G. Scuseria, J. Chem. Phys., 120, 7274 (2004).
- (26) J. Heyd and G. Scuseria, J. Chem. Phys., 121, 1187 (2004).
- (27) J. P. Perdew, M. Ernzerhof, and K. Burke, J. Chem. Phys. 105, 9982 (1996).
- (28) M. J. Frisch , Gaussian Development Version, Revision C.01. Gaussian, Inc., Wallingford, CT (2004).
- (29) M. D. Towler, N. L. Allan, N. M. Harrison, V. R. Saunders, W.C. Mackrodt, and E. Apra, Phys. Rev. B 50(8), 5041 (1994).
- (30) K. D. Heath, W. C. Mackrodt, V. R. Saunders, and Mauro Causa, J. Mater. Chem. 4(6), 825 (1994).
- (31) M. D. Towler, N. L, Allan, N.M. Harrison, V. R. Saunders, and W. C. Mackrodt, J. Phys.: Condens. Matter 7, 6231, (1995).
- (32) J. Harris, Phys. Rev. B 31(4), 1770 (1985).
- (33) K. N. Kudin, G. E. Scuseria, and R. L. Martin, Phys. Rev. Lett. 89, 266402 (2002).
- (34) I. Prodan, G. E. Scuseria, J. A. Sordo, K. N. Kudin, and R. L. Martin, J. Chem. Phys. 123, 014703 (2005).
- (35) J. C. Slater, Phys. Rev. 82, 538 (1951).
- (36) N. F. Mott, Proc. Phys. Soc. A 62, 416 (1949); Metal-Insulator Transitions (Taylor and Francis, London, 1990).
- (37) L. F. Mattheiss, Phys. Rev. B 5, 290, 306 (1972).
- (38) K. Terakura, T. Oguchi, A. R. Williams, and J. Kübler, Phys. Rev. B 30, 4734 (1984).
- (39) J. E. Pask, D. J. Singh, I. I. Mazin, C. S. Hellberg, and J. Kortus, Phys. Rev. B 64, 024403 (2001).
- (40) M. Posternak, A. Baldereschi, S. Massidda, and N. Marzari, Phys. Rev. B 65, 184422 (2002).
- (41) Z. Szotek, W. M. Temmerman, and H. Winter, Phys. Rev. B 47, 4029 (1993).
- (42) V. I Anisimov, J. Zaanen, and O. K. Andersen, Phys. Rev. B 44, 943 (1991).
- (43) T. Kotani, Phys. Rev. Lett. 74, 2989 (1995).
- (44) T. Kotani and H. Akai, Physica B 237, 332 (1997).
- (45) T. Kotani, J. Phys.: Condens. Matt. 10, 9241 (1998).
- (46) J. D. Talman and W. F. Shadwick, Phys. Rev. A 14, 36 (1976).
- (47) M. Takahashi and J. Igarashi, Phys. Rev. B 54, 13566 (1996).
- (48) I. V. Solovyev and K. Terakura, Phys. Rev. B 58, 15496 (1998).
- (49) S. Y. Savrasov and G. Kotliar, Phys. Rev. Lett. 90, 056401 (2003). The local impurity solver for DMFT was not specified.
- (50) T. Bredow and A. R. Gerson, Phys. Rev. B 61, 5194 (2000).
- (51) C. Franchini, V. Bayer, R. Podloucky, J. Paier, and G. Kresse, Phys. Rev. B 72, 045132 (2005).
- (52) J. Zhang, Phys. Chem. Minerals 26, 644 (1999).
- (53) R. E. Cohen, I. I. Mazin, and D. G. Isaak, Science 275, 654 (1997).
- (54) Z. Fang, I. V. Solovyev, H. Sawada, and K. Terakura, Phys. Rev. B 59, 762 (1999).
- (55) L. Gerward, J. Staun Olsen, L. Petit, G. Vaitheeswaran, V. Kanchana, and A. Svane, J. Alloys Compds. 400, 56 (2005).
- (56) K. Koepernik, D. Kasinathan, and W. E. Pickett, unpublished.