Insights into the fracture mechanisms and strength of amorphous and nanocomposite carbon
Abstract
Tight-binding molecular dynamics simulations shed light into the fracture mechanisms and the ideal strength of tetrahedral amorphous carbon and of nanocomposite carbon containing diamond crystallites, two of the hardest materials. It is found that fracture in the nanocomposites, under tensile or shear load, occurs inter-grain and so their ideal strength is similar to the pure amorphous phase. The onset of fracture takes place at weakly bonded sites in the amorphous matrix. On the other hand, the nanodiamond inclusions significantly enhance the elastic moduli, which approach those of diamond.
pacs:
PACS: 62.20.-x, 68.35.CtThe quest for new superhard materials, with hardness and thermal stability comparable to diamond, has generated intense research at both the fundamental and practical level. Carbon-based materials are considered to be the best candidates for extreme hardness. One of the most widely studied pure carbon materials is tetrahedral amorphous carbon (-C), containing a high fraction of hybrids, with many desirable diamondlike properties Reviews . The nanohardness of -C with 85-90% bonding has been measured to range from 50-60 GPa Pharr-Shi-Martinez to 80 GPa Friedmann , compared to 100 GPa for diamond, which makes it one of the hardest materials.
Nanocomposite carbon is expected to further improve the mechanical properties of pure amorphous phases through the appropriate choice of nanoinclusions. Such a prototypical nanocomposite carbon material consists of diamond crystallites embedded in a -C matrix. The stability of this phase, denoted by -D/-C, was theoretically predicted by Fyta et al. Fyta03 . Its synthesis and growth mechanisms have been explored by Lifshitz and co-workers, in both hydrogenated Lifshitz and pure Yao dense -C matrices.
Despite the importance of amorphous and nanocomposite carbon systems, several critical aspects of their elastic properties and strength remain elusive. The elastic moduli of -C and of “amorphous diamond” (-D), a hypothetical 100% -bonded model, were calculated to be lower than diamond’s KelPRL94 . This indicates that continuous random networks are softer than the equivalent crystal, despite containing the same bonds, but the cause is unclear. Even more, the deformation properties beyond the elastic regime of -C, widely used in applications as a hard coating, and of the equivalent nanocomposite -D/-C are not yet known.
Some of the fundamental issues requiring investigation are: (a) It is well known that diamond’s strength is limited by the existence of easy-slip (cleavage) planes Telling . Such planes do not exist in -D, or -C. Would this make the latter yield at higher stress than diamond and, if not, what is the cause of weakening? (b) The elucidation of fracture mechanisms in both -C and -D/-C. Especially, one asks whether fracture in -D/-C occurs inter- or intra-grain, and which are the weak links leading to fracture. (c) Ultimately, is there any enhancement of elastic moduli and strength of the nanocomposite -D/-C compared to the pure -C phase? Similar questions can be asked for any nanostructured material.
Here, we present the results of state-of-the-art tight-binding molecular dynamics (TBMD) simulations, which shed light into these fundamental issues. We study both the elastic properties and the ideal strength and fracture mechanisms in amorphous and nanostructured carbon. We find that fracture in the nanocomposites occurs inter-grain, in the embedding matrix, and so the ideal strength is similar to that of -C. However, their elastic moduli are significantly enhanced over -C. The onset of fracture takes place at weakly bonded sites.
The TB method is well suited for the present problem. It is more accurate than empirical schemes because it provides a quantum mechanical description of the interactions. On the other hand, while less accurate than ab initio approaches, it yields greater statistical precision and allows the use of larger cells.
We use the TB method developed at the Naval Research Laboratory (NRL) Cohen94 . This is a non-orthogonal model, using distance- and environment-dependent parameters for transferability between different structures. The parameters for C were obtained by fitting to a first-principles database, which includes both the band structure and energies of the diamond, graphite, sc, bcc, and fcc configurations, as well as of the C2 dimer. The fitting of the band structure (as a test, the predicted band structure of C60 matches independent LDA calculations) provides additional robustness to the TB Hamiltonian. This is an important advantage of the present TB method, which enforces the transferability of these parameters to the amorphous state. The fitting was extended to large nearest-neighbor distances, up to 6.6 Å, so the approach properly describes the quantum mechanical effects of bond breaking and microfracture. The calculated phonon frequencies and elastic constants of diamond are reasonably close to experimental values. The equilibrium bulk, shear, and Young’s moduli and the density of diamond are calculated at 480 (443) GPa, 494 (476) GPa, 1300 (1145) GPa, and 3.65 (3.51)g cm-3, respectively, compared to the experimental values given in parentheses. For a review of the NRL/TB scheme, see Ref. Papacon03 .
We use supercells of 512 atoms with periodic boundary conditions (PBC). The -D/-C structures contain a spherical nanocrystal in the middle, surrounded by dense amorphous carbon. It is essential to use cells of this size, something not feasible with first-principles MD methods, in order to describe the nanoinclusions properly, with respect to realistic sizes and volume fractions. Smaller cells are not realistic and are inadequate.
The nanocomposite structures were generated by melting and subsequent quenching at constant volume, in the canonical () ensemble, of a diamond structure, while keeping the atoms in the central spherical region frozen in their positions Fyta03 . After quenching, producing amorphization of the surrounding matrix, the cells are fully relaxed with respect to atom positions and volume. The density and coordination of the matrix is controlled by the initial starting volume of the supercell. The pure -C cells are also generated by quenching from the melt. In both cases, the liquid was prepared at 6000 K, and typical quenching durations and rates used are 40 ps and 300 K/ps, respectively. In addition, we examine the properties of the Wooten-Winer-Waire (WWW) model WWW of -D, which serve as a benchmark for the calculated properties of -C and -D/-C networks. The WWW structure (512 atoms) is fully relaxed with the NRL/TBMD approach. All calculated properties are inferred at 0 K.
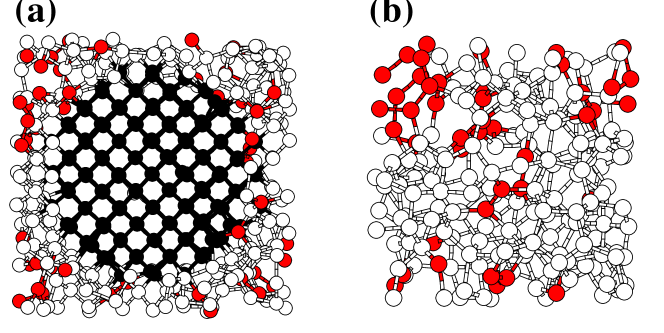
Two of the TBMD-generated structures, at equilibrium, are shown in Fig. 1. Panel (a) portrays a typical nanocomposite network. Due to the PBC, this corresponds to a special case, where we have a homogeneous dispersion of crystallites of equal size in the matrix, at regularly ordered positions. The diamond nanocrystal has a diameter of 12.5 Å and its volume fraction is 31%. The density of the matrix is 3 g cm-3, and its mean coordination is 3.8. Panel (b) shows an equivalent single-phase -C network with the same content and density. The sites are largely clustered. The network contains a considerable fraction of both three- and four-membered (3- and 4-) rings, as computed using the shortest-path criterion of Franzblau Franz . Specifically, there are 20 3- and 38 4- rings. The vast majority of sites involved in such small rings are , 95%. The average bond length in 3- (4-) rings is 1.50 (1.55) Å. These characteristics are in excellent agreement with what state-of-the-art ab initio MD simulations predict Marks-McCull . For example, in a network of a similar density with 125 atoms, three 3- and eleven 4- rings, composed of atoms, with average bond lenghts of 1.5 - 1.6 Å were found. This comparison shows that the present TB method treats accurately the strain energy of sites in small rings. Also, the density–coordination ( fraction) relation for the -C networks is found to be linear, in agreement with experiment and recent TBMD simulations using a different TB Hamiltonian Mathiou .
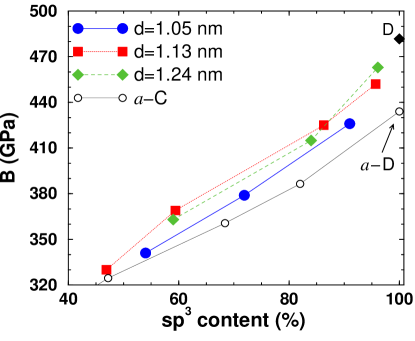
We begin our analysis by examining the elastic properties of the networks. As a representative quantity, we calculated their bulk modulus as a function of the fraction in the cells, by fitting the energy versus volume curves with the Murnaghan equation of state. Fig. 2 shows the variation of for various nanocomposite structures and for single-phase -C. The values for diamond and -D are shown for comparison. The moduli of -C networks ( fraction 60% Fyta03 ) are quite high, and that of -D reaches 90% of the diamond value, confirming previous calculations KelPRL94 ; Mathiou . Clearly, the moduli of -D/-C networks are considerably higher than those of -C. A mean increase over 10% is evident. The enhancement becomes stronger as the fraction, or the density, increases. A similar effect is seen as the size, or volume fraction, of the nanocrystals increases. Impressively, beyond a certain point, ’s are shown to exceed the -D value and approach that of diamond. We conclude that the elastic response of the composite structures to hydrostatic deformation is controlled by the nanoinclusions.
We now turn to the calculations of the ideal strength Zhang ; Blase of the materials under study. This is the maximum stress that a material can sustain under non-hydrostatic loads before becoming unstable and yielding to plastic deformation or fracture. In order to check the validity of the employed method, we calculated the ideal tensile and shear strengths for diamond. From the stress–strain curves (not shown), and in the case of tensile load, we found 209 (225) GPa for the 100 direction, 130 (130) for the 110, and 124 (95) GPa for the 111 direction. In the case of shearing, we found 130 (93) GPa for the {111}112 slip system. Our results are in good agreement with the ab initio results of Telling et al. Telling , given in parentheses, and confirm that the {111} plane is the easy-slip plane in diamond. The corresponding tensile strain at the maximum strength is 0.28, 0.21 and 0.15 for 100, 110 and 111, respectively. The critical shear strain is 0.23.
Having established the reliability of the method, we proceed to the study of our amorphous and nanocomposite structures. For the latter, we apply tensile load in the 111 direction and shear load on the {111} plane in the 112 direction. The crystallographic directions are those of the nanodiamond region. In both cases, we choose the easy-slip plane of diamond, so that we can have a direct comparison to diamond, and examine the possibility that such planes play a significant role in nanocomposites. The a-C phases are highly isotropic, therefore all directions of tensile or shear load are equivalent.
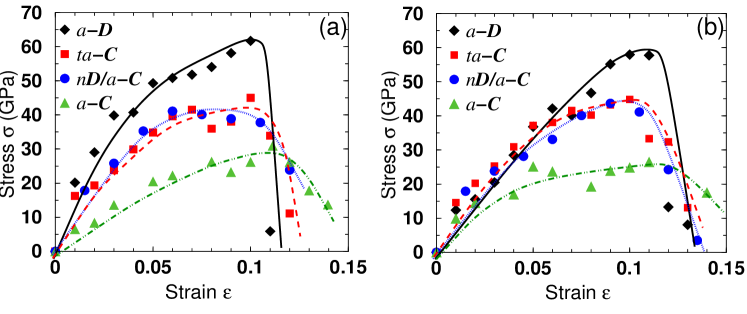
The structures were strained in a series of incremental strains. At each step, atomic positions were fully relaxed with TBMD. The stress was extracted by differentiating the energy with respect to strain. The resulting stress-strain data points and fitted curves, for both tensile and shear load, are shown in Fig. 3. There are a number of important aspects of these results. The first is that all structures have significantly lower ideal strengths and critical strains than diamond, including the -D model which is 100% -bonded and has no planes of cleavage.
Obviously, the difference stems from the weaker character of the C–C bond in the amorphous network. Note that while the modulus of -D reaches 90% that of diamond, its strength is only about half. This indicates softer angular forces, due to dihedral disorder, which render the hybrids more easily unstable under non-hydrostatic stresses at the bond-breaking regime, far from equilibrium. On the other hand, radial rigidity near equilibrium is not so weakened, giving rise to high elastic moduli. In the case of -C, we have, in addition, the presence of sites, which might contribute to the further decrease of strength, as it is evident in Fig. 3. We analyze these issues more deeply below.
Our most striking finding is that the ideal strength of -D/-C is about equal to that of -C, when having equivalent amorphous networks, for both tensile and shear loads. It indicates that the nanoinclusions do not actually contribute to the increase of strength, but that this is rather controlled by the other part of the composite structure, the amorphous matrix.
In order to understand this result, we examined the fracture mechanisms in our networks. For this purpose, we analyzed the microstructure just after the critical strain when bonds start to break. We consider a bond as being broken when its length has become longer than the first minimum in the pair distribution function of the network at equilibrium Galli99 . The so extracted cutoff distances are 1.90 Å, for the amorphous networks, and 1.75 Å for the nanodiamond crystallite. (For -D/-C, the partial functions in the two components were extracted.)
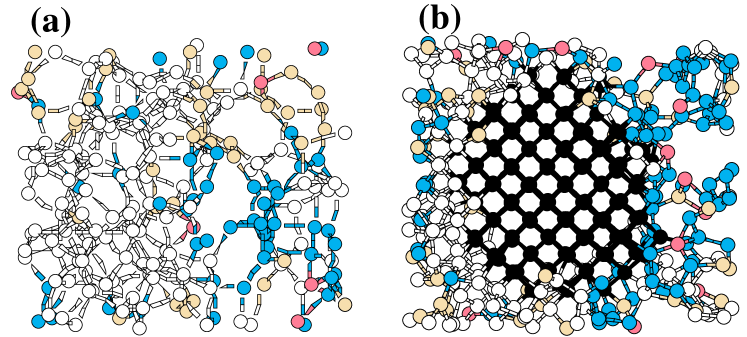
Fig. 4 shows ball and stick models of -C and nanocomposite carbon under critical tensile strain. Atoms that have lost at least one bond are distinguished, according to their hybridization, from atoms with no broken bonds. It is clear that bond breaking in the nanocomposite takes place in the amorphous matrix and not in the nanodiamond, i.e., fracture occurs inter-grain and not intra-grain. Only at the interface some originally elongated nanodiamond bonds are broken. (Stress in the nanodiamonds is mostly concentrated towards the interface Fyta03 .) This picture explains why the ideal strengths and corresponding strains of -D/-C and -C are about equal. The fracture mechanisms in both materials are similar.
Interestingly, the vast majority of atoms involving broken bonds are hybrids, in both the -D/-C and -C materials. This can be understood on the basis of the relative energetics of and hybrids in the amorphous phase. It has been previously shown KelPRL92 that the average atomic energies of and sites in -C are -6.8 and -7.1 eV, respectively, with respect to atomic C. This is a huge energy difference between the two hybrid states compared to the almost degenerate energies in diamond and graphite ( -7.4 eV). Therefore, in the presence of critical strain at the onset of fracture, when bonds have to break, it will be energetically favorable to loose bonds belonging to atoms in the amorphous region. It is clear from Fig. 4 that microfracture originates in -rich clusters.
Then, what is the role of sites, and why the strength of -C is lower than that of the all -bonded -D? A close inspection of the -C network in Fig. 4(a) shows that the reduction is not directly linked to sites, as only few of them have broken bonds, but indirectly through their spatial association with sites. The fracture region involves many clustered sites, but the weak links are exactly those sites in their immediate vicinity. This is because these atoms are under mostly tensile stress KelPRL94 , contrary to the majority of sites which are under the more favorable compressive conditions, and so they have higher atomic energies KelPRL92 . The unstable sites under strain easily give up a bond to become . This is the favored hybrid state on the surfaces KelJNCS ultimately formed by fracture, when the material breaks apart. The absence of sites in the WWW model, acting as precursors for the destabilization of sites, explains its higher strength compared to -C. That the sites are successible to larger plastic deformations is evident in the case of the 50%-50% -C cell, as shown in Fig. 3.
Finally, by extracting the yield stress (defined as the stress where the strain departs 0.2% from linearity) and the Young’s moduli from the stress-strain curves of Fig. 3, and by using the empirical relation of Tabor Tabor , , we estimated the hardness of our networks. We find 90 GPa for -D (WWW), 70 GPa for -C and -D/-C, and 40 GPa for 50%-50% -C, compared to 120 GPa for diamond with the present TB method. The value for -C is in accord with the experimentally reported values. The nanocomposites offer a clear advantage over -C, namely their superior elastic properties. They are also expected to have excellent thermal stability, similar to that shown by -C, and relaxed intrinsic stress, as proposed elsewhereFyta03 . Experimentally, stress relief can be achieved by moderate thermal annealing, as for -C. The combination of these properties make nanocomposite carbon materials very useful for MEMS/NEMS devices.
We are grateful to Shay Lifshitz for providing us with a preprint of the paper in Ref. Yao . This work is supported by a grant from the EU and the Ministry of National Education and Religious Affairs of Greece through the action “EEAEK” (programme “AOPA”.)
References
- (1) For reviews see D.R. McKenzie, Rep. Prog. Phys. 59, 1611 (1996); J. Robertson, Mater. Sci. Eng. R 37, 129 (2002); S.R.P. Silva, in Handbook of Thin Film Materials, edited by H.S. Nalwa (Academic Press, New York, 2002), Vol. 4, p. 403.
- (2) G.M. Pharr et al., Appl. Phys. Lett. 68, 779 (1996); X. Shi et al., Philos. Mag. B 76, 351 (1997); E. Martinez et al., Diamond Rel. Mater. 10, 145 (2001).
- (3) T.A. Friedmann, K.F. McCarty, J.C. Barbour, M.P. Siegal, and D.C. Dibble, Appl. Phys. Lett.68, 1643 (1996).
- (4) M.G. Fyta, I.N. Remediakis, and P.C. Kelires, Phys. Rev. B 67, 035423 (2003); M.G. Fyta, C. Mathioudakis, G. Kopidakis, and P.C. Kelires, Thin Solid Films 482, 56 (2005).
- (5) Y. Lifshitz, T. Kohler, T. Frauenheim, I. Guzmann, A. Hoffman, R.Q. Zhang, X.T. Zhou, and S.T. Lee, Science 297, 1531 (2002).
- (6) Y. Yao, M.Y. Liao, T. Kohler, T. Frauenheim, R.Q. Zhang, Z.G. Wang, Y. Lifshitz, and S.T. Lee, Phys. Rev. B 72, 035402 (2005).
- (7) P.C. Kelires, Phys. Rev. Lett. 73, 2460 (1994).
- (8) R.H. Telling, C.J. Pickard, M.C. Payne, and J.E. Field, Phys. Rev. Lett. 84, 5160 (2000).
- (9) R.E. Cohen, M.J. Mehl, and D.A. Papaconstantopoulos, Phys. Rev. B 50, 14694 (1994); M.J. Mehl and D.A. Papaconstantopoulos, Phys. Rev. B 54, 4519 (1996); D.A. Papaconstantopoulos, M.J. Mehl, S.C. Erwin, and M.R. Pederson, Mater. Res. Soc. Symp. 491, 221 (1998).
- (10) D.A. Papaconstantopoulos and M.J. Mehl, J. Phys: Cond. Matt. 15, R413 (2003).
- (11) F. Wooten, K. Winer, and D. Weaire, Phys. Rev. Lett. 54, 1392 (1985); B.R. Djordjević, M.F. Thorpe, and F. Wooten, Phys. Rev. B 52, 5685 (1995).
- (12) D.S. Franzblau, Phys. Rev. B 44, 4925 (1991).
- (13) N.A. Marks D.R. McKenzie, B.A. Pailthorpe, M. Bernasconi, and M. Parrinello, Phys. Rev. Lett. 76, 768 (1996); D.G. McCulloch, D.R. McKenzie, and C.M. Goringe, Phys. Rev. B 61, 2349 (2000); N.A. Marks, N.C. Cooper, D.R. McKenzie, D.G. McCulloch, P. Bath, and S.P. Russo, Phys. Rev. B 65, 075411 (2002).
- (14) C. Mathioudakis, G. Kopidakis, P.C. Kelires, C.Z. Wang, and K.M. Ho, Phys. Rev. B 70, 125202 (2004).
- (15) Y. Zhang, H. Sun, and C. Chen, Phys. Rev. Lett. 93, 195504 (2004); ibid. 94, 145505 (2005).
- (16) X. Blase, P. Gillet, A. San Miguel, and P. Melinon, Phys. Rev. Lett. 92, 215505 (2004).
- (17) G. Galli, F. Gygi, and A. Catellani, Phys. Rev. Lett. 82, 3476 (1999).
- (18) P.C. Kelires, Phys. Rev. Lett. 68, 1854 (1992); Phys. Rev. B 47, 1829 (1993).
- (19) P.C. Kelires, J. Non-Cryst. Solids 227-230, 597 (1998); C.A. Davis, K.M. Knowles, and G.A.J. Amaratunga, Phys. Rev. Lett. 80, 3280 (1998).
- (20) D. Tabor, Rev. Phys. Technol. 1, 145 (1970).