Structure, stability, and stress properties of amorphous and nanostructured carbon films
Abstract
Structural and mechanical properties of amorphous and nanocomposite carbon are investigated using tight-binding molecular dynamics and Monte Carlo simulations. In the case of amorphous carbon, we show that the variation of fraction as a function of density is linear over the whole range of possible densities, and that the bulk moduli follow closely the power-law variation suggested by Thorpe. We also review earlier work pertained to the intrinsic stress state of tetrahedral amorphous carbon. In the case of nanocomposites, we show that the diamond inclusions are stable only in dense amorphous tetrahedral matrices. Their hardness is considerably higher than that of pure amorphous carbon films. Fully relaxed diamond nanocomposites possess zero average intrinsic stress.
I INTRODUCTION
Amorphous carbon (a-C) has been intensively investigated over the years, but its properties are not fully understood. Some of them are strongly debated. Tetrahedral a-C (ta-C), containing a high fraction of hybrids, is the form of a-C which has drawn most attention because of its diamondlike properties Robertson02 ; Silva02 , including high hardness for mechanical purposes, a wide band gap for optical applications, and biocompatibility for biomedical coatings. Ta-C has also promising applications in micro-electromechanical devices (MEMS).
Recently, nanostructured amorphous carbon (na-C) has attracted attention Sabra98 ; Banhart99 . It is a hybrid form of carbon in which nanocrystallites are embedded in the a-C matrix. These range from nanodiamonds Lifshitz , to open graphene structures with negative curvature (schwarzites) Vanderbilt ; Donadio , to carbyne films (composed of chainlike structures) Barborini ; Ravagnan . The variety of embedded nanostructures, and the great number of possible configurations in the matrix, open some new ways to explore the physics, tailor the mechanical and electronic properties, and extend the applications of a-C.
From a fundamental point of view, the most important characteristic of na-C is its inhomogeneous nature, characterized by large gradients of density and coordination through the system. The challenge for the theorist, therefore, is to provide a global description of the composite material, extending and/or generalizing concepts and trends which apply to the better understood single-phase system.
Here, we present recent work Fyta03 ; Mathiou04 aiming at such a theoretical description. It is based on tight-binding molecular dynamics (TBMD) and Monte Carlo (MC) simulations. We first review work on single-phase a-C pertained to its structure, stress state, and to physical trends followed by the fraction and elastic moduli as a function of density and mean coordination. We then discuss na-C, focusing on diamond nanocomposite films. Emphasis is given on their structure, stability, stress state, and hardness. One of the important findings is that the hardness of nanocomposite films is considerably higher than that of single-phase a-C films.
II METHODOLOGY
In much of the work presented here, we treat the interatomic interactions in a-C networks using the tight-binding (TB) method. This bridges the gap between classical and first-principles calculations. It is more accurate and transferable than empirical schemes, providing a quantum-mechanical description of the interactions, and it yields greater statistical precision than ab initio methods, allowing the use of larger cells.
We use the environment-dependent tight-binding (EDTB) model of Tang, Wang, Chan, and Ho TWCH . This model goes beyond the traditional two-center approximation and allows the TB parameters to change according to the bonding environment. In this respect, it is a considerable improvement over the previous two-center model of Xu, Wang, Chan, and Ho XWCH . Both accuracy and transferability are improved, as shown from recent successful applications Galli1 .
The TBMD simulations are carried out in the canonical () ensemble. is controlled via a stochastic temperature control algorithm. The a-C networks are generated by quenching from the melt. Although not directly related to the kinetics of the growth process of a-C films, it produces generic structures associated with the equilibrium state of the films. (See relevant discussion in Ref. Kel00 .) Cubic computational cells of 216 and 512 atoms with periodic boundary conditions are used. Quenching at different durations and rates was performed to check the effect on the properties. The longer run was for 52 ps and the rate was 226 K/ps. Two other runs lasted for 26 and 12 ps, at 226 K/ps and 500 K/ps, respectively. No significant changes were found. During quenching, the volume/density of the cells was kept constant. After quenching, the density was allowed to relax by changing homogeneously the dimensions of the cells within small increments and seeking energy minimization. The minimum energy and the corresponding density and bulk modulus of each cell were determined by fitting the energy-versus-volume data to Murnaghan’s equation of state Murnaghan .
Diamond nanocomposite cells are generated by melting and subsequent quenching a diamond structure, while keeping a certain number of atoms in the central portion of the cell frozen in their ideal crystal positions. After quenching, which produces amorphization of the surrounding matrix, the cells are thoroughly relaxed with respect to atom positions and density. Cells with varying coordination (density) of the amorphous matrix can be formed by changing the initial starting density (volume) of the diamond structure. The size (radius) of the nanocrystals is controlled by the choice of the number of the shells kept frozen during quenching. Their shape is spherical. The nanocomposite cells produced by TBMD contain 512 atoms.
The TBMD simulations are supplemented by MC simulations using larger cells of 4096 atoms to make certain investigations, such as the stability of nanocomposite films as a function of the density of the amorphous matrix and the stress analysis, tractable. The Tersoff potential is used Terspot .
In addition, we examine the properties of the WWW generic model Wooten ; Djord1 . This is a hypothetical model of “amorphous diamond”, completely tetrahedral, constructed from the diamond lattice by a bond-switching mechanism. We relaxed its topology and density with the EDTB model. The WWW model, although hypothetical, is very useful because it provides an upper bound to the density, fraction, and bulk modulus of single-phase a-C. Its properties can then be compared to the respective ones from diamond nanocomposites.
III RESULTS AND DISCUSSION
III.1 Single-phase a-C
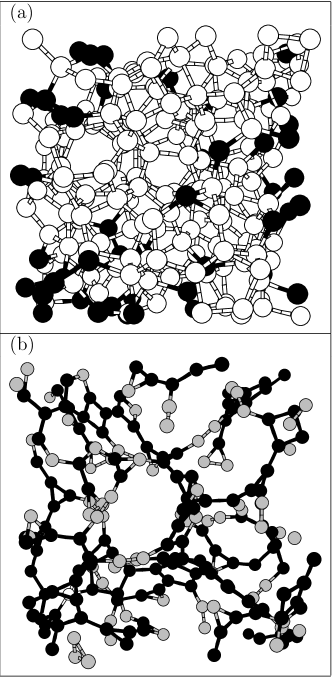
We first discuss the pure a-C phase, reviewing past and recent work. To examine its microstructure, let us look at two representative examples, among the sequence of structures characterized by different density and fraction. One for the ta-C dense phase, and the other for a low-density phase. Their networks are portrayed in Fig. 1.
The ta-C network in panel (a) has a density of 2.99 gcm-3, it shows a clear predominance of bonding (79%), and it reveals that the sites are largely clustered Frau93 ; Drabold ; Marks96 . Clustering is present in the form of olefinic, chainlike geometries. The chains are isolated and do not link (percolate) to a single spanning cluster, in agreement with ab initio work Marks96 . The driving force behind the clustering effect is stress relief. Earlier work Kel00 , addressing the issue of local rigidity in ta-C, showed that clustering contributes stress relief and rigidity to the network. This depends on the degree of clustering. The larger the cluster, the higher the stress relaxation and the contribution to rigidity in the network.
The low-density network in panel (b) has a density of 1.20 gcm-3 and contains only 1% of sites. It has an open structure with long chains and large rings, and with numerous sites (33%). This network should be typical of cluster-assembled carbon films Barborini ; Ravagnan with an amorphous character and a sizeable carbyne ( chains) component. Such films have attracted attention for various applications, including field emission, catalysis, and gas absorption.
Analysis of the ring statistics in the ta-C networks reveals the existence of three- and four-membered rings. (The shortest-path criterion of Franzblau Franzblau was used to define the ring sizes.) This is the first tight-binding model which predicts three-membered rings in ta-C, in agreement with ab initio MD simulations Marks96 using the Car-Parrinello method. The five-membered rings are slightly more numerous than the six-membered rings and significantly more numerous than the seven-membered ones.
The issue of intrinsic stress and its association to bonding in ta-C films has been strongly debated over the years. We have now reached at a rather clear picture of this issue. We summarize here the important points. Work by McKenzie and co-workers McKenz1 proposed that the compressive stress in ta-C is produced by the energy of ion bombardment in the deposition process which gives rise to local compression, accompanied by the shallow implantation of incoming atoms. Their model considers the compressive stress as the causative factor for the formation of sp3 sites and supports the idea of a transition from an sp2-rich to an sp3-rich phase at a critical value of the average compressive stress (about 4-5 GPa) which stabilizes the sp3 bonding.
While this scenario can not be ruled out for as-grown films, it fails to describe the stress state of post-growth annealed/relaxed films. It has now become apparent, after a series of theoretical works by Kelires Kel00 ; Kel94 ; Kel01Phy and thermal annealing experiments Friedmann ; Ferrari ; Kalish ; Alam , that the intrinsic stress is not a crucial factor for the stabilization of sp3 bonding. A critical average compressive stress necessary to sustain a high fraction of sp3 sites, as required by the McKenzie model, does not exist. This conclusion is borne out of the local atomic stress model of Kelires Kel94 , which proposes that the average intrinsic stress of relaxed ta-C films can be zero, while stress at the atomic level can be finite and substantial. It further says that the favored stress state of sp3 sites is compression, while that of sp2 sites is tension, the latter playing the role of relieving stress in the network.
According to the local stress model, the as-grown, highly strained and sp3-rich ta-C films are in a metastable state with respect to the relaxed, stress-free and still sp3-rich “quasi-equilibrium” ta-C structures. (True equilibrium structures are the graphite-like sp2-rich films.) The as-grown films possess high intrinsic stress because the stressed non-equilibrium local structures are frozen-in during deposition, but the network at the low deposition temperatures does not acquire enough energy, or it is very slow at typical times in the laboratory, in order to overcome the potential barrier between the two states and relax the excessive stress. Post-growth thermal annealing at moderate ’s has proved to be a very efficient mechanism for providing the necessary energy in ta-C films to reach their quasi-equilibrium, stress-free state. The stress relief can be achieved with minimal structural modifications Ferrari ; Sullivan , without reducing the sp3 fraction. However, further annealing above 1200 K transforms ta-C into the graphite-like sp2-rich phase.
Another issue which is still unclear regards the variation of fraction or, equivalently, of mean coordination , with density. The basic question underlying this issue is whether there is a linear relationship between these two quantities. We have recently carried out an extensive investigation Mathiou04 of this issue through the entire range of densities relevant to a-C, using the TBMD method. Several networks have been generated, at various quenching rates, providing sufficient statistics to reach a definite conclusion. We also compare to the WWW network relaxed with the EDTB model.
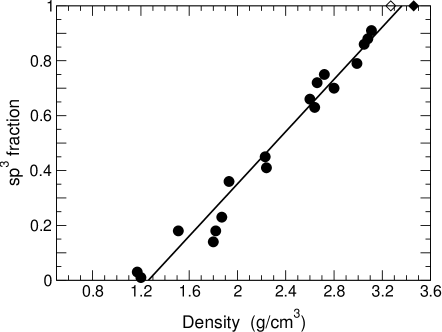
The variation of fraction with density is shown in Fig. 2. (Hybrid fractions are extracted by counting neighbors within and up to the first minimum of the pair distribution functions, not shown.) Without any doubt, the variation is linear through the entire range of possible densities. A linear fit to the points gives
| (1) |
Eq. (1) predicts the minimum density required to sustain bonding in a-C to be 1.3 gcm-3. The sites are needed in such low-density networks as linking geometries between the main and components. For 100% bonding, the corresponding density is 3.35 gcm-3. This is slightly higher than the density of the WWW network, but still less than diamond’s by 3%. We conclude that this is the upper limit in the possible densities of ta-C. The highest densities for ta-C reported until now by experiment are less than 3.3 gcm-3.
Unfortunately, experimental results do not provide a clear picture of this issue. Different growth and characterization techniques give sets of data which show a linear variation within the respective set, but not when viewed all together. (A thorough discussion of this point is given in Ref. Mathiou04 .) Very good agreement between theory and experiment holds for the ta-C region, i.e., for densities higher than 2.8 gcm-3. At lower densities, experimental points scatter from method to method. For example, data extracted from samples prepared by filtered cathodic vacuum arc (FCVA) deposition Fallon ; FerrPRB00 differ from data extracted from samples prepared by magnetron sputtering (MS) Schwan97 . A linear fit over the FCVA data was carried out by Ferrari et al. FerrPRB00 , yielding (g/cm = 1.92 + 1.37 ( fraction). This gives a density of 3.3 gcm-3 for 100% content, in good agreement with our upper limiting value, but the lower limit at 1.92 gcm-3 is higher than ours, suggesting that hybrids are absent in networks with lower densities. This can not explain reports of sites in low-density carbyne films Barborini ; Ravagnan . Note, however, that there are uncertainties in the measurements, usually by EELS, of the content in such films.
An equally interesting physical trend in a-C is the variation of elastic moduli as a function of mean coordination. We seek to find simple formulas able to predict the hardness and related properties for any given network, over the entire range of densities.
Thorpe and collaborators Thorpe85 ; Djord2 suggested that the elastic moduli of bond-depleted crystalline diamond lattices and of bond-depleted “amorphous diamond” networks (WWW model) follow a power-law behavior , with the exponent taking the value 1.5 0.2. This mean-field equation is characteristic of percolation theory, and describes the contributions to rigidity from the local components of the system as they connect to each other. The critical coordination = 2.4, denotes the transition from rigid to floppy behavior, and comes out of the constraint-counting model of Phillips Philips79 and Thorpe Thorpe83 .
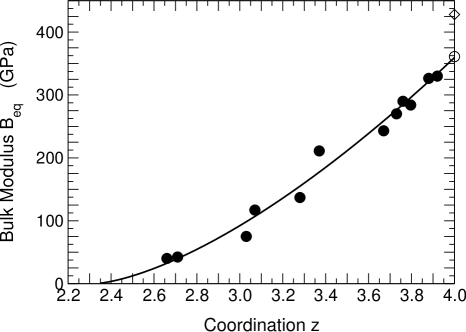
We examined whether more realistic a-C networks can be described by the constraint-counting model, and if their moduli exhibit a power-law behavior. For this, we used the cells generated by TBMD simulations and the EDTB model. As a representative quantity, we calculated the equilibrium bulk modulus . The results for for several networks as a function of are given in Fig. 3. Also included in this figure is the computed for diamond (428 GPa) and for the WWW model (361 GPa). The latter value coincides with that calculated with the Tersoff potential for WWW Kel00 ; Kel94 ; Kel01Diam . The computed data can be fitted to the power-law relation
| (2) |
where is the bulk modulus of the fully tetrahedral amorphous network, for which = 4.0. Letting all fitting parameters in Eq. (2) free, we obtain = 361 GPa, which is exactly the computed value for WWW, = 2.25, and = 1.6. (For a measure of the quality of the fit: = 0.9907). If we fix to be 1.5 ( = 0.9906), we get 2.33 for , and if we fix to be 2.4 ( = 0.9904), we get 1.4 for . We thus conclude that the variation confirms the constraint-counting theory of Phillips and Thorpe, with a critical coordination close to 2.4, and it has a power-law behavior with a scaling exponent . For convenience, let us use , so the modulus obeys the relation
| (3) |
Our theory also predicts that “amorphous diamond” is softer than diamond by 10%.
Comparison of these results with experimental moduli derived from surface acoustic waves Schultrich (SAW) and surface Brillouin scattering FerrAPL99 (SBS) measurements is very good, especially in the ta-C region. For example, the computed modulus for 3.9 equals 330 GPa and nearly coincides with the SBS data. The agreement is less good at lower coordinations, where a fit to experimental points Robertson02 ; Mathiou04 extrapolates to = 2.6, higher than the constraint-counting prediction.
III.2 Diamond nanocomposite films
Diamond nanocomposites consist of diamond nanocrystals embedded in an a-C matrix Lifshitz . They are produced by chemical vapor deposition (CVD) via a multistage process Lifshitz , and they differ from pure nanodiamond films with no a-C component Gruen . All diamond nanocomposite films reported until now contain a hydrogenated a-C matrix. Recently, nanodiamonds in pure a-C have been successfully grown Shay . Their structure, either with or without H, is rather well known experimentally, but their stability and most of their properties, including mechanical, are not yet understood.
A first step towards a theoretical description of these films was done recently in our group Fyta03 . We summarize here the most important findings of this investigation, based on MC simulations with the Tersoff potential, and we also provide supplementary new results from TBMD simulations using the EDTB model.
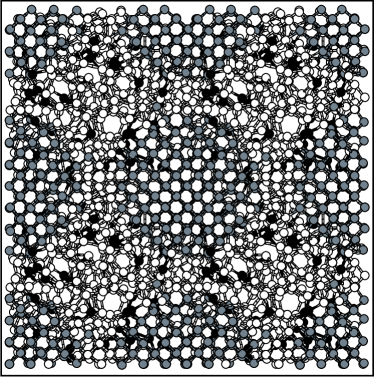
A representative diamond nanocomposite network, generated by TBMD, is portrayed in Fig. 4. It shows a spherical diamond nanocrystal, whose diameter is 12.5 Å, positioned in the middle of the cell and surrounded by the a-C matrix. Part of the image cells, due to the periodic boundary conditions, are also shown. This would correspond to an ideal case with a homogeneous dense dispersion of crystallites of equal size in the matrix, at regularly ordered positions. The nanodiamond volume fraction is 31%. The density of the a-C matrix is 3 gcm-3 and its mean coordination is 3.8. The size of the diamond crystallite is smaller than seen experimentally, but the overall structure captures the essential features of CVD grown nanocomposite films, especially the non-hydrogenated ones.
A crucial issue is the stability of the diamonds as a function of the coordination/density of the embedding medium. This extensive investigation required the analysis of many composite structures and it was done through MC simulations using larger cells (4096 atoms) Fyta03 . The quantity of interest is the formation energy of a nanocrystal , which can describe the interaction of the embedded configuration with the host. It is defined as
| (4) |
where is the total cohesive energy of the composite system (amorphous matrix plus nanocrystal), calculated directly from the simulation, is the cohesive energy per atom of the respective crystalline phase, is the number of atoms in the nanocrystal, is the number of atoms in the amorphous matrix, and is the cohesive energy per atom of the pure, undistorted amorphous phase (without the nanocrystal) with coordination . A negative value of denotes stability of the nanostructure, a positive value indicates metastability or instability.
The variation of as a function of for a diamond with a fixed size embedded in several matrices is shown in Fig. 5. was computed from a series of calculations on pure a-C cells. (For details see Ref. Fyta03 .) The most striking result of this analysis is that diamonds are stable in matrices with higher than 3.6 ( 2.6 gcm-3), and unstable, or metastable depending on temperature, in matrices with lower densities. This nicely explains experimental results from different laboratories indicating that diamond nanocrystals precipitate in a dense a-C matrix Lifshitz ; Shay .
One way of checking the stability of nanocrystals is to subject them to thermal annealing. A stable structure should be sustained in the amorphous matrix, while a metastable structure should shrink in favor of the host. Indeed, analysis of the structure of diamonds annealed at high (1500 - 2000 K) reveals Fyta03 that metastable nanocrystals become heavily deformed in the outer regions near the interface with the amorphous matrix. Since only a small core remains intact, this means that the diamonds extensively shrink. On the other hand, the stable nanodiamonds are only slightly deformed and retain their tetrahedral geometry.
In addition, a stable nanodiamond has, in principle, the potential to expand against the surrounding matrix, provided that the barriers for this transformation can be overcome, possibly by further annealing or ion irradiation. This means that nucleation of diamond cores in a dense matrix might lead, under the appropriate experimental conditions, to a fully developed nanostructured material with large grains.
The observation that diamonds are stable only in dense matrices suggests a quantitative definition of ta-C, vaguely referred to as the form of a-C with a high fraction of sp3 bonding. We can define ta-C as the form of a-C with a fraction of sp3 sites above 60%, in which diamond nanocrystals are stable (see Fig. 5). In other words, the predominantly tetrahedral amorphous network of ta-C is able to sustain crystalline inclusions. Networks with sp3 fractions below 60% do not belong to the class of ta-C materials, because they can not be transformed into a stable nanocrystalline state.
The intrinsic stress of the diamond nanocrystals and of the whole composite material is a crucial quantity. As for pure ta-C, the average stress influences the adhesion properties of the films. The stress within the nanodiamonds is indicative of their stability in a-C matrices. To examine these issues, we calculated the stress fields in the nanocomposite cells, using as a probe the tool of atomic level stresses, as in the case of single-phase amorphous carbon Kel00 ; Kel94 ; Kel01Diam . This gives us the ability to extract the stress built up in the nanodiamond and separate it from the stress in the matrix, by summing up the atomic stresses over the desired region.
The first important aspect of this analysis is that, in all cases studied, the average intrinsic stress in the fully relaxed composite material is less than 1 GPa, practically zero, even in the highly tetrahedral cases. This means, as in the case of pure ta-C, that diamond nanocomposite films are able to eliminate any compressive stress generated during growth, when brought into their equilibrium state, perhaps by moderate thermal annealing. The stress in as-grown films has not yet been experimentally reported.
The other important finding is that the stress in the nanocrystal is always found to be tensile, while it is compressive in the matrix, yielding a net zero stress. This contrast can be explained by noting that the density of the embedding medium is lower than that of the diamond inclusions. As a result, atoms in the latter are forced to strech their bonds in order to conform with the lower density of the environment.
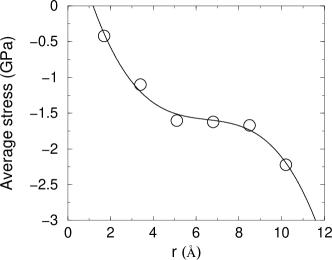
A typical example of the stress state and its variation in a nanodiamond is shown in Fig. 6. The nanocrystal has a diameter of 17 Å, and is embedded in a ta-C matrix with = 3.9. The atomic stresses are averaged over spherical shells starting from the center and moving towards the interface. Negative values denote tensile stresses Kel94 . The stress in the core of the diamond is very small, since the effect of the medium is weak, but it rises up as we move outwards, especially near the interface. This is logical. Atoms near the interface strongly feel the influence of the medium. However, the average tensile stress is low, -1.5 GPa/atom, because the density gradient between the nanodiamond and the matrix is small.
Obviously, the larger the density gradient the higher the tension felt by the inclusion. For example, when = 3.84, the nanodiamond stress is -6.3 GPa/atom, and when = 3.75, it becomes -9 GPa/atom. This trend explains the lowering of the relative stability of diamonds as gets smaller (Fig. 5). Tension substantially increases at the outer regions of the nanodiamond, leading to deformation and eventually to amorphization and shrinking. This is remarkably evident for nanodiamonds in the region of metastability, where the intrinsic tensile stress becomes huge. For example, for a matrix with = 3.3, the average stress in a typical nanodiamond is -30 GPa/atom.
Finally, we briefly comment on the hardness of these nanocomposite materials. Their mechanical properties are not yet measured experimentally. We have preliminary results of calculations of the bulk modulus of diamond nanocomposites, generated by TBMD/EDTB simulations, a typical example of which is shown in Fig. 4. We find moduli which are considerably higher than moduli of single-phase films of the same density, as calculated using Eq. (3). For example, for a nanocomposite with a total 3.75 and a density of 2.85 gcm-3, the modulus approaches 350 GPa. Eq. (3) predicts 280 GPa for a pure a-C network having the same . This represents a drastic 25% increase in strength, and opens up the possibility for even harder ta-C materials for coatings and MEMS applications. A comprehensive account of the elastic properties of diamond nanocomposites will be given elsewhere.
IV CONCLUSIONS
Results from TBMD and MC simulations of pure a-C and diamond nanocomposite networks are presented. Definite trends in a-C regarding the variation of the fraction and the bulk moduli as a function of coordination/density are shown to firmly hold. Nanodiamonds are stable only in dense ta-C matrices. The nanocomposite films are harder than pure a-C films of the same density. They possess zero intrinsic stress when they are fully relaxed.
References
- (1) J. Robertson, Mater. Sci. Eng. R 37 (2002) 129.
- (2) S.R.P. Silva, In: H.S. Nalwa (Ed.), Handbook of Thin Film Materials, vol. 4, Academic Press, New York, 2002, p. 403.
- (3) S. Subramoney, Adv. Mater. 10 (1998) 1157.
- (4) F. Banhart, Rep. Prog. Phys. 62 (1999) 1182.
- (5) Y. Lifshitz, T. Kohler, T. Frauenheim, I. Guzmann, A. Hoffman, R.Q. Zhang, X.T. Zhou, and S.T. Lee, Science 297 (2002) 1531; X.T. Zhou, Q. Li, F.Y. Meng, I. Bello, C.S. Lee, S.T. Lee, and Y. Lifshitz, Appl. Phys. Lett. 80 (2002) 3307.
- (6) D. Vanderbilt and J. Tersoff, Phys. Rev. Lett. 68 (1992) 511.
- (7) D. Donadio, L. Colombo, P. Milani, and G. Benedek, Phys. Rev. Lett. 83 (1996) 776.
- (8) E. Barborini, P. Piseri, A. Li Bassi, A.C. Ferrari, C.E. Bottani, and P. Milani, Chem Phys. Lett. 300 (1999) 633.
- (9) L. Ravagnan, F. Siviero, C. Lenardi, P. Piseri, E. Barborini, P. Milani, C.S. Casari, A. Li Bassi, and C.E. Bottani, Phys. Rev. Lett. 89 (2002) 285506.
- (10) P.C. Kelires, Phys. Rev. Lett. 68 (1992) 1854; Phys. Rev. B 47 (1993) 1829.
- (11) M.G. Fyta, I.N. Remediakis, and P.C. Kelires, Phys. Rev. B 67 (2003) 035423.
- (12) C. Mathioudakis, G. Kopidakis, P.C. Kelires, C.Z. Wang, and K.M. Ho, Phys. Rev. B (to be published).
- (13) M.S. Tang, C.Z. Wang, C.T. Chan, and K.M. Ho, Phys. Rev. B 53 (1996) 979.
- (14) C.H. Xu, C.Z. Wang, C.T. Chan, and K.M. Ho, J. Phys.: Condens. Matter 4 (1992) 6047.
- (15) J.-Y. Raty, G. Galli, C. Bostedt, T.W. van Buuren, and L.J. Terminello, Phys. Rev. Lett. 90 (2003) 037401.
- (16) P.C. Kelires, Phys. Rev. B 62 (2000) 15686.
- (17) F.D. Murnaghan, Proc. Natl. Acad. Sci. U.S.A. 30 (1944) 244.
- (18) J. Tersoff, Phys. Rev. Lett. 61 (1988) 2879.
- (19) F. Wooten, K. Winer, and D. Weaire, Phys. Rev. Lett. 54 (1985) 1392.
- (20) B.R. Djordjević, M.F. Thorpe, and F. Wooten, Phys. Rev. B 52 (1995) 5685.
- (21) T. Frauenheim, P. Blaudeck, U. Stephan, and G. Jungnickel, Phys. Rev. B 48 (1993) 4823.
- (22) D.A. Drabold, P.A. Fedders, and P. Stumm, Phys. Rev. B 49 (1994) 16415.
- (23) N.A. Marks, D.R. McKenzie, B.A. Pailthorpe, M. Bernasconi, and M. Parrinello, Phys. Rev. Lett. 76 (1996) 768; Phys. Rev. B 54 (1996) 9703.
- (24) D.S. Franzblau, Phys. Rev. B 44 (1991) 4925.
- (25) D. R. McKenzie, Rep. Prog. Phys. 59 (1996) 1611; D. R. McKenzie, D. Muller, and B. A. Pailthorpe, Phys. Rev. Lett. 67 (1991) 773.
- (26) P.C. Kelires, Phys. Rev. Lett. 73 (1994) 2460.
- (27) P.C. Kelires, Physica B 296 (2001) 156.
- (28) T.A. Friedmann, J.P. Sullivan, J.A. Knapp, D.R. Tallant, D.M. Follstaedt, D.L. Medlin, and P.B. Mirkarimi, Appl. Phys. Lett. 71 (1997) 3820.
- (29) A.C. Ferrari, B. Kleinsorge, N.A. Morrison, A. Hart, V. Stolojan, and J. Robertson, J. Appl. Phys. 85 (1999) 7191.
- (30) R. Kalish, Y. Lifshitz, K. Nugent, and S. Prawer, Appl. Phys. Lett. 74 (1999) 2936.
- (31) T.M. Alam, T.A. Friedmann, P.A. Schultz, and D. Sebastiani, Phys. Rev. B 67 (2003) 245309.
- (32) J.P. Sullivan, T.A. Friedmann, and A.G. Baca, J. Electron. Mater. 26 (1997) 1021.
- (33) P.J. Fallon, V.S. Veerasamy, C.A. Davis, J. Robertson, G.A.J. Amaratunga, W.I. Milne, and J. Koskinen, Phys. Rev. B 48 (1993) 4777.
- (34) A.C. Ferrari, A. Libassi, B.K. Tanner, V. Stolojan, J. Yuan, L.M. Brown, S.E. Rodil, B. Kleinsorge, and J. Robertson, Phys. Rev. B 62 (2000) 11089.
- (35) J. Schwan, S. Ulrich, T. Theel, H. Roth, H. Ehrhardt, P. Becker, and S.R.P. Silva, J. Appl. Phys. 82 (1997) 6024.
- (36) H. He and M.F. Thorpe, Phys. Rev. Lett. 54 (1985) 2107.
- (37) B.R. Djordjević and M.F. Thorpe, J. Phys.: Condens. Matter 9 (1997) 1983.
- (38) J.C. Phillips, J. Non-Cryst. Solids 34 (1979) 153.
- (39) M.F. Thorpe, J. Non-Cryst. Solids 57 (1983) 355.
- (40) P.C. Kelires, Diam. Relat. Mater. 10 (2001) 139.
- (41) B. Schultrich, H.J. Scheibe, D. Drescher, and H. Ziegele, Surf. Coatings Technol. 98 (1998) 1097.
- (42) A.C. Ferrari, J. Robertson, M.G. Beghi, C.E. Bottani, F. Ferulano, and R. Pastorelli, Appl. Phys. Lett. 75 (1999) 1893.
- (43) D.M. Gruen, Ann. Rev. Mater. Sci. 29 (1999) 211.
- (44) Y. Lifshitz, private commun.