Three-dimensional imaging of colloidal glasses under steady shear
Abstract
Using fast confocal microscopy we image the three-dimensional dynamics of particles in a yielded hard-sphere colloidal glass under steady shear. The structural relaxation, observed in regions with uniform shear, is nearly isotropic but is distinctly different from that of quiescent metastable colloidal fluids. The inverse relaxation time and diffusion constant , as functions of the local shear rate , show marked shear thinning with over more than two decades in . In contrast, the global rheology of the system displays Herschel-Bulkley behavior. We discuss the possible role of large scale shear localization and other mechanisms in generating this difference.
pacs:
83.50.Ax, 83.60.-a, 83.80.Hj, 83.85.EiGlassy materials are ubiquitous in nature and in industry; examples range from molecular and metallic glasses molglass ; metglass to soft glasses like colloidal suspensions, emulsions and foams rheoLarsonBook ; SollichCatesPRL97_softglassyrheology . Of special importance, both fundamentally and practically, is their rheological behavior. Glasses have liquid-like microstructure, but solid-like mechanical behavior. At low applied stress, they have finite shear moduli, but at sufficient stresses they yield and display highly nonlinear flow behavior.
Among the many open issues in nonlinear glassy rheology, steady shear stands as the simplest example, yet it is far from being fully understood. Theories SollichCatesPRL97_softglassyrheology ; Berthier ; FuchsCatesPRL02_nonlinearheo ; Falk have invoked various mechanisms for shear-induced relaxation of initially arrested structures, predicting a variety of constitutive relations. Significantly, all these theories assume globally uniform shear. Simulations, so far the main tool to check directly the relation between microscopic behavior and macroscopic flow, reveal spatially heterogeneous relaxation Falk ; YamamotoOnukiPRE98PRL98 and strong shear thinning BerthierJChemPhys02 ; Miyazaki04 . Experiments are just starting to address microscopic dynamics under shear, but have been limited to coarse-grained data, two dimensional (2D) or interrupted flows, or ordering phenomena Petekidis ; Hebraud ; rheoimage ; BonnPRL02_laponiteagingrejuvenationrheo . Moreover, experiments imaging global flow CoussotBecubanding as well as boundary driven simulations of Lennard-Jones (LJ) glasses VarnikBarratPRL03_LJshearlocali show that (soft) glasses often exhibit shear localization, which can not be described by simple constitutive laws.
In this Letter we report a three-dimensional (3D) imaging study of the microscopic relaxation in a colloidal glass under steady shear. The relaxation is nearly isotropic but different from that of unsheared colloidal fluids. The inverse relaxation time and the diffusion constant show marked shear thinning as a function of the local shear rate : . We find that this local behavior contrasts significantly with the global rheology, which shows Herschel-Bulkley behavior.
We used sterically-stabilized polymethylmethacrylate (PMMA) particles (radius nm, measured by light scattering, polydispersity fn_polydisp ) fluorescently labelled with nitrobenzoxadiazole and suspended in a mixture of cycloheptyl bromide and decalin (viscosity 2.6 mPas) for density and refractive index matching. In this medium particles acquire a small charge YethirajNature03_CHBmodelsystem which is largely screened by adding 4 mM tetrabutylammonium chloride, giving nearly hard-sphere (HS) behavior, with a glass transition at volume fraction (determined from mean-squared displacements) fn_expversusHS ; we work at (measured by imaging). The reduced shear rate, or Péclet number, is , with the bare diffusion coefficient and = 1.24 s the Brownian time in our system. Our experiments cover the range .
We employ a linear parallel-plate shear cell with a plate separation m, parallel to over a mm2 drop of colloid confined between the plates by surface tension. We define , and as the velocity, vorticity (or neutral) and gradient directions respectively. The top plate is driven at m/s by a mechanical actuator with magnetic encoder, and steady shear is applied up to a total accumulated strain of . Wall slip and wall-induced ordering were prevented by coating the slides with 1-3 disordered layers of particles. A solvent bath minimized evaporation.
A m3 volume in the drop (containing particles) was imaged from below as a stack of slices using a fast confocal scanner (VT-Eye, Visitech International) and a Nikkon TE Eclipse inverted microscope. The scanning of each 3D stack took s. Particles were located with resolution nm and nm CrockerGrierJColIntSc96_tracking . Tracking from frame to frame was achieved by first subtracting from the raw coordinates a time () dependent -displacement profile , measured via correlation analysis of raw images, and adding this back after particle tracking. The resulting -displacements over a given time interval , ( to ), always have an average linear dependence on . From this we checked that the sample in our imaged volume was indeed subjected to uniform shear, and measured the actual (local) shear rate , which may differ from the applied (global) rate due to shear localization and the presence of jammed regions. We will return to this point; for now we focus on steady states with a linear velocity profile in a region from m above the cover slide. When present, strong decay in the shear rate occurs at least away from imaged regions. We also checked, via bond-order analysis fn_localorder , that shear-induced crystallization was absent for our range of HSshearorder .
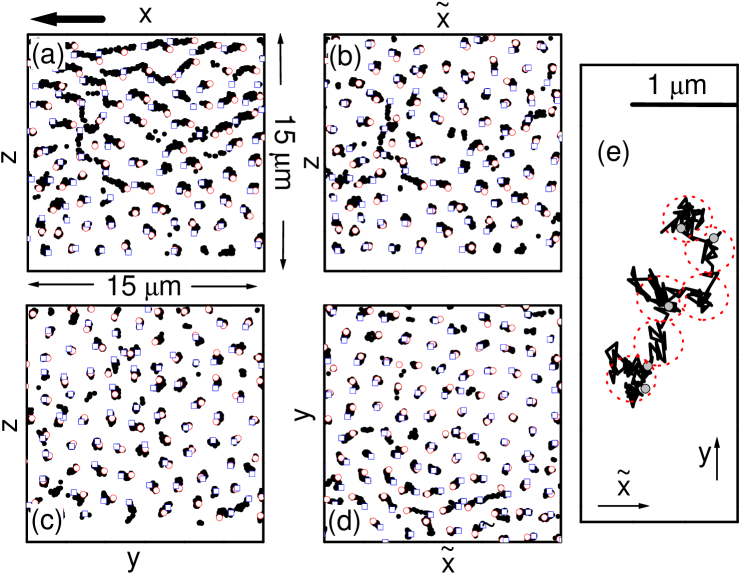
Figure 1(a) shows the trajectories in an slice at s-1. The displacement gradient due to shear is evident. To highlight the shear-induced dynamics, we show in Fig. 1(b) the non-affine component of the motion obtained by subtracting the uniform shear via . Considerable shear-induced non-affine displacements are seen in this plane as well as in the other planes, Figs. 1(c,d). On the time scale considered here, these rearrangements are heterogeneous, somewhat similar to observations in quiescent concentrated colloidal fluids for Weeks_Kegel . Zooming in on a single particle, Fig. 1(e), we observe that its dynamics under shear consists of intervals of cage ‘rattling’, interrupted by shear-induced plastic cage-breaking events.
Next, we study the relaxation via the incoherent scattering function, , at a scattering vector where the data’s structure factor shows a peak. In Fig. 2 we show selected results for , but the results (not shown) for and , using the non-affine displacements for the latter, are similar. for the quiescent glass () hardly decays over our observation window, reflecting the caging of particles by their neighbors; at longer times we observed aging, as in other studies BonnPRL02_laponiteagingrejuvenationrheo ; CourtlandWeeksJPCM03_agingglassconfocal . The short time decay due to initial cage exploration ( MegenPRE98_tracersinglass , dashed line in Fig. 2) is inaccessible to us. At small , at short times still exhibits a plateau, in agreement with the caging in Fig. 1(e). As increases, this plateau shrinks and for the highest it vanishes and likely merges with the short time decay. At longer times, decays strongly for all , marking shear-induced structural relaxation and cage rearrangements. The structural (-)relaxation time , defined by , decreases on increasing . Importantly, is independent of the starting time (see data for s-1), i.e., a stationary state is achieved.
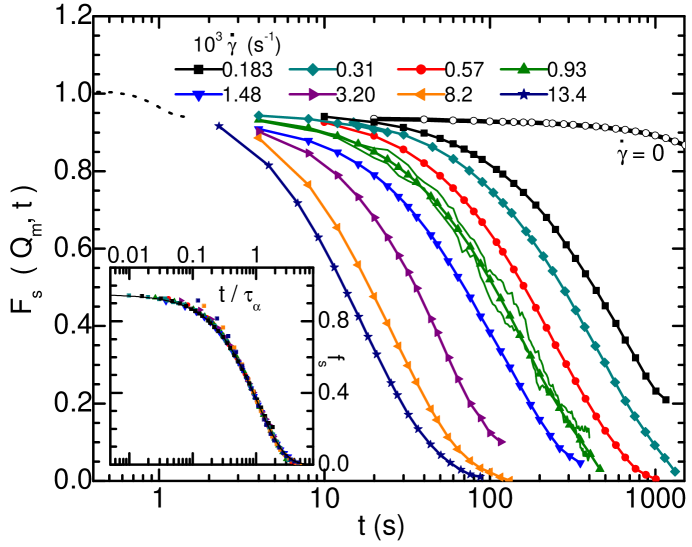
Our data confirms the theoretically-predicted ‘time-shear superposition principle’ Berthier ; FuchsCatesPRL02_nonlinearheo : when time is scaled by , the -relaxation follows a master curve , Fig. 2 inset. As in LJ simulations BerthierJChemPhys02 , our is a pure exponential. This differentiates a shear-melted glass from a dense HS colloidal fluid at and , where we find stretched exponential behavior for , as can also be deduced from MegenPRE98_tracersinglass .
Figure 3(a) shows the dependence of on the shear rate. It exhibits a power law with fn_tauaphi , independent of the criterion or used to determine . This behavior means that the accumulated strain at is not constant but varies as . The data are consistent with a schematic model Berthier for driven glasses and also match the ‘creep’ behavior of a driven particle in a correlated random potential Horner96 . We note that an ’entropic barrier hopping’ model KobelevSchweizer_shear , without any ’ideal’ glass divergences, shows a very similar dependence of the ’hopping’ time on . Below we discuss the rheological implications of this behavior.
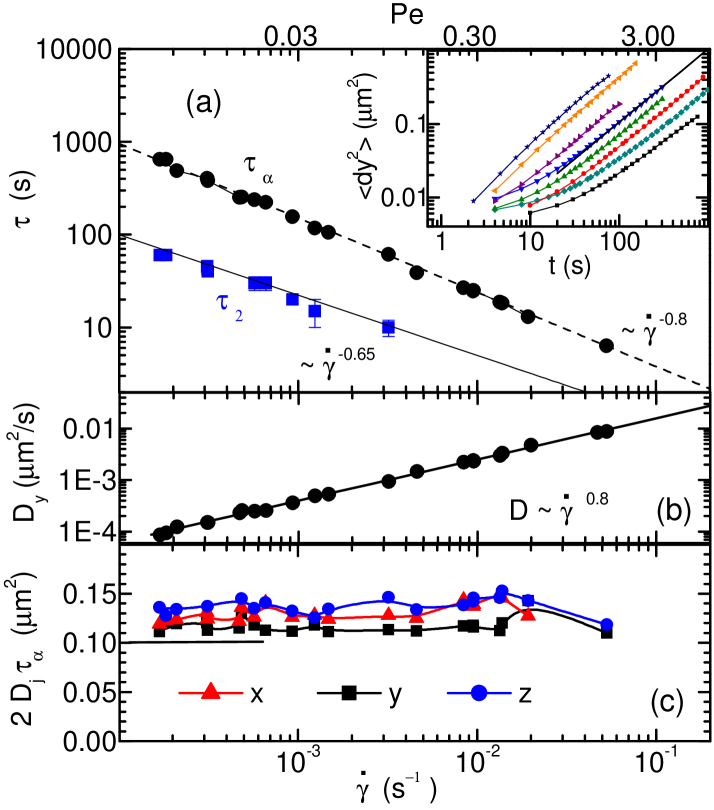
Turning to the mean squared displacement (MSD) , Fig. 3(a) inset, we see that it exhibits a crossover from caged to diffusive motion for ( m2), in reasonable agreement with the ‘Lindemann parameter’ measuring the cage rattling at the quiescent glass transition fn_expversusHS . The long time diffusion constant , Fig. 3(b), follows the relaxation rate , and not the shear rate . To show this more clearly and also address the anisotropy in the dynamics, we plot in Fig. 3(c) the product for the three directions () along with the value expected from a gaussian approximation MegenPRE98_tracersinglass . The value for agrees well with and this gaussian long time behavior also occurs in the other directions fn_tauj . We again stress the difference with quiescent fluids at , which always show for . Figure 3(c) also shows that the diffusion constants exhibit only a mild anisotropy: while , the difference is . Similar or even smaller anisotropy has been observed in simulations of sheared, glassy systems YamamotoOnukiPRE98PRL98 ; Miyazaki04 and colloidal fluids FossBradyJFM99_sheardiffusion . Isotropic shear-induced diffusion is also seen in dilute suspensions QiuChaikinPRL88_diffusioninshear . However, sheared non-Brownian suspensions () show a marked anisotropy () BreedveldJCP02_nonbrowndiffusion , with .
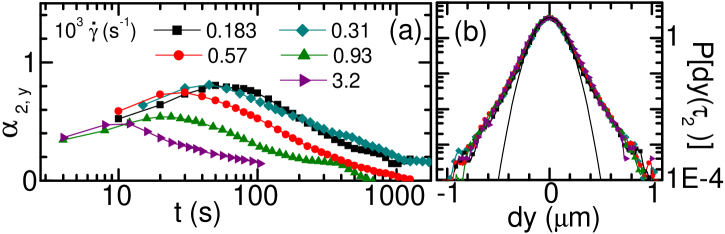
As a last characterization of the microscopic dynamics we study the probability distribution of the displacements and the non-gaussian parameter . The latter characterizes broad, non-gaussian, tails to , reflecting cage rearranging motions such as in Fig. 1(e). Figure 4(a) shows for various . It exhibits a peak for corresponding to the crossover from caged to diffusive behavior in the MSD (inset, Fig. 3(a)), and vanishes for . A non-zero also suggests cooperative motion, consistent with the heterogeneous trajectories for in Fig. 1 (b)-(d). The peak time follows , Fig. 3(a), somewhat different from the scaling. More interestingly, the distributions show a near collapse for different rates, (Fig. 4(b)), despite a slight decrease of with . In quiescent systems at , such (near) collapse of at different is not expected since there grows strongly with while the MSD at decreases rapidly Weeks_Kegel .
We now return to the dependence of . There is currently no firm theoretical basis for relating to flow properties. Nevertheless, is often taken (with some simulational evidence VarnikPRB06 ) as proportional to viscosity FuchsCatesPRL02_nonlinearheo , giving an effective stress with a modulus. The resulting ‘microscopic’ flow curve shows , Fig. 5. Recent theories SollichCatesPRL97_softglassyrheology ; FuchsCatesPRL02_nonlinearheo have argued for the existence of a dynamic yield stress at in uniform shear. However, our results show no sign of a plateau in for reduced rates down to .
Figure 5 shows the experimental global flow curve measured with a stress controlled rheometer (AR2000, TA Instruments) in cone-plate geometry (diameter mm, angle , both surfaces coated with particles). The stress is related to the average shear rate by with a dynamic yield stress Pa and , similar to previous HS measurements PetekidisPuseyJPhCondMat04_shear .
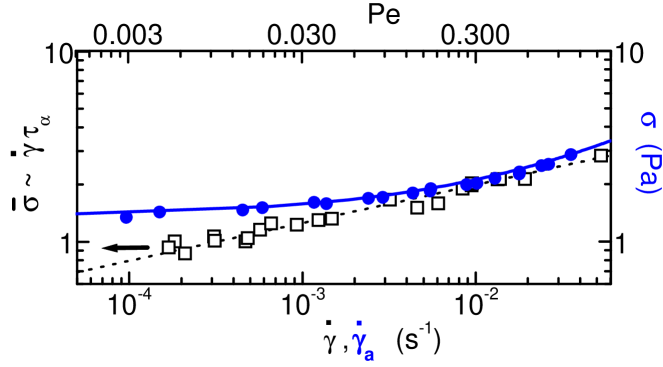
To compare with the microscopic behavior , in Fig.5 we have chosen to optimize agreement between and at high . Clearly, the microscopic and macroscopic data disagree. Some discrepancy may be due to the fact that, for , hydrodynamic effects render the relation less valid. More importantly, discrepancy could arise from the presence of shear localization, e.g. due to the existence of a static yield stress Berthier ; VarnikBarratPRL03_LJshearlocali . We have already mentioned that in our parallel-plate shear cell, a global shear rate typically corresponds to a jammed region () coexisting with a flowing region with . Preliminary flow imaging inside our rheometer shows that shear localization also occurs in the cone-plate geometry, and sets in for s-1 fn_microvsmacro . In LJ simulations VarnikBarratPRL03_LJshearlocali , differences between and could indeed explain small deviations between local and global rheology. But the rather larger deviations in Fig. 5 cannot be explained by this argument. Possibly, the relation is an oversimplification footnote and instead we may need to invoke analogies with ‘force chain’ dominated systems to make progress. Indeed, our global shear profile , which exhibits a smooth rather than a step-like decay of to zero (data not shown), has similarities with velocity profiles in granular matter Granular .
Concluding, we have studied the 3D particle dynamics in a HS colloidal glass under steady shear by fast confocal imaging. Shear occurs in ‘fluidized’ bands where colloids show nearly isotropic ‘cage breaking’ and exponential relaxation, in contrast to the stretched-exponential dynamics in dense colloidal fluids. The relaxation rate scales as a power of the local shear rate: . The ‘naïve’ microscopic flow curve deduced from this result differs from the global, Herschel-Bulkley, rheology. These and other recent results confocal show the potential of fast 3D imaging to address fundamental questions in non-equilibrium physics.
We thank M. E. Cates, M. Fuchs, L. Isa, A. Morozov, P.N. Pusey, K.S. Schweizer and F. Varnik for discussions, M. Jenkins for providing his coordinate refinement routine, and EPSRC GR/S10377 and EP/D067650 (UK) and NSF DMR-0603055 (US) for funding.
References
- (1) M.D. Ediger et al., J. Phys. Chem. 100, 13200 (1996).
- (2) M. Heggen et al., J. Appl. Phys. 97, 033506 (2005); H. Kato et al., Appl. Phys. Lett. 73, 3665 (1998).
- (3) R.G. Larson, The Structure and Rheology of Complex Fluids (Oxford University Press, New York, 1999).
- (4) P. Sollich et al., Phys. Rev. Lett. 78, 2020 (1997).
- (5) L. Berthier, J. Phys. Cond. Mat. 15, S933 (2003).
- (6) M. Fuchs and M.E. Cates, Phys. Rev. Lett. 89, 248304 (2002); Far. Disc. 123, 267 (2003).
- (7) M.L. Falk and J.S. Langer, Phys. Rev. E 57, 7192 (1998).
- (8) R. Yamamoto and A. Onuki, Phys. Rev. E 58, 3515 (1998); Phys. Rev. Lett. 81, 4915 (1998).
- (9) L. Berthier and J.L. Barrat, J. Chem. Phys. 116, 6228 (2002).
- (10) K. Miyazaki et al., Phys. Rev. E 70, 011501 (2004).
- (11) G. Petekidis et al., Phys. Rev. E 66, 051402 (2002).
- (12) P. Hebraud et al., Phys. Rev. Lett. 78, 4657 (1997).
- (13) J. Lauridsen et al., Phys. Rev. Lett. 93, 018303 (2004). P. Varadan and M.J. Solomon, J. Rheol. 47, 943 (2003); D. Derks et al., J. Phys. Cond. Mat. 16, 3917 (2004); I. Cohen et al., Phys. Rev. Lett. 93, 046001 (2004).
- (14) D. Bonn et al., Phys. Rev. Lett. 89, 015701 (2002).
- (15) P. Coussot et al., Phys. Rev. Lett. 88 218301 (2002); L. Becu et al., Phys. Rev. lett. 96, 138302 (2006).
- (16) F. Varnik et al., Phys. Rev. Lett. 90, 095702 (2003).
- (17) Deduced from slow quiescent crystallization kinetics.
- (18) A. Yethiraj, A. van Blaaderen, Nature 421, 513 (2003).
- (19) ; for pure HSs MegenPRE98_tracersinglass .
- (20) J.C. Crocker and D.G. Grier, J. Col. Int. Sc. 179, 298 (1996); M. Jenkins (private communication). At our frame rate, shear-induced distortions in the plane are unimportant for s-1.
- (21) P.R. ten Wolde et al., J. Chem. Phys 104, 9932 (1996); The average number of crystalline bonds per particle was and constant in time, with only small (fluctuating) clusters of crystalline particles (with ).
- (22) B.J. Ackerson and P.N. Pusey, Phys. Rev. Lett. 61, 1033 (1988); M.D. Haw et al., Phys. Rev. E 57, 6859 (1998). We observed (partial) crystallization for s-1.
- (23) E.R. Weeks et al., Science 287, 627 (2000); W.K. Kegel and A. van Blaaderen, Science 287, 290 (2000).
- (24) R.E. Courtland and E.R. Weeks, J. Phys. Cond. Mat. 15 S359 (2003).
- (25) W. van Megen et al., Phys. Rev. E 58, 6073 (1998).
- (26) Remarkably, Fig. 3(a) includes two points at lower , s and s.
- (27) H. Horner, Z. Phys. B 100, 243 (1996).
- (28) V. Kobelev and K.S. Schweizer, Phys. Rev E. 71, 021401 (2005); data re-plotted from their Figs. and .
- (29) F. Varnik, O. Henrich, Phys. Rev. B. 73, 174209 (2006).
- (30) Taking evaluated from , yields independent of .
- (31) D.R. Foss and J.F. Brady, J. Fl. Mech. 401, 243 (1999).
- (32) X. Qiu et al., Phys. Rev. Lett. 61, 2554 (1988).
- (33) V. Breedveld et al., J. Chem Phys. 116, 10529 (2002).
- (34) G. Petekidis et al., J. Phys. Cond. Mat. 16, S3955 (2004).
- (35) Thus the correspondence between our bulk rheology and the predictions in SollichCatesPRL97_softglassyrheology ; FuchsCatesPRL02_nonlinearheo for uniform shear is puzzling.
- (36) An explanation of the difference between and in terms of along with (the average volume fraction) in the sheared region faces the difficulty that in the jammed regions we would have . Further, shear-induced size segregation is unlikely due to the small measured values of shear induced migration.
- (37) W. Losert et al., Phys. Rev. Lett. 85, 1428 (2000); E. Aharonov, D. Sparks, Phys. Rev. E 65, 051302 (2002).
- (38) L. Isa et al., Phys. Rev. Lett. 98, 198305 (2007); I. Cohen et al., Phys. Rev Lett. 97, 215502 (2006).