Additional information for the paper ‘Attempt to distinguish long range temporal correlations from the statistics of the increments by natural time analysis’ after its initial submission on February 25, 2006. Part II, Updated
Abstract
As mentioned in the preceding additional information (hereafter called Part I), a series of strong earthquakes with magnitudes between 5.2 and 5.9-units occurred during the two weeks period: 3 to 19 April, 2006 with epicenters lying at distances 80 to 100 km west of PAT station. Here, we show that the analysis in the natural time of the seismicity that occurred after the Seismic Electric Signals (SES) activity on February 13, 2006, specifies the occurrence time of the initiation of the aforementioned earthquake activity within a narrow range around two days. Furthermore, we provide the most recent information on some points mentioned in the main text.
pacs:
05.40.-a, 91.30.Dk, 05.45.Tp, 89.75.-kAccording to the Athens observatory (the data of which will be used here), a series of strong earthquakes (EQs) with magnitudes ranging from 5.2 to 5.9-units occurred during the period: 3 to 19 April, 2006 , see Table I of Part IEPA (a). All their epicenters lie at distances of around 80 to 100km west of PAT station on the dipoles of which the SES activities depicted in Figs. 1(a) and 2(a) of the main text were recorded.
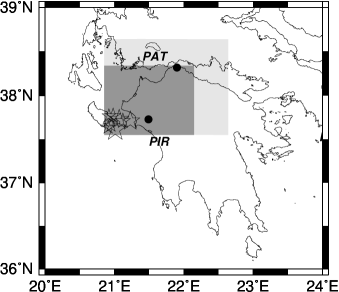
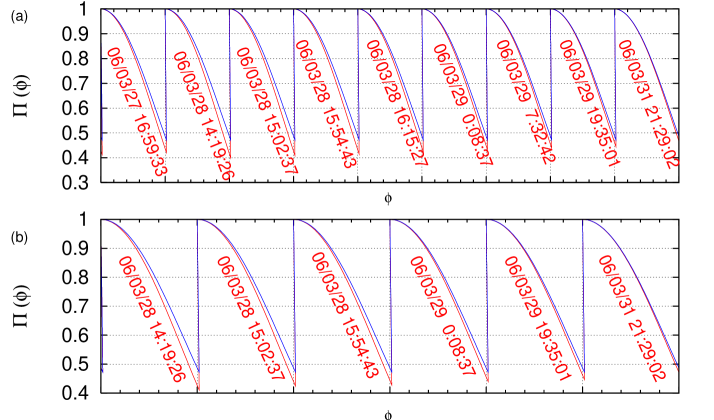
We show that the occurrence time of the impending strong EQ activity can be estimated by following the procedure described in Refs.Varotsos et al. (2001, 2005). (We clarify that, during the last decade, preseismic information based on SES activities is published only when the magnitude of the strongest EQ of the impending EQ activity is estimated to be -by means of the SES amplitudeEPA (b)- comparable to 6.0 units or largerVarotsos (2005).) We study how the seismicity evolved after the recording of the SES activity on February 13, 2006 (cf. This is the intense signals’ activity that was classified as SES activity in the initially submitted version of the present paper on February 25, 2006), by considering either the area A: or the area B:, which surround not only the EQ epicenters and the PAT station (see Fig.1) but also the PIR station at which a precursory GVEF started during the last week of February, 2006EPA (a). If we set the natural time for seismicity zero at the initiation of the SES activity on February 13, 2006, we form time series of seismic events in natural time for various time windows as the number of consecutive (small) EQs increases. We then compute the normalized power spectrum Varotsos et al. (2001, 2005) in natural time for each of the time windows. Excerpts of these results, which refer to the values deduced during the period 27 March to 1 April,2006, are depicted in red in Fig.2. In this figure, Fig.2(a) corresponds to the area A with magnitude threshold (herafter referring to the local magnitude ML or the ‘duration’ magnitude MD) , while Fig.2(b) to the area B with . In the same figure, we plot in blue the power spectrum obeying the relationVarotsos et al. (2001); Varotsos et al. (2002a, b)
| (1) |
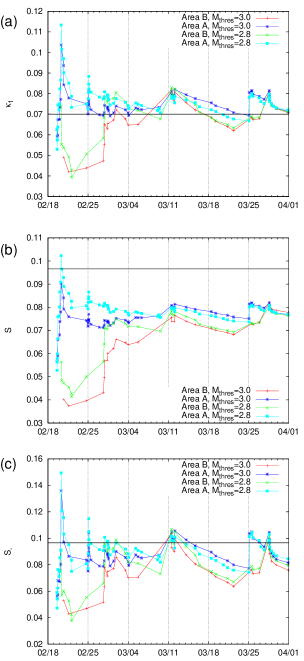
which holds when the system enters the critical stage (, where stands for the natural frequencyVarotsos et al. (2001); Varotsos et al. (2002a, b); Varotsos (2005)). The date and the time of the occurrence of each small earthquake (with magnitude exceeding (or equal to) the aforementioned threshold) that occurred in each of the areas A and B, is also written in red in each panel (see also Table 1). An inspection of Fig.2 reveals that the red line approaches the blue line as increases and a coincidence occurs at the last small event which had a magnitude 3.0 and occurred at 21:29 UT on March 31, 2006, i.e., roughly two days before the first strong EQ (00:50 UT on April 3,2006). To ensure that this coincidence is a true oneVarotsos et al. (2001, 2005); Varotsos et al. (2002b); Varotsos (2005) (see also below) we also calculate the evolution of the quantities , and and the results are depicted in Fig.3 for both magnitude thresholds 2.8 and 3.0 for each of the areas A and B.
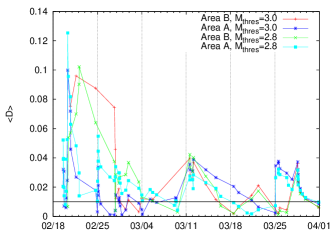
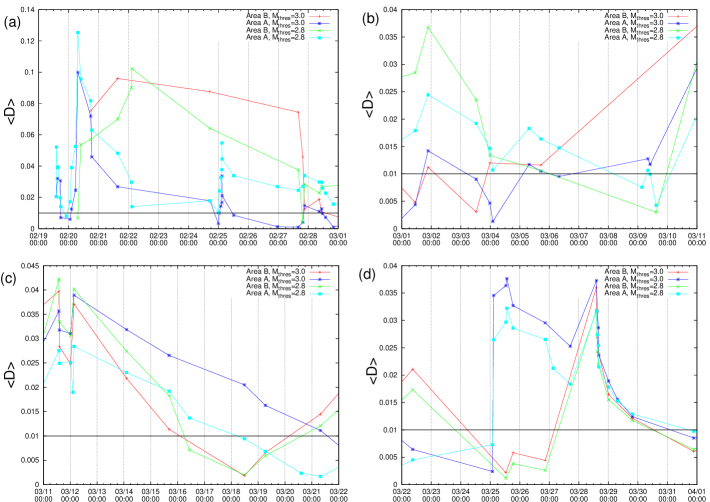
The conditions for a coincidence to be considered as true are the following (e.g., see Ref.Varotsos et al. (2001), see also Varotsos et al. (2005); Varotsos et al. (2002b); Varotsos (2005)): First, the ‘average’ distance between the empirical and the theoretical (i.e., the red and the blue line, respectively, in Fig.2) should beVarotsos et al. (2001, 2005); Varotsos et al. (2002a); Varotsos (2005) smaller than . See Fig.4 where we plot versus the conventional time for the aforementioned two areas and the two magnitude thresholds (hence four combinations were studied in total). In order to better visualize the details of this figure, its four consecutive segments are enlarged and separately depicted in Fig.5(a) to (d). Second, in the examples observed to dateVarotsos et al. (2001, 2005); Varotsos et al. (2002b); Varotsos (2005); EPA (b), a few events before the coincidence leading to the strong EQ, the evolving has been found to approach that of Eq.(1), i.e., the blue one in Fig.2 , from below (cf. this reflects that during this approach the -value decreases as the number of events increases). In addition, both values and should be smaller than at the coincidence. Finally, since the process concerned is self-similar (critical dynamics), the time of the occurrence of the (true) coincidence should not change, in principle, upon changing either the (surrounding) area or the magnitude threshold used in the calculation. Note that in Fig.4 or Fig.5(d), upon the occurrence of the aforementioned last small event of March 31, 2006, in both areas A and B and both magnitude thresholds(i.e., 2.8 and 3.0) their values become smaller than . Hence, this coincidence can be considered as true, while other coincidences that occurred earlier (i.e., before March 31, 2006) have been found not to be true ones since they violate one or more of the aforementioned conditions(cf. typical examples of coincidences that are not true can be also found in Ref.EPA (b)).
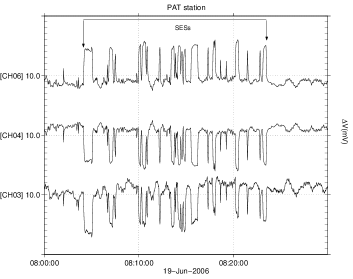
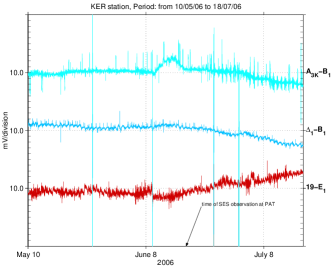
The aforementioned strong earthquakes, the epicenters of which are shown in Fig.1, lasted from 3 to 19 April, 2006. They were preceded by the SES activity of February 13, 2006, as well as (some of them by) the one recorded on April 13, 2006 that were presented in the main text. We now comment on what happened after this seismic activity. First, two additional SES activities have been recorded at PAT on April 19 and 21, 2006, see Figs. 2(b) and (c) of Part IEPA (a). They have been followed by two EQs that occurred at seismic areas different than the previously active one (as expectedEPA (a)): (a) At 06:16 UT on May 5, 2006, an EQ with magnitude 4.8 and an epicenter at , i.e., almost 60 km E of PAT station and (b) at 23:14 UT of May 25, 2006, an EQ with magnitude 5.3 with an epicenter at , i.e., almost 100 km SW of PIR station. Second, an intense signal (see Fig.6) has been recently recorded at PAT on June 19, 2006, which is similar to the one depicted in Fig.1(a) of the main text. It has been also classified as SES activity by following a procedure similar to that explained in the main text. The analysis of the evolving seismicity subsequent to the latter SES activity, in order to specify the occurrence time of the impending strong earthquake (with an epicenter possibly lying within the area A,but see also the next paragraph) -in a fashion similar to that explained here- is in progress. Third, the following phenomenon was noticed at the station KER (i.e., Keratea station located close to Athens) after the submission of the revised version of the present paper on June 30,2006. Figure 7 depicts the data of three, for example, electric dipoles during the period from 10 May to 18 July, 2006. A gradual deviation from the background level presumably develops during the last few weeks, which suggests the evolution of a precursory GVEF (cf. in order for this variation to be finally classified as GVEF, however, the channels should return at their previous levels, a fact which is still unknown). Recall that, as already mentioned in Part I, such a phenomenon is observed only for EQs with magnitude larger than 5.5 when the (future) epicenter happens to lie at a small distance (some tens of km) from the measuring station. Is this GVEF at KER interconnected to the detection of the aforementioned SES activity at PAT on June 19, 2006? (The other alternative, of course, is that these two phenomena correspond to separate events.) To investigate such a possibility the analysis of the evolving seismicity subsequent to the latter SES activity -in order to specify the occurrence time of the impending strong EQ by means of the method explained above- is also currently carried out by considering an area extending from PAT to KER (besides the one within the area A). The distinction between the two alternatives will be achieved, in the course of time, upon checking which of the two current analyses will exhibit a scale invariant feature (similar to the one visualized in Figs.4 and 5(d)) when approaching the critical point.
Let us briefly summarize: First, the occurrence time of the initiation of the strong seismic activity, that lasted from 3 to 19 April, 2006 at an epicentral region 80 to 100 km west of PAT, can be specified within a narrow range around 2 days. This is so, because the power spectrum in natural time of the evolving seismicity after the SES activity of February 13, 2006, collapses on the one expected for critical dynamics at 21:29 UT on March 31, 2006, i.e., almost two days before the occurrence time of the 5.3 earthquake of April 3, 2006. Second, the two SES activities that were observed after the aforementioned strong seismic activity, have been also followed by two earthquakes on May 5 and 25, 2006, the epicenters of which lie clearly outside the previously active region, as expectedEPA (a). Third, the most recent electric data are presented.
| No | Year | Month | Day | UT | Lat.(oN) | Lon.(oE) | depth(km) | M |
|---|---|---|---|---|---|---|---|---|
| 1 | 2006 | 2 | 15 | 6:37:45 | 37.99 | 22.02 | 13.0 | 3.0 |
| 2 | 2006 | 2 | 18 | 17:23:15 | 38.37 | 21.97 | 32.0 | 3.1 |
| 3 | 2006 | 2 | 19 | 1:16:49 | 38.43 | 21.77 | 29.0 | 3.1 |
| 4 | 2006 | 2 | 19 | 13:32:10 | 38.41 | 21.98 | 5.0 | 3.2 |
| 5 | 2006 | 2 | 19 | 13:55:54 | 38.35 | 22.02 | 20.0 | 3.3 |
| 6 | 2006 | 2 | 19 | 14:08:27 | 38.22 | 21.77 | 34.0 | 3.0 |
| 7 | 2006 | 2 | 19 | 14:12:59 | 38.36 | 21.93 | 45.0 | 2.8 |
| 8 | 2006 | 2 | 19 | 14:56:39 | 38.33 | 22.03 | 32.0 | 3.0 |
| 9 | 2006 | 2 | 19 | 15:42:32 | 38.32 | 22.15 | 31.0 | 2.9 |
| 10 | 2006 | 2 | 19 | 17:19:22 | 38.29 | 22.25 | 31.0 | 3.0 |
| 11 | 2006 | 2 | 19 | 17:44:57 | 38.36 | 22.01 | 26.0 | 3.1 |
| 12 | 2006 | 2 | 19 | 22:09:41 | 38.38 | 21.98 | 24.0 | 2.9 |
| 13 | 2006 | 2 | 20 | 1:13:47 | 38.41 | 21.75 | 23.0 | 3.0 |
| 14 | 2006 | 2 | 20 | 2:16:47 | 38.34 | 22.03 | 17.0 | 3.1 |
| 15 | 2006 | 2 | 20 | 5:34:58 | 38.41 | 21.92 | 28.0 | 3.1 |
| 16 | 2006 | 2 | 20 | 7:21:60 | 37.85 | 21.15 | 14.0 | 3.6 |
| 17 | 2006 | 2 | 20 | 9:47:41 | 38.31 | 21.99 | 32.0 | 2.9 |
| 18 | 2006 | 2 | 20 | 17:45:14 | 38.33 | 21.97 | 18.0 | 3.3 |
| 19 | 2006 | 2 | 20 | 18:33:49 | 38.36 | 21.96 | 32.0 | 3.1 |
| 20 | 2006 | 2 | 21 | 15:15:48 | 38.23 | 21.59 | 39.0 | 3.1 |
| 21 | 2006 | 2 | 22 | 2:25:19 | 38.34 | 21.99 | 26.0 | 2.8 |
| 22 | 2006 | 2 | 22 | 2:46:46 | 38.34 | 22.00 | 22.0 | 2.8 |
| 23 | 2006 | 2 | 24 | 17:16:32 | 37.92 | 21.15 | 12.0 | 3.2 |
| 24 | 2006 | 2 | 25 | 0:01:08 | 38.57 | 21.65 | 13.0 | 3.0 |
| 25 | 2006 | 2 | 25 | 0:44:23 | 38.61 | 21.52 | 22.0 | 3.3 |
| 26 | 2006 | 2 | 25 | 1:55:25 | 38.54 | 21.79 | 15.0 | 3.3 |
| 27 | 2006 | 2 | 25 | 2:47:35 | 38.53 | 21.83 | 18.0 | 3.3 |
| 28 | 2006 | 2 | 25 | 2:54:01 | 38.53 | 21.82 | 20.0 | 3.5 |
| 29 | 2006 | 2 | 25 | 2:58:49 | 38.42 | 22.20 | 10.0 | 3.1 |
| 30 | 2006 | 2 | 25 | 12:18:39 | 38.52 | 22.16 | 4.0 | 3.0 |
| 31 | 2006 | 2 | 26 | 23:14:15 | 38.40 | 22.01 | 4.0 | 3.1 |
| 32 | 2006 | 2 | 27 | 15:58:47 | 37.99 | 21.94 | 27.0 | 3.2 |
| 33 | 2006 | 2 | 27 | 19:41:00 | 37.98 | 21.99 | 22.0 | 3.3 |
| 34 | 2006 | 2 | 27 | 21:00:59 | 38.05 | 21.93 | 28.0 | 3.4 |
| 35 | 2006 | 2 | 28 | 8:48:46 | 38.01 | 22.08 | 20.0 | 3.2 |
| 36 | 2006 | 2 | 28 | 10:46:37 | 38.01 | 21.99 | 18.0 | 3.3 |
| 37 | 2006 | 2 | 28 | 11:27:33 | 38.00 | 22.28 | 39.0 | 3.2 |
| 38 | 2006 | 2 | 28 | 13:52:53 | 38.43 | 21.15 | 38.0 | 3.2 |
| 39 | 2006 | 2 | 28 | 20:13:51 | 38.00 | 22.22 | 35.0 | 3.0 |
| 40 | 2006 | 3 | 1 | 11:00:48 | 37.98 | 21.99 | 18.0 | 3.3 |
| 41 | 2006 | 3 | 1 | 21:27:40 | 38.02 | 22.02 | 7.0 | 3.4 |
| 42 | 2006 | 3 | 3 | 12:34:51 | 37.79 | 21.15 | 26.0 | 3.1 |
| 43 | 2006 | 3 | 3 | 23:41:13 | 37.94 | 21.89 | 56.0 | 3.1 |
| 44 | 2006 | 3 | 4 | 2:06:53 | 38.44 | 21.80 | 27.0 | 3.1 |
| 45 | 2006 | 3 | 5 | 7:35:24 | 38.40 | 21.99 | 17.0 | 3.4 |
| 46 | 2006 | 3 | 5 | 17:10:43 | 38.34 | 22.02 | 27.0 | 3.2 |
| 47 | 2006 | 3 | 6 | 7:57:06 | 38.41 | 21.96 | 31.0 | 3.2 |
| 48 | 2006 | 3 | 9 | 3:16:08 | 38.62 | 22.38 | 21.0 | 2.8 |
| 49 | 2006 | 3 | 9 | 8:10:05 | 37.58 | 22.59 | 68.0 | 3.3 |
| 50 | 2006 | 3 | 9 | 9:56:47 | 38.54 | 21.14 | 35.0 | 3.2 |
| 51 | 2006 | 3 | 9 | 14:51:03 | 38.20 | 21.96 | 21.0 | 2.9 |
| 52 | 2006 | 3 | 11 | 13:51:31 | 37.86 | 21.01 | 5.0 | 3.6 |
| 53 | 2006 | 3 | 11 | 14:15:15 | 37.86 | 21.01 | 32.0 | 3.2 |
| 54 | 2006 | 3 | 12 | 0:17:22 | 37.80 | 20.98 | 5.0 | 3.3 |
| 55 | 2006 | 3 | 12 | 2:26:50 | 38.13 | 22.63 | 13.0 | 2.9 |
| No | Year | Month | Day | UT | Lat.(oN) | Lon.(oE) | depth(km) | M |
|---|---|---|---|---|---|---|---|---|
| 56 | 2006 | 3 | 12 | 3:22:22 | 37.88 | 20.99 | 27.0 | 3.5 |
| 57 | 2006 | 3 | 14 | 2:20:00 | 38.33 | 21.89 | 30.0 | 3.0 |
| 58 | 2006 | 3 | 15 | 16:22:00 | 38.33 | 22.05 | 35.0 | 3.1 |
| 59 | 2006 | 3 | 16 | 10:34:05 | 38.26 | 22.10 | 35.0 | 2.9 |
| 60 | 2006 | 3 | 18 | 11:40:57 | 38.26 | 21.50 | 34.0 | 3.0 |
| 61 | 2006 | 3 | 19 | 6:26:46 | 37.73 | 21.21 | 12.0 | 3.1 |
| 62 | 2006 | 3 | 20 | 14:30:39 | 38.56 | 21.51 | 22.0 | 2.9 |
| 63 | 2006 | 3 | 21 | 7:43:18 | 38.12 | 21.85 | 13.0 | 3.0 |
| 64 | 2006 | 3 | 22 | 8:57:56 | 37.64 | 21.51 | 31.0 | 3.0 |
| 65 | 2006 | 3 | 25 | 1:49:37 | 38.09 | 22.64 | 13.0 | 3.0 |
| 66 | 2006 | 3 | 25 | 2:46:38 | 38.64 | 21.80 | 23.0 | 3.7 |
| 67 | 2006 | 3 | 25 | 12:42:23 | 38.34 | 21.97 | 24.0 | 3.4 |
| 68 | 2006 | 3 | 25 | 13:29:59 | 38.61 | 21.81 | 23.0 | 3.4 |
| 69 | 2006 | 3 | 25 | 18:34:12 | 37.83 | 21.18 | 15.0 | 3.1 |
| 70 | 2006 | 3 | 26 | 20:43:11 | 37.87 | 21.06 | 25.0 | 3.2 |
| 71 | 2006 | 3 | 27 | 3:06:55 | 38.45 | 21.88 | 28.0 | 2.8 |
| 72 | 2006 | 3 | 27 | 16:59:33 | 38.63 | 21.55 | 5.0 | 3.1 |
| 73 | 2006 | 3 | 28 | 14:19:26 | 37.63 | 21.42 | 25.0 | 3.6 |
| 74 | 2006 | 3 | 28 | 15:02:37 | 37.88 | 21.08 | 10.0 | 3.0 |
| 75 | 2006 | 3 | 28 | 15:54:43 | 38.32 | 21.99 | 14.0 | 3.2 |
| 76 | 2006 | 3 | 28 | 16:15:27 | 38.36 | 21.93 | 28.0 | 3.0 |
| 77 | 2006 | 3 | 29 | 0:08:37 | 38.33 | 22.00 | 9.0 | 3.0 |
| 78 | 2006 | 3 | 29 | 7:32:42 | 38.37 | 22.00 | 27.0 | 3.1 |
| 79 | 2006 | 3 | 29 | 19:35:01 | 38.32 | 21.98 | 29.0 | 3.1 |
| 80 | 2006 | 3 | 31 | 21:29:02 | 38.31 | 22.12 | 29.0 | 3.0 |
| 81 | 2006 | 4 | 2 | 16:53:23 | 38.32 | 22.09 | 37.0 | 3.3 |
| 82 | 2006 | 4 | 2 | 21:29:50 | 38.61 | 21.87 | 38.0 | 3.0 |
| 83 | 2006 | 4 | 3 | 0:49:42 | 37.59 | 20.95 | 20.0 | 4.8 |
References
- EPA (a) eprint See the document Suplinfo.pdf deposited in the same, as this file, EPAPS directory on April 25, 2006. This document may be retrieved via the EPAPS homepage (http://www.aip.org/pubservs/epaps.html) or from ftp.aip.org in the directory /epaps/. See the EPAPS homepage for more information.
- Varotsos et al. (2001) P. A. Varotsos, N. V. Sarlis, and E. S. Skordas, Practica of Athens Academy 76, 294 (2001).
- Varotsos et al. (2005) P. Varotsos, N. Sarlis, H. Tanaka, and E. Skordas, Phys. Rev. E 72, 041103 (2005).
- EPA (b) eprint See EPAPS Document No. E-PLEEE8-73-134603 for additional information. This document may be retrieved via the EPAPS homepage (http://www.aip.org/pubservs/epaps.html) or from ftp.aip.org in the directory /epaps/. See the EPAPS homepage for more information.
- Varotsos (2005) P. Varotsos, The Physics of Seismic Electric Signals (TERRAPUB, Tokyo, 2005).
- Varotsos et al. (2002a) P. A. Varotsos, N. V. Sarlis, and E. S. Skordas, Phys. Rev. E 66, 011902 (2002a).
- Varotsos et al. (2002b) P. Varotsos, N. Sarlis, and E. Skordas, Acta Geophys. Pol. 50, 337 (2002b).