Multiple Energy Scales at a Quantum Critical Point
Abstract
We report thermodynamic measurements in a magnetic-field-driven quantum critical point of a heavy fermion metal, YbRh2Si2. The data provide evidence for an energy scale in the equilibrium excitation spectrum, that is in addition to the one expected from the slow fluctuations of the order parameter. Both energy scales approach zero as the quantum critical point is reached, thereby providing evidence for a new class of quantum criticality.
Quantum criticality encodes the strong fluctuations of matter undergoing a second order phase transition at zero temperature. It underlies the unusual properties observed in a host of quantum materials. A basic question that remains unsettled concerns its proper theoretical description, which is challenging because the fluctuations are both collective and quantum mechanical. One class of theory, based on the traditional formulation of classical critical phenomena [1], considers the fluctuations of a classical variable – Laudau’s order parameter – in both spatial and temporal dimensions [2, 3, 4, 5]. The slowing down of the order-parameter fluctuations accompanies the divergence of a spatial correlation length; at each value of the tuning parameter, the equilibrium many-body spectrum contains a single excitation energy scale, which vanishes at the quantum critical point (QCP) [6]. An unconventional class of theory [7, 8, 9], by contrast, is inherently quantum mechanical; it explicitly invokes quantum entanglement effects, which are manifested through vanishing energy scale(s) that are in addition to the one associated with the slowing down of order-parameter fluctuations. The nature of quantum criticality can therefore be experimentally elucidated by determining whether a single or multiple energy scale(s) vanish as the QCP is reached.
We consider the heavy-fermion metal YbRh2Si2 (YRS), and show that multiple energy scales vanish as its QCP is approached and, in addition, suggest that critical electronic modes co-exist with the slow fluctuations of the magnetic order parameter. A direct way to probe the intrinsic energy scales in the equilibrium spectrum near a QCP is to measure thermodynamic properties. Another approach is to measure the fluctuation spectrum in equilibrium, for example by inelastic neutron scattering experiments. Such equilibrium methods are in contrast to transport experiments, which are influenced by electronic relaxational properties, especially for anisotropic and multi-band systems.
As extraction of critical energy scales requires measurements through fine steps of the control parameter, which is nearly impossible for inelastic neutron scattering, we report here measurements of thermodynamic properties of YRS across its magnetic QCP.
We choose to work with the tetragonal heavy fermion compound YRS as it presents a clean and stoichiometric material that is well characterized [10]. In the absence of an external magnetic field, YRS shows very weak antiferromagnetic (AF) order at mK with an ordered moment of only /Yb [11]. A small magnetic field ( T, for the field applied within the easy plane, and T, along the hard axis) suppresses the transition temperature and accesses the QCP [12]. The ability of using such a small magnetic field to access the QCP makes YRS suited for our purpose; the determination of energy scales requires scanning across the phase transition, and an external magnetic field can be tuned with relative ease and continuously. Hall effect measurements [13] on YRS have shown a large and rapid crossover in the Hall constant at a temperature-dependent magnetic field away from the antiferromagnetic transition. In the zero-temperature limit, this crossover extrapolates to a jump across the QCP, which has been interpreted as a large change of the Fermi surface volume. This represents yet another advantage of measuring the thermodynamic properties in YRS, as they can be compared with their transport counterparts.
We measured the isothermal linear magnetostriction , where is the length along the direction within the tetragonal plane and the magnetic field is applied along the same direction (). Fig. 1 shows the magnetostriction as a function of the magnetic field, at temperatures ranging from 0.02 K to 0.8 K. For temperatures below 0.075 K, a clear discontinuity is observed when suppressing the AF order by a critical magnetic field. At K, it is seen that, for small magnetic field, the isothermal magnetostriction linearly depends on the magnetic field, as is the case in typical metals [14]. Beyond a crossover field, however, there is a change to a high field region with a different slope. The crossover field decreases as the temperature is reduced.
To understand this crossover, we compare it with the field-dependent isothermal behavior of other thermodynamic and transport quantities. Fig 2A illustrates the similarity of the crossover in the magnetostriction with that seen in the field-dependent isothermal Hall resistivity (measured with ). The Hall coefficient was described [13] by an empirical crossover function of the form ; the crossover field scale is equivalent to an energy scale . We have analyzed the magnetostriction data, as well as the existing magnetization data () [15, 16], with the same crossover function. Note that no corresponding anomalies can be resolved in the magnetization data for [16], which is almost linear in . The solid curves in Fig. 1 and Fig. 2A correspond to fits of , and the Hall resistivity . Fig. 2B shows the three sets of , obtained from such fits. Their overlap represents a key conclusion of the present work; it suggests that they define one energy scale . This scale is seen to be distinct from either the transition temperature () for the magnetic ordering at or the scale () for the establishment of the Landau Fermi liquid state at . For all three quantities, the width of the crossover extrapolates to zero at , implying that the differentials of the magnetostriction, magnetization, and Hall resistivity have a jump in the zero-temperature limit (supporting online text).
The results raise the important question of the causal relationship between the thermodynamic and electronic transport properties. One might argue [17] that the Hall-effect evolution as a function of the magnetic field [13] is caused by the Zeeman splitting of the Fermi surface induced by the magnetization (and reflected in the magnetostriction). However, the magnetization only displays a smeared kink, and the corresponding Fermi surface change would at most produce a smeared kink in the Hall coefficient evolution; such a kink is too weak compared to the smeared jump seen experimentally. Moreover, along the axis, even such a smeared kink feature is absent in the magnetization vs the magnetic field. Instead, it is more natural to attribute the nonanalyticities in both the magnetostriction and magnetization as thermodynamic manifestations of the large Fermi surface jump caused by electron localization.
To explore this issue further, we have also studied the longitudinal magnetoresistivity. Fig. 3 shows the electrical resistivity, , as a function of the magnetic field (), at various temperatures. The broadened step-like decrease, observed at all temperatures, corresponds to the crossover observed in the other properties. Indeed, as shown in Inset A, the crossover fields determined from the minima of the derivative (cf. Inset B) fall on the same line determined from the magnetostriction, magnetization, and Hall effect. In addition, Inset B shows that the width of the crossover decreases as temperature is lowered. A detailed analysis shows that the crossover width goes to zero in the zero-temperature limit (supporting online text), implying a jump in the residual resistivity across the magnetic QCP. This is in accordance with the theoretical expectations [18, 19] associated with an -electron localization transition.
Fig. 3, Inset A, also shows the temperature scale as a function of field, extracted from the peak in the -dependence of the differential susceptibility ; the latter, observed earlier[20], necessarily accompanies the smeared kink behavior in the isothermal vs . It is clearly seen that this scale too falls on the same line.
Our results shed light on the overall phase diagram of this clean stoichiometric quantum critical material. NMR measurements [21], while signaling the dominance of AF fluctuations in the quantum critical regime, have also revealed enhanced ferromagnetic fluctuations: the Korringa ratio, , is small – of the order of , where is the corresponding ratio for non-interacting electrons. Further evidence for enhanced ferromagnetic fluctuations has come from magnetization measurements [20]: the Wilson ratio, , with /Yb [22], is strongly enhanced for an extended region of the phase diagram; it is already large () for magnetic fields of a few Teslas, and further increases as the field is reduced towards . Therefore, it could be tempting to consider the magnetic fluctuation as the dominant critical fluctuation [17], especially since a conventional ferromagnetic QCP would yield a Grüneisen exponent [23] of , close to what is observed in YRS [24]. This picture is problematic for a number of reasons, however. First, neither 3D nor 2D ferromagnetic spin fluctuations can generate the fractional exponent observed in the temperature dependence of the uniform spin susceptibility [20]. Second, ferromagnetic spin fluctuations would lead to a divergent (, with for 3D and 2D cases, respectively), that is in contrast to the observation of when the NMR measurement field is extrapolated to the quantum critical regime [11]. Third, as ferromagnetic spin fluctuations are inefficient in affecting charge transport, this picture contradicts the observation of a nearly independent ratio that accompanies a strongly dependent and [20]. Here, is the coefficient of the component of the resistivity.
The data presented here show that the uniform (, ) magnetization depends on the same underlying physics as that for the charge transport. Since the transport is dominated by large fluctuations, the results imply that the magnetic fluctuations are a part of overall fluctuations in an extended range of wavevector scales. It is then more natural to assume that the dynamical spin susceptibility at different wavevectors obeys the same form [25, 8] as observed in another prototypical quantum critical heavy fermion metal, CeCu5.9Au0.1 [17]: . At the QCP, the Weiss field at the antiferromagnetic wavevector () vanishes: . At the same time, and unlike for CeCu5.9Au0.1, is very small in YRS. Based on the saturation scale seen in the temperature dependence of the uniform magnetic susceptibility [20] and the NMR Knight shift data [21] near , we estimate to be of order 0.3 K [26]. When moves away from either or , increases to the order of the RKKY interaction or bare Kondo scale (about 25 K for YRS [10]). This is illustrated in Fig. 4. The enhanced uniform magnetic susceptibility, the concomitant enhanced Wilson ratio [20], as well as the small , naturally follow from this picture. Moreover, both and scale similarly with and the observation that is nearly -independent is in fact a manifestation of an -independent . All these lead to the conclusion that the origin of the line lies in an electronic slowing down and, for YRS, the strong fluctuations happen to be a consequence of the latter as well.
We now turn to more detailed theoretical implications of our results. Our measurements establish that the energy scale is associated with the equilibrium many-body spectrum (which alone determines thermodynamics). Moreover, this scale is distinct from the Landau Fermi liquid scale, , as physical quantities manifest rather different behavior across the two scales (supporting online text). Finally, both of these scales vanish at the QCP. These findings contradict the conventional order-parameter fluctuation theory in at least two respects. First, the only low-energy scale in that theory is associated with the magnetic slowing down which, for , is [2, 3, 4, 5]. Second, within that theory, a sharp feature in thermodynamics and transport quantities might arise near only.
Our results are instead consistent with magnetic quantum criticality accompanied by the destruction of Kondo entanglement. In the form of local quantum criticality [7, 8], a collapse of a large Fermi surface as decreases leads to an added energy scale characterizing an electronic slowing down and, in addition, yields a zero-temperature jump in the Hall coefficient and in the field-differentials of the thermodynamic quantities. An additional energy scale also exists in the “deconfined” quantum criticality scenario for insulating quantum magnets [9], as well as in its extension to itinerant electron systems [27, 28] that are argued to be relevant to quantum critical heavy fermion metals.
References and Notes
- [1] K.G. Wilson, Rev. Mod. Phys. 55, 583 (1983).
- [2] J.A. Hertz, Phys. Rev. B 14, 1165 (1976).
- [3] A.J. Millis, Phys. Rev. B 48, 7183 (1993).
- [4] T. Moriya and T. Takimoto, J. Phys. Soc. Jpn. 64, 960 (1995).
- [5] N.D. Mathur et al., Nature 394, 39 (1998).
- [6] S. Sachdev, Quantum Phase Transitions (Cambridge Univ. Press, Cambridge, 1999).
- [7] P. Coleman, C. Pépin, Q. Si, R. Ramazashvili, J. Phys. Cond. Matt. 13, R723 (2001).
- [8] Q. Si, S. Rabello, K. Ingersent, J.L. Smith, Nature 413, 804 (2001).
- [9] T. Senthil, A. Vishwanath, L. Balents, S. Sachdev, M.P.A. Fisher, Science 303, 1490 (2004).
- [10] O. Trovarelli et al., Phys. Rev. Lett. 85, 626 (2000).
- [11] K. Ishida et al., Phys. Rev. B 68, 184401 (2003).
- [12] P. Gegenwart et al., Phys. Rev. Lett. 89, 056402 (2002).
- [13] S. Paschen et al., Nature 432, 881 (2004).
- [14] B. S. Chandrasekhar and E. Fawcett, Adv. Phys. 20, 775 (1971).
- [15] Y. Tokiwa et al., Phys. Rev. Lett. 94, 226402 (2005).
- [16] P. Gegenwart, Y. Tokiwa, J. Custers, C. Geibel, F. Steglich, J. Phys. Soc. Jpn. 75, Suppl. 155 (2006).
- [17] H. v. Löhneysen, A. Rosch, M. Vojta, P. Wölfle, cond-mat/0606317.
- [18] P. Coleman, J.B. Marston, A.J. Schofield, Phys. Rev. B 72, 245111 (2005).
- [19] Q. Si, S. Rabello, K. Ingersent, J.L. Smith, Phys. Rev. B 68, 115103 (2003).
- [20] P. Gegenwart, J. Custers, Y. Tokiwa, C. Geibel, F. Steglich, Phys. Rev. Lett. 94, 076402 (2005).
- [21] K. Ishida et al., Phys. Rev. Lett. 89, 107202 (2002).
- [22] J. Custers et al., Nature 424, 524 (2003).
- [23] L. Zhu, M. Garst, A. Rosch, Q. Si, Phys. Rev. Lett. 91, 066404 (2003).
- [24] R. Küchler et al., Phys. Rev. Lett. 91, 066405 (2003).
- [25] A. Schröder et al., Nature 407, 351 (2000).
- [26] More specifically, the data over the temperature range of KK are fitted with and , whereas those for K by and K [22].
- [27] T. Senthil, M. Vojta, and S. Sachdev, Phys. Rev. B 69, 035111 (2004)
- [28] T. Senthil, S. Sachdev, and M. Vojta, Physica B 359-361, 9 (2005).
-
1.
We would like to thank P. Coleman, J. Custers, Z. Fisk, S. Friedemann, K. Ishida, S. Kirchner, D. Natelson, N. Oeschler, and S. Wirth for useful discussions. This work has been supported by the Fonds der Chemischen Industrie, NSF Grant No. DMR-0424125 and the Robert A. Welch Foundation.
Supporting Online Material
Supporting online text
Figs. S1,S2
![[Uncaptioned image]](/html/cond-mat/0604571/assets/x1.png)
Figure 1
![[Uncaptioned image]](/html/cond-mat/0604571/assets/x2.png)
Figure 2
![[Uncaptioned image]](/html/cond-mat/0604571/assets/x3.png)
Figure 3
![[Uncaptioned image]](/html/cond-mat/0604571/assets/x4.png)
Figure 4
SOM 1. Relationship between and
The two scales, and , are distinct due to the rather different behavior that physical properties manifest across these scales.
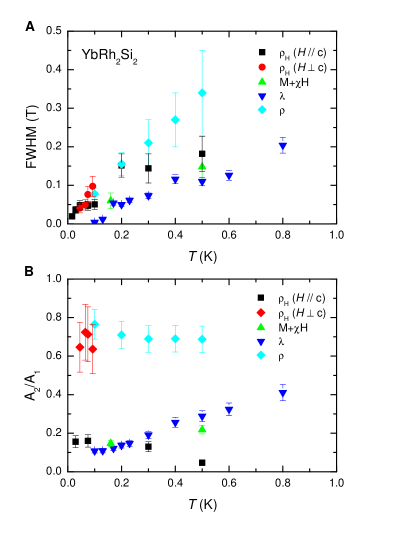
Across the line, as a function of the magnetic field (), the behaviors of isothermal physical quantities are governed by a zero-temperature jump that is smeared by temperature. The physical quantities include , , , and . The FWHM, defined in the main text, for each of these quantities is plotted as a function of temperature in Fig. S1A. Each FWHM extrapolates to zero in the limit, signaling a jump in the zero-temperature limit. For each quantity, the ratio (where and , defined in the main text, are respectively the low-field and high field values) is plotted as a function of temperature in Fig. S1B. It extrapolates to a value significantly below in the limit, implying that the extrapolated jump at zero temperature is non-zero. The existence of this zero-temperature jump implies that none of the four quantities obeys a scaling in terms of .
The line, on the other hand, represents a very different crossover. This line was already extensively discussed, based upon the specific heat and resistivity data, in Ref. 22 of the main text. For resistivity, this scale appears in the temperature dependent component. Indeed, satisfies a scaling in terms of :
| (1) |
Alternatively, the contrast between the line and the line can be seen by integrating the scaling equation (1), yielding a vs. that always has a smooth crossover across the line. This is in contrast to the jump associated with the line discussed earlier.
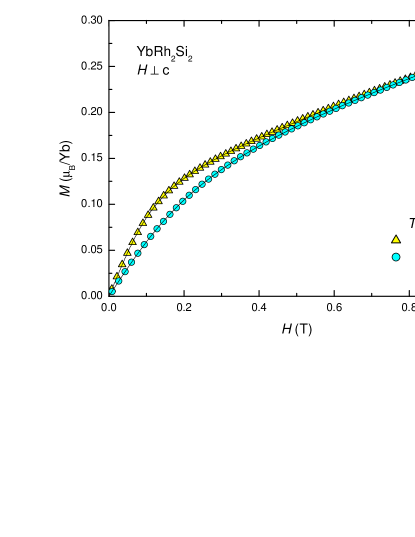
SOM 2. vs.
As shown in Fig. S2, the magnetization itself displays a similar crossover as does. Compared to the case, its linear dependence in the measured high field regime is somewhat less robust, making the fit by the fitting function to be of a slightly lower quality.