Vibrational assignments and line shapes in inelastic tunnelling spectroscopy: H on Cu(100)
Abstract
We have carried out a computational study of the inelastic electron tunneling spectrum (IETS) of the two vibrational modes of a single hydrogen atom on a Cu(100) surface in a scanning tunneling microscopy (STM) junction. This study addresses key issues about vibrational assignment and line shape of observed peaks in IETS within the framework of density functional theory calculations and the Lorente-Persson theory for STM-IETS. We argue that the observation of only a single, broad peak in the STM-IETS [L. J. Lauhon and W. Ho, Phys. Rev. Lett. 85, 4566 (2000)] is not caused by any symmetry restrictions or any cancellation between inelastic and elastic vibrational contributions for one of the two modes but is due to strongly overlapping superposition of the contributions from the two modes caused by the rather large instrumental broadening and the narrow vibrational energy separation between the modes. In particular, we find that this broadening and the large asymmetry of the vibrational line shapes gives rise to substantial apparent vibrational energy shifts of the two modes and decrease their apparent energy separation.
A most important advance in surface and nano science has been the realization of single molecule vibrational spectroscopy and microscopy at metal surfaces using a scanning tunneling microscope (STM) Stipe1998 . The unique capabilities of the STM are based on two key ingredients: (1) the highly localized tunneling of electrons in the space between the tip and the sample, resulting in atomic scale resolution in imaging; (2) the non-adiabatic coupling between tunneling electrons and the vibrations in the STM junction giving rise to characteristic signatures in the tunneling current at biases corresponding to vibrational energies. Usually, these thresholds are identified as peaks in the signal. The observed vibrational energies provide unique information about the chemical identity of single adsorbed species and can also be used to discriminate among various isotopes. To fully exploit this new vibrational spectroscopy, one needs physical insights from theory about the strengths, line shapes, and lateral spatial distributions of the vibrational signatures in the signal.
The theory of inelastic electron tunneling spectroscopy (IETS) from vibrations in a STM junction has been developed at various levels of sophistication by several groups PerBar87 ; MinMak2000 ; Lorente2000 ; Mii2002 . One important advance was made by Lorente and Persson Lorente2000 ; Lorente2000a , who generalized the widely used Tersoff-Hamann theory for elastic tunneling to inelastic tunneling from vibrations and implemented the theory in density functional theory (DFT) calculations. As demonstrated by a direct comparison of the results from the LP theory with IETS experiments, this theory is able to reproduce the observed strengths of various vibrational modes for single molecules on a copper surface Lorente2000 ; Lorente2000a ; Persson2004 ; Bocetal . In particular, the LP theory suggested that many modes were not observed due to a cancellation between inelastic and elastic contributions to the tunneling current. Furthermore, the results of the LP theory suggested a symmetry selection or rather propensity rule for IETS relating the symmetry of the vibrational mode, the spatial distribution of the inelastic signal and the tip orbital Lorente2001 . The existence of such a rule is of key importance in the assignment of various peaks in the IETS to vibrational modes.
A most simple system that raises issues about the role of symmetry and the assignment in IETS is provided by H and D atoms adsorbed on Cu(100). In these experiments by Lauhon and Ho Lauhon2000 , IETS experiments were used in a beautiful manner to discriminate between the H and D atoms, enabling the study of the isotope effect on surface diffusion. However, they observed only a single broad peak that was attributed to the perpendicular vibrational mode. This observation raises questions about the origin of the large broadening of the observed peak and why the parallel mode is not observed.
In this letter, we present a theoretical study of the IETS of H and D atoms on a Cu(100) surface based on the LP theory and DFT calculations. In particular, we clarify the origin of the observed broad single peak in the IETS in terms of strongly overlapping contributions from both the perpendicular and parallel vibrational modes, caused by the extrinsic broadening and the intrinsic asymmetry of the vibrational line shape. Before presenting and discussing our results we begin by a short review of the necessary concepts and ingredients of the theory and the calculations of IETS.
The LP theory of STM-IETS is based on the simple and physically transparent Tersoff-Hamann theory for imaging by elastic electron tunneling Tersoff1985 . This theory is based on a simple tip model, in which an emitted electron is approximated by an wave, and the Bardeen approximation for tunneling. Using these approximations one obtains that the differential conductance, , at small biases, , and low temperatures is simply determined by the local density of sample states (LDOS) at the position of the tip apex as,
| (1) |
where is the sample Fermi energy. In an one-electron approximation, as provided by density functional theory is given by
| (2) |
where is an one-electron wave function with energy .
The LP theory is based on the observation that the TH theory for elastic tunnelling can be directly generalized to inelastic tunnelling from adsorbate vibrations by considering the many-body LDOS for the electrons interacting with the adsorbate vibrations. This result is based on a few physical assumptions that are fulfilled in most cases. First, the electron-vibration coupling is assumed to be short-ranged and limited to the sample. Second, the vibrational relaxation rate should be much more rapid than the tunnelling rate, so that the vibration is nearly equilibrated. Third, the electron-vibration coupling is weak so that the vibration-induced LDOS, can be evaluated by first order perturbation theory. This non-adiabatic coupling gives rise to two distinct contributions to – one from opening up an inelastic channel for tunnelling and one from its influence on the elastic tunneling channel.
The channel for inelastic tunnelling from a vibration with vibrational frequency opens up when the bias is larger than and increases in general the tunnelling current. This threshold in results in a positive peak in the line shape function
| (3) |
where is the LDOS associated with the background differential conductance . The integrated strength is given by the inelastic fraction of the tunnelling electrons with an energy larger than . In the quasi-static limit, , this fraction is given by the vibration-induced deformation of the vacuum tails of the one-electron wave functions as
| (4) |
Here is the change in by an rms displacement of the vibrational mode.
The non-adiabatic coupling of the tunnelling electrons with the adsorbate vibration affects also the elastic tunneling channel at the threshold for the inelastic tunneling channel through the Pauli exclusion principle. This will show up as a decreased integrated strength and an asymmetry of the vibrational line shape, as given by,
| (5) |
Here the total integrated strength has a negative contribution from the elastic channel given by,
| (6) |
The asymmetry parameter is given by,
| (7) |
The remaining parameter determining the line shape in Eq. (5) is the vibrational relaxation rate .
For high frequency adsorbate vibrations on metal surfaces such as vibrations of H (and D) atoms on a Cu surface, is dominated by the absorption and emission of single electron-hole pairs. The electron-hole pair contribution to can be calculated also in the quasi-static limit from, Hellsing1984
Here is change of the one-electron potential induced by an rms displacement of the vibrational coordinate.
The density functional theory calculations of the electronic and geometric structure of an H atom on a Cu(100) surface were carried out using Vienna ab-initio simulation package VASP Kresse1996 . The electron ion core interactions were handled by the plane wave projector augmented wave (PAW) method Kresse1999 and exchange-correlation effects by a generalized gradient approximation PW91 . Because of the large lateral extension of the STM image and IET signals, we have to use a large 6x6 supercell with Cu atoms in six layers, separated by a vacuum region corresponding to five layers of atoms. For this large supercell it was sufficient to sample the Brillouin zone with a 2x2x1 mesh. A cut-off energy of 20 Ry for the plane waves was found to be sufficient. In the calculations, the H/Cu(100) system was first geometrically optimized until forces on each ion were smaller than 0.02 eV/Å. The technical details about the calculations of the electron-vibration matrix elements and the vacuum tails of the wave functions, and the handling of the discrete set of electron states can be found in Ref. Lorente2000a .
The experimentally determined four-fold hollow adsorption site Lauhon2000 was chosen as the initial configuration in the calculations. This site has been shown to be the energetically preferred site also in previous DFT studies Sundell2004 ; Lai2004 . After full structural relaxation, the vertical equilibrium distance of hydrogen from the uppermost copper layer was 0.58 Å. The nearest neighboring copper atoms to the hydrogen atom relaxed 0.04 Å outwards from the surface layer and less than 0.02 Å parallel the surface away from the hydrogen adsorption site. Relaxations of the other copper atoms were found to be much smaller. The calculated adsorption energy -0.182 eV relative to the binding energy of the H atom in the free H2 molecule () is in good agreement with the value -0.179 eV obtained by previous DFT calculations Sundell2004 .
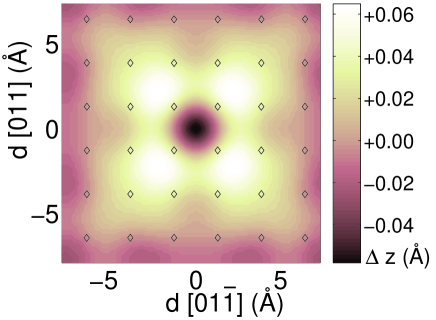
In Fig. 1, we show the topographical image of constant LDOS of the H adatom at a typical value for the tip-surface distance. The main characteristic feature of this weakly corrugated image is the 0.05Å depression at the adsorption site surrounded by four 0.06Å protrusions centered close to the nearest neighbouring hollow sites in the and directions. The shape of the image with the single depression surrounded by the four protrusions is robust for all tip-surface distances between 5 and 10Å. However, the depression at the hydrogen site decreases in depth with increasing tip-surface distance : the depth decreases from 0.07Å to 0.03Å when increases from 5 to 8Å. Note that the overall size of the affected area, about 1010Å2, is very large compared to size of hydrogen atom. All the features in the simulated STM image are in excellent agreement with the experimental image Lauhon2000 .
The origin of the protrusions in the STM image is not simply due to the outward relaxation of the nearest neighboring copper atoms or any H-induced state at the Fermi level. The protrusions still exist in the simulated image of the H atom on the unrelaxed, bare Cu surface. In accordance with the common picture of the H chemisorption Hje77 , the H atom induces an -like state just below the onset of the Cu band about 7 eV below the Fermi level. The small depression in the simulated image and the surrounding protrusions then originates from the orthogonalization of the metal states at the Fermi level against the H-induced state and also from the oscillatory screening response by the metal states of the H- entity.
The H adatom has two vibrational modes which in principle can contribute to the IET vibrational spectra. In the harmonic approximation, the calculated vibrational energies of the perpendicular mode and the twofold degenerate parallel mode are 84 and 68 meV, respectively enecomm . These values are somewhat different from the corresponding values of 76 and 70 meV Sundell2004 (71 and 62 meVLai2004 ) found in earlier density functional calculations which take into account anharmonic effects. In these calculations the vibrational excitation energies were determined from the energies of the ground state and the first excited states of and symmetry character in the full potential energy surface. These results are in better agreement with the experimental value of 70 meVChorkendorff1991 for the dipole active (perpendicular) mode and will be used in the detailed comparison with the IET experiments.
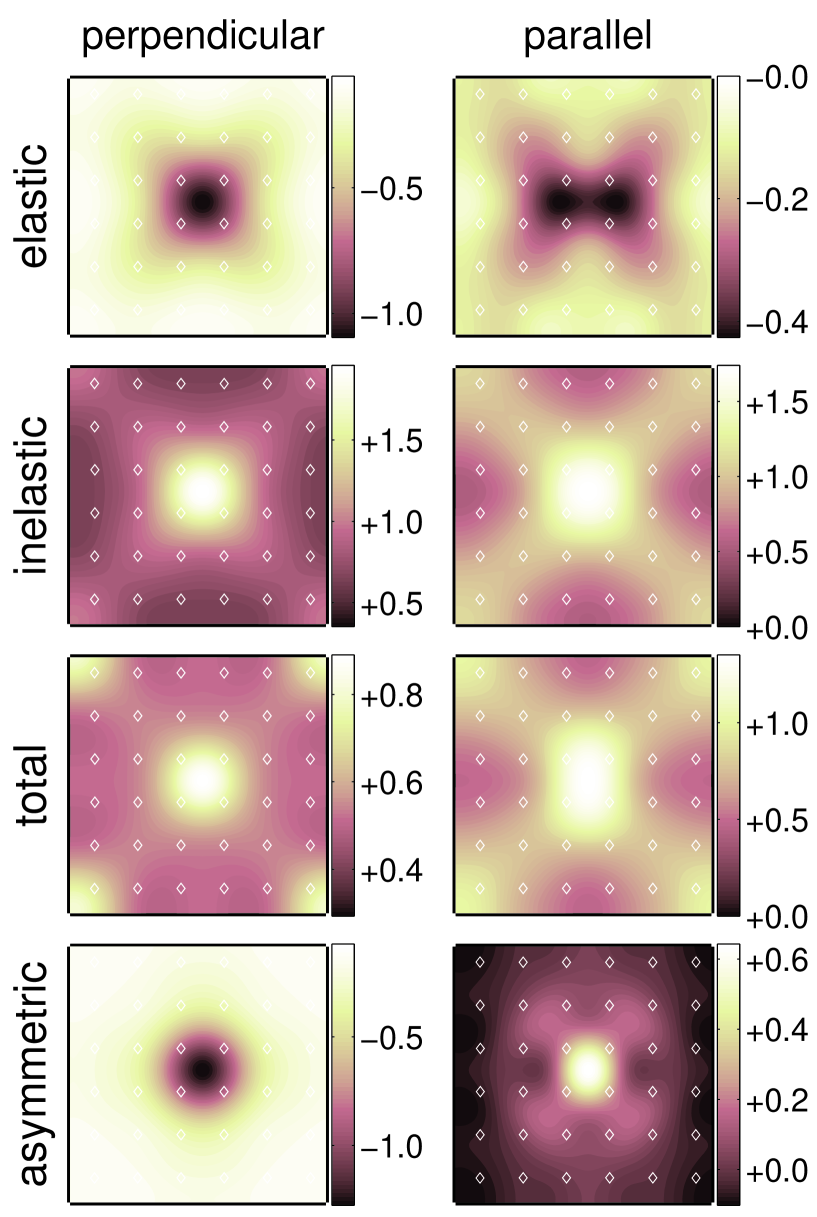
In Fig. 2, we depict the two-dimensional contour plots of the calculated IET line shape parameters , , and , as defined in Eqs. 4, 6 and 7, around the H atom for the two vibrational modes vibcomm . For the doubly degenerate parallel modes it is sufficient to map out the IET line shape parameters of the mode with a vibrational displacement in direction since for the other degenerate mode (with a displacement in the direction) the parameters are simply obtained by rotating the maps 90 degrees. The parallel mode parameters are then obtained simply as a sum of the contributions from the two degenerate modes.
The vibrational inelastic and elastic signals behave differently for the two vibrational modes. In the case of the perpendicular mode, both and are peaked on top of the H adsorption site, and cancel each other to a large extent. The extreme values for and are -1.1% and 2.0%, respectively so that has a maximum value of 0.9% on top of the H atom sigmacomm1 . In contrast, there is no near cancellation of and for the parallel mode. Thus, the extreme value of 1.4% for is stronger than for the perpendicular mode despite that the extreme values -0.4% and 1.4% for and , respectively, are both weaker than the corresponding values for the perpendicular mode sigmacomm1 . Furthermore, the extreme value of from the twofold degenerate parallel modes will be twice as large since this value is attained at the symmetrical site on top of the H atom. Note that the IET line shape parameters depend somewhat on the tip-surface distance; maps in Fig. 2 correspond to a typical distance of 7Å distcomm .
Although the perpendicular and parallel vibrational modes have different symmetry characters ( and ), the proposed symmetry selection rule in Ref. Lorente2001 or rather the symmetry propensity rule for IET does not give any definite predictions about the strengths and spatial behaviors of the inelastic and elastic signals for these two modes in this case. The effect of the H atom on the states around the Fermi level is minute as demonstrated by the small corrugation of the calculated topographical image of the H atom. This result shows that the LDOS at the Fermi level and around the H atom will not be dominated by states with a definite symmetry character. Thus there will be no significant symmetry restrictions for the IET in this case. As shown in Fig. 2, this fact is reflected by the spatial maps of being qualitatively same for the perpendicular and parallel vibrational modes. Hence these maps cannot simply be used to discriminate between these two modes.
One qualitative difference in the IET from the two vibrational modes is the sign of the asymmetry parameter , which has important implications for the vibrational line shapes in the IETS. At the H site, for the perpendicular mode is negative with an extreme value of -1.2% whereas for the parallel mode it is positive with an extreme value of 0.7%. Both these values are comparable in magnitude to , and should give rise to vibrational IETS line shapes with characteristic asymmetries for the two modes. To show that, we need first to include the calculated vibrational line widths, obtained from Eq. Vibrational assignments and line shapes in inelastic tunnelling spectroscopy: H on Cu(100), into Eq. 5 describing the vibrational line shapes. The electron-hole pair line widths are 1.8 and 1.1 meV for the parallel and perpendicular modes of the H adatom, respectively sigmacomm3 . The corresponding relaxation rates and are much larger than the tunnelling rate corresponding to the 0.1 nA current used in the experiments Lauhon2000 . Thus the current-induced non-equilibrium population of the mode should be small justifying one of the assumptions behind the LP theory that the vibration should be close to equilibrium.
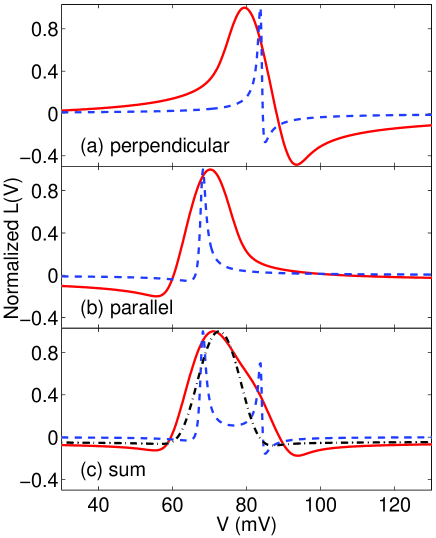
In Fig. 3, we show calculated vibrational IET line shapes for the two modes of the H adatom with the tip on top of the H atom. The intrinsic line shapes (dashed lines) calculated from Eq. 5 are clearly narrow and asymmetric as shown in Figs. 3(a) and (b). Thus we would expect that the IETS should have two clearly resolved peaks in apparent conflict with the single broad peak in the IETS observed by Lauhon and Ho. However, the theory can be reconciled with experiments by taking into account the large extrinsic broadening provided by the temperature smearing of the tip and sample Fermi distributions, and the modulation voltage extbroad . In the experiments by Lauhon and Ho, the modulation voltage had an rms value of 7 mV and the temperature was 9 K. Including these broadenings for the two modes results in the extrinsic line shape shown as solid lines in Figs. 3(a)-(c). The large extrinsic broadening and the opposite asymmetries of the two line shapes result in broad peaks that are significantly red and blue shifted for the perpendicular and parallel modes, respectively. In addition to decreasing the apparent energy separation between the peaks, the broadening is so large that the two peaks overlap strongly and can no longer be resolved as two peaks. This effect is even more pronounced when using the more precise values of 71 meV and 76 meV for the vibrational excitations obtained from Ref. Sundell2004 . Finally, the calculated total strength of the IET from the two modes is about 2-3% depending on the distance. which is in reasonable agreement with estimate of about 1.1% for the observed peak in the IETS. The theoretical isotope dependence of with the atomic mass is consistent with the observed isotope dependence of the intensity for the H and the D atom.
In summary, we have carried out a computational study of the inelastic electron tunneling spectrum (IETS) of the two vibrational modes of a single hydrogen atom on a Cu(100) surface in a scanning tunneling microscopy (STM) junction. This study addresses key issues about vibrational assignment and line shape of observed peaks in IETS and is based on density functional theory calculations and the Lorente-Persson theory for STM-IETS. We argue that the observation of only a single, broad peak is not caused by any symmetry restrictions or any cancellation between inelastic and elastic vibrational contributions for one of the two modes but is rather a superposition of the contributions from the two modes caused by the large instrumental broadening and their narrow vibrational energy separation. In particular, we find that this broadening and the large asymmetry of the vibrational line shapes gives rise to substantial apparent vibrational energy shifts between the two modes and decrease their apparent energy separation.
Acknowledgments
We acknowledge partial funding by the EU-RTN project “AMMIST”, the Swedish Research Council (VR) and the Academy of Finland. Allocation of computer resources by SNAC is also gratefully acknowledged.
References
- (1) B. C. Stipe, M.A. Rezaei, and W. Ho, Science 280, 1732 (1998).
- (2) B. N. J. Persson and A. Baratoff, Phys. Rev.Lett. 59, 339 (1987).
- (3) N. Mingo and K. Makoshi, Phys. Rev. Lett 84, 3694 (2000).
- (4) N. Lorente and M. Persson, Phys. Rev. Lett. 85, 2997 (2000).
- (5) T. Mii, S. Tikhodeev and H. Ueba, Surf. Sci.502/503, 26 (2002).
- (6) N. Lorente and M. Persson, Faraday Discuss. 117,277 (2000).
- (7) M. Persson, Phil. Trans. R. Soc. A 362, 1173 (2004).
- (8) M.-L. Bocquet, H. Lesnard, and N. Lorente Phys. Rev. Lett. 96, 096101 (2006).
- (9) N. Lorente, M. Persson, L.J. Lauhon, and W. Ho, Phys. Rev. Lett. 86, 2593 (2001).
- (10) L. J. Lauhon and W. Ho, Phys. Rev. Lett. 85, 4566 (2000).
- (11) J. Tersoff and D. R. Hamann, Phys. Rev. Lett. 50, 1998 (1983).
- (12) B. Hellsing and M. Persson, Phys. Scr. 29, 360 (1984).
- (13) G. Kresse and J. Furthmüller, Phys. Rev. B 54, 11169 (1996).
- (14) G. Kresse, and D. Joubert, Phys. Rev. B 59, 1758 (1999).
- (15) J. P. Perdew, J. A. Chevary, S. H. Vosko, K. A. Jackson, M. R. Pederson and C. Fiolhais, Phys. Rev. B 46, 6671 (1992).;Y. Wang and J. P. Perdew, Phys. Rev. B 44, 13298 (1991).
- (16) P. G. Sundell and G. Wahnström, Phys. Rev. B 70, 081403 (2004).
- (17) W. Lai, D. Xie, J. Yang, and D. H. Zhang, J. Chem. Phys. 121, 7434 (2004).
- (18) H. Hjelmberg, Physica Scripta 18, 481 (1978).
- (19) The vibrational energies were calculated by slightly displacing the H atom from its adsorption site and using the harmonic approximation for the perturbed energies.
- (20) I. Chorkendorff, P. B. Rasmussen, Surf. Sci. 248,35 (1991).
- (21) The calculations were carried out with the same displacements of the hydrogen atom as for the calculation of the vibrational energies.
- (22) The maximum values depend on the parameter used to broaden the discrete states. For parallel mode using eV gives a maximum of 1.2% and eV 0.7%. For perpendicular mode with eV and 0.3 eV, the maximum of are 1.9% and 1.1%, respectively. The spatial distribution of the signal is, however, not sensitive to the choise of . All the results shown correspond to =0.25eV unless mentioned otherwise.
- (23) The total relative change across the perpendicular mode diminishes from 1.7% to 0.9% when increasing tip-surface distance from 5 Å to 10 Å. For the same distance range the elastic signal increases from -0.6% to %, inelastic signal is weakened from 2.3% to 1.2% and asymmetry parameter from 1.1% to 0.8%. For parallel mode, the changes are smaller; total relative changes goes from 1.1% to 0.9%, elastic signal from 1.2% to 0.9%, inelastic from 2.4% to 1.7%, and asymmetry parameter from -1.5% to -1.1% for the corresponding distance range.
- (24) These values are not very sensitive to the used broadening of the states. For =0.20(0.30) eV the values were 1.85 (1.74) meV and 0.94 (1.12) meV, for the perpendicular and parallel mode, respectively.
- (25) The broadenings caused by the modulation voltage with amplitude and the tip and sample temperature were obtained by multiplying in the Fourier time () domain by and .