Low-frequency Noise in Josephson Junctions for Superconducting Qubits
Abstract
We have studied low-frequency resistance fluctuations in shadow-evaporated Al/AlOx/Al tunnel junctions. Between 300 K and 5 K the spectral density follows a -law. Below 5 K, individual defects distort the -shape of the spectrum. The spectral density decreases linearly with temperature between 150 K and 1 K and saturates below 0.8 K. At 4.2 K, the spectral density is about two orders of magnitude lower than expected from a recent survey [D. J. Van Harlingen et al., Phys. Rev. B 70, 064510 (2004)]. Due to the saturation below 0.8 K the estimated qubit dephasing times at 100 mK are only about two times longer than calculated by Van Harlingen et al.
Superconducting qubits are promising candidates for a solid-state realization of a quantum computer. Several groups have demonstrated high-quality operation of single or coupled qubits working in the charge Bib:charge , charge-phase Bib:Collin , flux Bib:Irinel , or phase regime Bib:coupledPhase . Decoherence due to external sources such as the measurement devices, has been studied extensively and is by now well understood Bib:Ithier , permitting qubit dephasing times of up to several microseconds Bib:Patrice4us . Future progress in this field of research depends crucially on understanding and controlling decoherence due to defects in the devices Bib:Astafiev ; Bib:Simmonds ; Bib:vH . Superconducting qubits contain Josephson junctions, whose Josephson energy determines the potential landscape of the qubit ( is the critical current, and is the superconducting flux quantum). Due to imperfections of the tunnel barrier, fluctuates in time, leading to fluctuations in the qubit potential. Therefore, the qubit energy splitting is not constant during an experiment, which leads to decoherence.
The role of critical current noise in superconducting qubits was addressed by Van Harlingen et al. Bib:vH . They calculated the sensitivity to -noise for different qubit designs and estimated decoherence for various data acquisition schemes, assuming a -dependence of the noise spectral density. For a quantitative comparison, they compiled -noise strengths from published data, which turned out to be remarkably universal at 4.2 K. To extrapolate to millikelvin temperatures where qubits are operated, they assumed a -scaling of the spectral density, based on an experimental study Bib:Wellstood . This assumption is supported by a recent theoretical paper Bib:Shnirman . The experimental data compiled in Ref. Bib:vH, did not contain measurements from the Al/AlOx/Al material system, which is utilized by most groups working on superconducting qubits. Also, no sub-micron junctions were included in the survey. For those junctions, it was demonstrated that individual bistable defects in the barrier can distort the -shape of the noise spectral density Bib:Rogers . Thus, for a reliable estimate of qubit dephasing times, essential parameters were still lacking. This motivated us to investigate low-frequency -fluctuations in Al junctions prepared by the double-angle shadow evaporation method Bib:Dolan , which is employed for many qubit experiments.
Low-frequency noise of a Josephson junction is caused by bistable defects situated in the tunnel barrier Bib:Rogers . The fluctuating tunnel transparency results in fluctuations in the tunnel resistance and the critical current . Each individual defect produces a random telegraph signal in the device resistance with a Lorentzian spectrum Bib:DH ; Bib:Rogers
| (1) |
where is the resistance change caused by the defect and is the average transition rate between the two states. If the random telegraph signals of many weak defects with a range of and are superimposed, the total noise spectrum of the tunnel junction shows a shape Bib:DH . In sub-micron junctions however, a small number of strong defects dominate the noise spectral density, giving rise to one or more Lorentzians on top of a background Bib:Rogers .
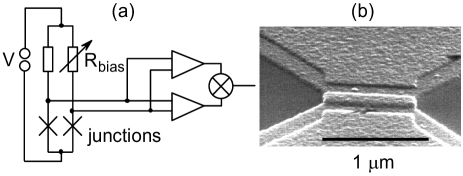
Assuming that the -product is constant, we measure fluctuations of the tunnel resistance . This is in contrast to most previous measurements, where the noise was measured directly, but was shown to give the same relative noise Bib:Mueck and also allows us to measure noise above . Our setup consists of two nominally identical samples in a bridge configuration Bib:Scofield mounted in a 3He-cryostat with a base temperature of about 250 mK (see Fig. 1 (a)). The bias resistors have more than 1000 times the sample resistance and are situated at room temperature. The samples are kept in the normal state at all temperatures by applying a magnetic field well beyond 100 mT and are biased with an ac current at 1 kHz, which is the noise optimum of our amplifiers. We use a pair of home-made battery-powered pre-amplifiers at room temperature with an input voltage noise of less than , followed by lock-in amplifiers. Their output signal is digitized and the cross-correlation spectrum is computed to suppress amplifier and cable noise. The noise floor of the system is determined by current noise injected from the amplifier inputs to the sample (about 60 fA), and residual microphonic pickup in the voltage sensing cables. The long-term stability of the setup permitted measurements down to 1 mHz at all temperatures (see Fig. 2). We determined the overall noise floor at a typical source impedance by measuring two precision metal film resistors of 1 k at 300 mK.

The choice of bias currents was dictated by heating. For test junctions in a geometry similar to flux qubits, the poor thermal conductivity of the narrow leads limited us to 400 nA. Therefore, we also fabricated samples with comparable junction areas, but rapidly widening leads (see Fig. 1 (b)). This permitted bias currents up to 2 A. Since we suppressed superconductivity in the Al lines, we could estimate the thermal conductivity seen from the junction from the geometry and the measured sheet resistance using the Wiedemann-Franz law Bib:Pobell . From this, we calculated the self-heating to be below 100 mK at the highest bias current and at the lowest temperature. We also repeated the measurements at different excitation levels, to confirm that the noise results were not affected by heating.
We prepared the samples using the double-angle shadow evaporation method Bib:Dolan . The qubit test junctions were fabricated in the same geometry and on the same chip as qubit devices with junctions sizes between and . The samples with wide leads had areas between and and were fabricated in a separate run using the same evaporator.
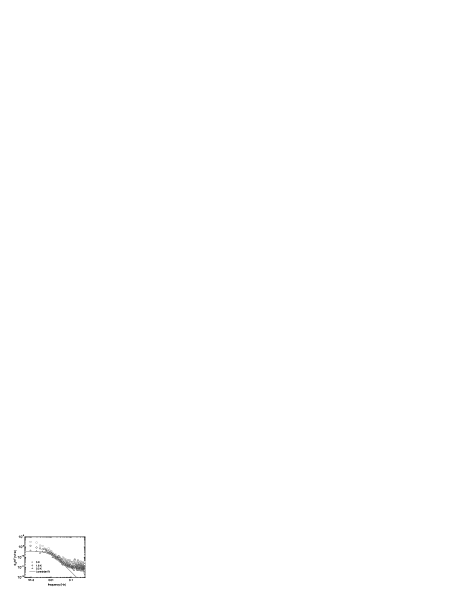
Figure 2 shows the resistance noise spectral density of a pair of two tunnel junctions with and resistance and 0.17 m2 junction area each. The results are normalized to the sample resistance, which facilitates comparison between different samples. At room temperature, the spectrum follows a law over the whole range from 1 mHz to 60 Hz. The spectral density decreases rapidly when cooling down. Below 5 K the spectrum deviates from the behavior. This is seen more clearly in Fig. 3, where we plot the normalized spectral density at low temperature. While the -like contribution keeps decreasing with at 1 mHz, saturates around 10 mHz, where a Lorentzian shape dominates the spectrum. Fitting Eq. 1 to the data in Fig. 3 gave s and .
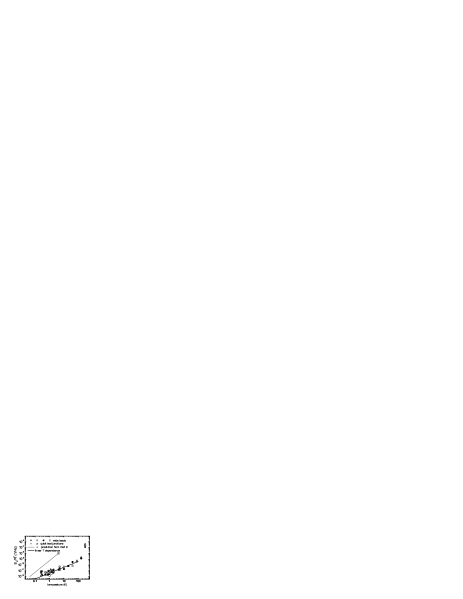
We observed a similar behavior in all the samples we measured. At the lowest temperatures, the spectrum consisted of a superposition of a -like background and one or two Lorentzians in the observed frequency range. To compare different samples, we plot at 15 mHz Bib:Why15 of five junctions in Fig. 4, normalized to a junction area of assuming a scaling of Bib:vH . The data points for the different samples are very close to each other for all temperatures. In fact, the variation between different samples is about as large as between different cooldowns (see below). We also plotted the noise prediction from Ref. Bib:vH, . It exceeds our data by more than two orders of magnitude at 4.2 K Bib:IvsRNoise . Also, the observed temperature dependence deviates considerably from the proposed -behavior. From room temperature to 150 K, decreases by about a factor of 100, and then follows a linear -dependence down to about 1 K. From the data points for individual samples at lower temperatures we find that the noise spectral density always saturates below a temperature around 0.8 K. The saturation was not due to a lack of sensitivity at lower (cf. Figs. 2, 3) nor to heating, but rather due to the saturation of individual defects dominating the spectrum, as exemplified in Fig. 3. If many of those defects are present, their spectra are superimposed and lead to -noise with a linear Bib:DH or quadratic Bib:Wellstood ; Bib:Shnirman temperature scaling, depending on the details of the defect dynamics. This picture breaks down if a small number of fluctuators dominate the spectrum. At low temperatures, we assume that their dynamics changes from the thermal to the quantum regime and the temperature dependence saturates. In this picture, we can assume that the noise level will not decrease any further when going to below 300 mK. At 100 mK, where qubit dephasing times were calculated in Ref. Bib:vH, , the observed noise spectral density is again comparable to their estimate, albeit due to a completely different temperature dependence.
We also evaluated the time constants and resistance change caused by the two-level fluctuators. The time constants, between 1 s and 60 s, were determined by the frequency window of our measurements. Assuming that the current distribution in the junctions is homogeneous and that a defect can block current flow completely in a small part of the junction, we obtain effective defect areas of typically 1 nm2 to 2 nm2.
The two-level fluctuators were changing with thermal cycling. For example, the open and solid circles in Fig. 4 are measurements of the same sample in two consecutive cooldowns. We observed a Lorentzian superimposed on a background in the first cooldown (), and only the spectrum in the second cooldown (). This leads us to assume that the lowest data points in our graph are actually the closest estimate for noise, yielding at 15 mHz. This works out to at 1 Hz, if we assume a true dependence and normalize to 1 . Note that at 1 Hz and at the lowest temperatures the -noise approaches the sensitivity of our setup.
For qubit decoherence, we have to distinguish between -noise and individual bistable fluctuators. In the former case, due to the divergence as , the total time for an experiment as well as the details of signal averaging are important, as pointed out in Ref. Bib:vH, . Using spin-echo, the coherence time can be improved only by a logarithmic factor Bib:Ithier of the order five. Random telegraph noise in the barrier resistance, on the other hand, leads to a splitting of the qubit spectroscopy lines and beats in the coherent oscillations, if the qubit energy landscape switches frequently during an experimental run. Unlike -noise, it falls off quickly at high frequencies and can therefore be efficiently suppressed with spin-echo pulses or more advanced pulse sequences, such as series of short -pulses Bib:BB . Dephasing times due to pure -noise were estimated in Ref. Bib:vH, at mK, which gave a normalized spectral density of a 1 junction of at 1 Hz. In our junctions, we observed a -noise of about a quarter of that value at 300 mK, and we assume that the noise has already saturated at that temperature. If we suppose that the -noise in qubit junctions is only due to -noise we get twice the dephasing times estimated in Ref. Bib:vH, . For the three-junction flux qubit, charge-phase and phase qubits, this works out to 1.6 s, 3.6 s, and 28 s, respectively. As an example, the spin-echo time of 4 s in a recent flux qubit experiment Bib:Patrice4us was still limited by the measurement circuitry, but already approached the expected spin-echo time due to -noise ().
To summarize, we have measured low-frequency resistance fluctuations in aluminum based Josephson junctions, as used for superconducting qubits. The noise spectral density at 4.2 K is two orders of magnitude lower than expected from the literature survey in Ref. Bib:vH, , and we find a linear -dependence between 150 K and 1 K instead of the proposed -law. The spectral density saturates below 0.8 K, which is due to individual strong two-level fluctuators. The dephasing times due to pure -noise are estimated to be about twice as long as in Ref. Bib:vH, .
We would like to thank P. Bertet, A. Lupaşcu and R. Simmonds for discussions. Financial support by FOM, NanoNed and the EU through the projects SQUBIT-2 and EuroSQIP is gratefully acknowledged.
References
- (1) *
- (2) Y. Nakamura, J. S. Tsai, Yu. A. Pashkin, Nature 398, 786 (1999); T. Yamamoto, Yu. A. Pashkin, O. Astafiev, Y. Nakamura, J. S. Tsai, ibid. 425, 941 (2003); T. Duty, D. Gunnarsson, K. Bladh, and P. Delsing, Phys. Rev. B 69, 140503 (2004)
- (3) E. Collin, G. Ithier, A. Aassime, P. Joyez, D. Vion, and D. Esteve Phys. Rev. Lett. 93, 157005 (2004).
- (4) I. Chiorescu, Y. Nakamura, C. J. P. M. Harmans, J. E. Mooij, Science 299, 1869 (2003).
- (5) R. McDermott, R. W. Simmonds, M. Steffen, K. B. Cooper, K. Cicak, K. D. Osborn,S. Oh, D. P. Pappas, and J. M. Martinis, Science 307, 1299 (2005).
- (6) G. Ithier, E. Collin, P. Joyez, P. J. Meeson, D. Vion, D. Esteve, F. Chiarello, A. Shnirman, Y. Makhlin, J. Schriefl, and G. Schön, Phys. Rev. B 72, 134519 (2005).
- (7) P. Bertet, I. Chiorescu, G. Burkard, K. Semba, C. J. P. M. Harmans, D. P. DiVincenzo, J. E. Mooij, Phys. Rev. Lett. 95, 257002 (2005).
- (8) O. Astafiev, Yu. A. Pashkin, Y. Nakamura, T. Yamamoto, and J. S. Tsai, Phys. Rev. Lett. 93, 267007 (2004).
- (9) R. W. Simmonds, K. M. Lang, D. A. Hite, D. P. Pappas, and J. M. Martinis, Phys. Rev. Lett. 93, 077003 (2004)
- (10) D. J. Van Harlingen, T. L. Robertson, B. L. T. Plourde, P. A. Reichardt, T. A. Crane, and J. Clarke, Phys. Rev. B 70, 064517 (2004).
- (11) F. C. Wellstood, C. Urbina, J. Clarke; IEEE Trans. Magn. MAG-23, 1662 (1987); Appl. Phys. Lett. 85, 5296 (2004).
- (12) A. Shnirman, G. Schön, I. Martin, Y. Makhlin, Phys. Rev. Lett. 94, 127002 (2005).
- (13) C. T. Rogers, R. A. Buhrman, Phys. Rev. Lett. 53, 1272 (1984); IEEE Trans. Magn. MAG-21, 126 (1985).
- (14) G. J. Dolan, Appl. Phys. Lett. 31, 337 (1977).
- (15) P. Dutta, P. M. Horn, Rev. Mod. Phys. 53, 497 (1981).
- (16) M. Mück, M. Korn, C. G. A. Mugford, J. B. Kycia, and J. Clarke, Appl. Phys. Lett. 86, 012510 (2005).
- (17) J. H. Scofield, Rev. Sci. Instrum. 58, 985 (1987).
- (18) F. Pobell, Matter and Methods at Low Temperatures, 2nd ed., (Springer, Berlin, 1996).
- (19) Contrary to pure noise, the -dependence of the noise for one sample does depend on the frequency (cf., e.g., Fig. 3 at 1 mHz or 10 mHz), but collecting data of different samples in one plot gave similar results for all frequencies.
- (20) This comparison assumes that -noise is due to resistance fluctuations only. Although this is generally believed to be correct (see also Ref. Bib:Mueck, ), we cannot exclude additional noise sources contributing only to -noise, but not to -noise.
- (21) H. Gutmann, F. K. Wilhelm, W. M. Kaminsky, S. Lloyd, Phys. Rev. A 71, 020302 (2005); G. Falci, A. D’Arrigo, A. Mastellone, E. Paladino, Phys. Rev. A 70, 040101 (2004).