Scaling properties of the optical conductivity of Bi-based cuprates
Abstract
We present novel infrared optical conductivity data on the three layer high Tc superconductor Bi2Sr2Ca2Cu3O10 at optimal doping. We extend the analysis of an earlier publication, providing a universal scaling function for the optical conductivity. In the present manuscript we obtain a good scaling collapse of the experimental curves on the over a wide range of values of (at least in range 0 to 10), if we assume that is superimposed on a non-universal background which is temperature independent. We obtain the same result, if in our analysis we allow this background to have a temperature dependent correction. The most striking property of is, that it corresponds to a scattering rate which varies linearly as a function of temperature, but which is independent of the frequency.
keywords:
Quantum critical , optical conductivity , scaling collapse , Drude , scattering rate , cuprates , superconductivityPACS:
74.72.Hs , 78.30.-j , 78.40.-q , 74.20.Mn, url]http://optics.unige.ch
1 INTRODUCTION
The temperature and frequency dependence of the free carrier optical conductivity of the high- cuprates has been the subject of debate since the discovery of the high temperature superconductors. The interpretation of these data is relevant and important, because the departure from simple Drude behavior reflects the nature of the interactions responsible for the transport properties of the normal state and of the superconductivity occurring in these materials. Recently some of us have pointed out two peculiar aspects of the infrared optical conductivity in the normal state[1]:
-
•
In the far infrared range the optical conductivity of optimally doped cuprates is characterized by a universal scaling function of the form
(1) where the function is to very good approximation given by with for . This corresponds to a Drude response where the scattering rate has a linear temperature dependence. A consequence of this behavior is a collapse of the spectra when is plotted as a function of for different temperatures.
-
•
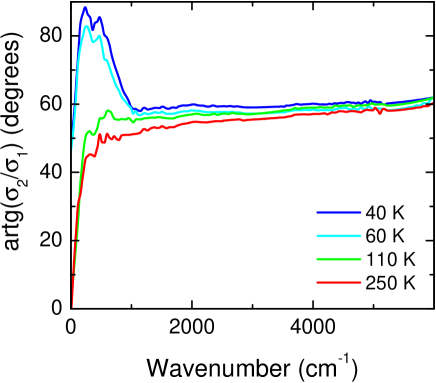
At a cross-over appears to take place to a power law behavior, previously pointed out in Refs. [2, 3, 4, 5]. For a collapse of the spectra plotted versus required that the conductivity is multiplied no longer with the temperature , but with either or . This change of behavior is also evident from a plot of the phase of the optical conductivity (), which displays a plateau with a phase angle of approximately 60 degrees for all temperatures and frequencies in access of . In the same frequency range the absolute value of the conductivity, , follows a power law behavior,. Both the frequency dependence of and of the phase angle are manifestations of the fact that the optical conductivity follows approximately a power law for frequencies in the range .
The exponent is rather different from 0.5, as given by the ’cold spot’ model[7] and closer to Anderson’s result based on the concept of spin-charge separation[5]. Experimentally the scaling and constant phase angle are most closely obeyed for samples close to optimal doping. As such they appear to be a direct manifestation of quantum critical behavior when the doping is tuned to match exactly a quantum phase transition[11]. However, it remained unclear whether a single scaling function could be defined covering both aspects 1) and 2) of the optical conductivity.
Here we extend the analysis of Ref. [1] by introducing a novel transformation, allowing us to obtain the scaling function for all frequencies. The relations for this transformation rely on the derivative with respect to temperature of the real and imaginary part of the dielectric function. For such a procedure it is important to have a dense sampling of temperature, excellent signal-to-noise ratio, and a very small spurious time-dependent drift of the data, in particular in the frequency range below 1 eV. Due to recent improvements of our infrared spectrometer, in particular in the range of 0.5 to 0.8 eV, the aforementioned requirements can be met. The best result obtained in our group in this respect is a novel data set[8] on single crystals of tri-layer Bi2Sr2Ca2Cu3O10grown at the University of Geneva[9]. In this manuscript we will therefore apply the novel transformation to the data of Ref.[8].
2 Novel transformation to obtain scaling function
The basic assumption which we will investigate is whether the optical conductivity representing the free charge carriers follows a universal scaling relation of the form[10]:
| (2) |
where is the relevant dimension and the dynamical exponent [11]. As pointed out by Philips and Chamon, T-linear resistivity requires the unphysical assumption that the dynamical exponent is negative. Consequently, no consistent account of T-linearity is possible if the quantum critical modes carry the electrical charge. Apparently, either the T-linear resistivity is not directly linked to a quantum phase transition, or ”quantum critical scenarios must relinquish the simple single scale hypothesis to explain the resistivity law in the cuprates.”[10] Despite this deficiency we will treat as an adjustable scaling parameter, which can have the value . It is clear that it is no longer justified in this case to assume that .
Before continuing we wish to make one general observation about the part of the optical conductivity described by : The integrated optical spectral weight is proportional to . We already know that in the case of interest for this paper , because at optimal doping the resistivity, , is a linear function of the temperature. Taken together -scaling and T-linear resistivity imply that the integrated spectral weight presented by has a constant value for all temperatures. Experimentally this has to be confirmed by observing the collapse of plotted as a function of . In section 4 we will see that upon close inspection, a few percent spectral weight variation between Tc and 300 K is not excluded. The optical conductivity integrated between and eV is known to exhibit a temperature dependence proportional to , with [12]. In order to include the possibility that the integrated free carrier weight has a correction proportional to , we have to multiply with a factor .
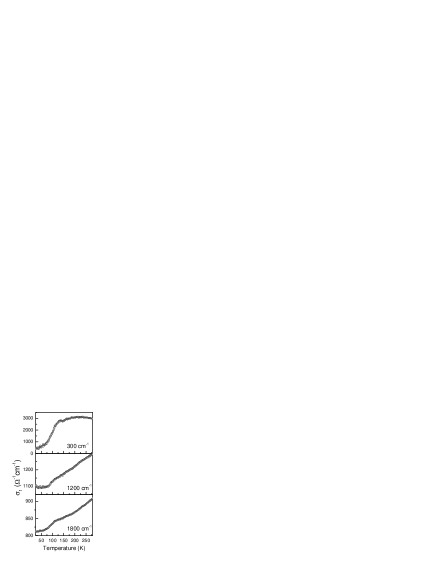
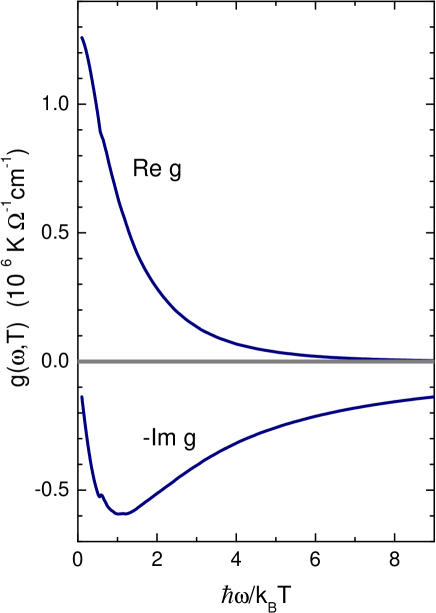
According to Ref. [1] the function obeys a Drude form, at least for , but here we are interested to find out more about the continuation beyond this range of . One possible obstacle is, that at higher frequencies the scaling behavior becomes overshadowed by ’regular’ (i.e. unrelated to quantum critical behaviour) contributions to the optical conductivity, notably in the range above about 1 eV where interband transitions dominate the optical conductivity. Because interband transitions present a fixed energy scale, for those high frequencies there is no shadow of doubt that the temperature is not the only relevant scale in the optical conductivity. For frequencies below 1 eV, but still above the situation is less clear: Interband transitions are negligible in this range, but the optical conductivity in this range strongly exceeds the values obtained by extrapolating the Drude behaviour seen in the far-infrared range. The observed below 1 eV therefore appears to be an intrinsic part of the free carrier response. Yet, it needs to be established from the experimental data whether this part is described by the same function which is found for . Experimentally[12, 13] the optical conductivity in the mid-infrared and visible part of the spectrum of optimally doped samples has a temperature dependence of the form . In Fig. 1 of the temperature dependence of and Re are shown. The non-monotonous temperature dependence in the normal state for 300 cm-1 is an immediate consequence of the fact that in this range the optical conductivity is dominated by a Drude peak the width of which varies linearly as a function of temperature. On the other hand temperature dependence is observed in the optical conductivity at least up to cm-1 [12, 8, 14, 15, 16, 17], which vastly exceeds the range of the Drude peak. Moreover the observed temperature dependence is incompatible with the narrowing of the Drude peak: For the Drude function crosses over to a T-linear temperature dependence. Indeed this is seen for example at 1200 cm-1 (see Fig. 1), but at higher frequencies the temperature variation becomes dominated by a term. Although the correction remains small relative to in all cases, its presence in the experimental data motivates us to explore the following decomposition of the optical conductivity
| (3) |
2.1 Temperature independent regular conductivity
Because the corrections and are small, we will first work out the consequences in the limit where they are zero. Since here we are interested in the behavior near optimal doping, where the resistivity is T-linear, we consider the case where . Then Eq.3 reduces to
| (4) |
In order to eliminate the temperature independent term , we start by taking the temperature derivative of this expression. For the evaluation of and we use the fact that the function depends only on a single variable , defined as the ratio .
| (5) |
Because is a function the and dependence of which enters only as the ratio , we are allowed to substitute for in taking the derivative. Thus, using the chain-rule: . Inserting this for the righthand side of Eq.5 we obtain . The integration of both sides of this equation results in an expression which relates on one side of the expression to the frequency-integral of on the other side. Multiplying both sides with finally gives the following transformation of the complex optical conductivity function
| (6) |
In the above an important starting assumption was, that depends on the ratio . It may therefore look somewhat strange that in Eq.6 we write it as a function of frequency and temperature. However, we want to feed the experimentally measured optical conductivity into the righthand side of the above transformation, providing on output. A priori there is no guarantee that the experimental optical conductivity is of the form assumed in Eq. 3. In fact this is the model we like to test by plotting the output of the transformation, , as a function of for different temperatures.
2.2 Temperature dependent spectral weight of the scaling function
If is different from zero in Eq.3 and , we have no analytical expression for the transformation. However, it is possible, to perform a least-square fit of the reflectivity and ellipsometry data for all temperatures and frequencies at once, inserting in Eq.3 a multi-oscillator Kramers-Kronig consistent composition [18] for the three terms , and .
3 Experimental procedures
3.1 Experiments
Bi2Sr2Ca2Cu3O10 (Bi2223) crystals were grown by the Travelling Solvent Floating Zone method (TSFZ) in an Image Furnace as described in Refs. [9, 19]. All optical measurements of Bi2223 were performed on an ab-oriented single crystal at temperatures from 4 to 300 K. In the frequency range 6000 - 37000 cm-1 (0.75 - 4.6 eV) we used ellipsometry, which yields directly the dielectric constant and the optical conductivity. Since the ellipsometric measurement is done at a finite angle of incidence (in our case 74∘), the admixture of the c-axis component of the dielectric tensor has to be accounted. We used our own c-axis dielectric function of Bi-2223 to convert the measured ’pseudo-dielectric’ function to the ’true’ ab-plane dielectric function using a proper mathematical procedure. Since the pseudo-dielectric function is rather insensitive to the c-axis dielectric constant in this range, the small temperature changes of the latter do not introduce significant errors to the obtained temperature-dependent in-plane spectra.
In the far-infrared and mid-infrared ranges (100 - 6000 cm-1, or 12 - 750 meV) the reflectivity at a near-normal angle of incidence was measured. In order to obtain the optical conductivity in this region, we used a variational routine [18]: a causal (i.e. Kramers-Kronig-consistent) dielectric function, which gives the best detailed match to the experimental reflectivity at low frequencies and simultaneously to the complex dielectric function at higher energies. This procedure is more accurate than the conventional Kramers-Kronig reflectivity transformation, since the knowledge of the two independent quantities at higher energies (instead of one) allows one to better ’anchor’ the unknown phase of the reflectivity at low energies. The routine also used the soft X-ray reflectivity spectra of Bi2212 in order to approximately set the high-frequency conductivity peaks.
4 Results
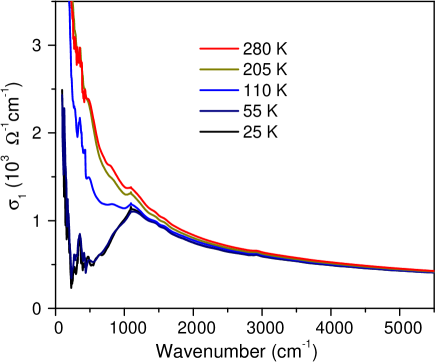
In Fig. 2 we present the in-plane optical conductivity spectra of Bi2223. Using the extended Drude formalism, we can obtain the frequency-dependent scattering rate:
| (7) |
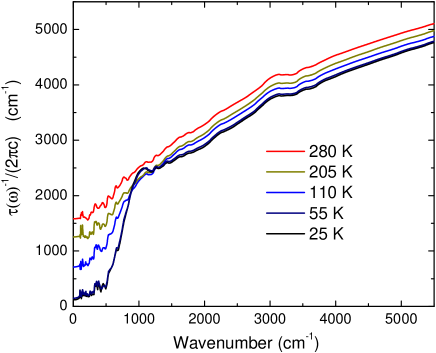
The plasma frequency was taken to be 20600 cm-1, which gives at 1 eV. The value for was obtained from a Drude-Lorentz fit to the interband transitions above 1 eV. The result, shown in Fig.3, indicates that the scattering rate has a power law type frequency dependence with as for optimally doped Bi2212. The phase of the optical conductivity, shown for a few temperatures in Fig. 4 is close to 60 degrees and almost constant, which is also similar to the phase of Bi2212 at optimal doping.[1].
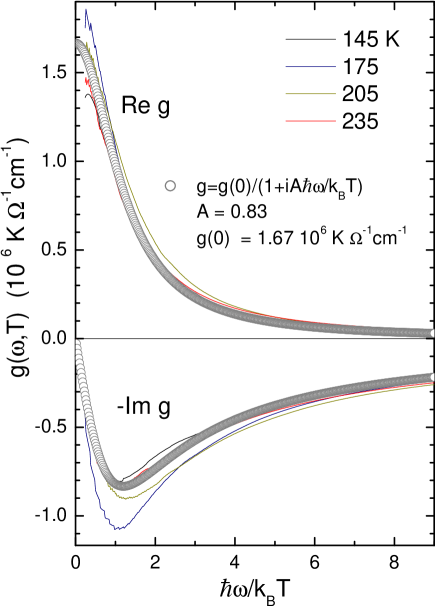
We have applied Eq. 6 to the full set of spectra in the normal state (140-260 K in 1 K steps). The output for the is shown in Fig. 5. We see, that for a broad range of values of the scaling-function is to a very good approximation given by the expression
| (8) |
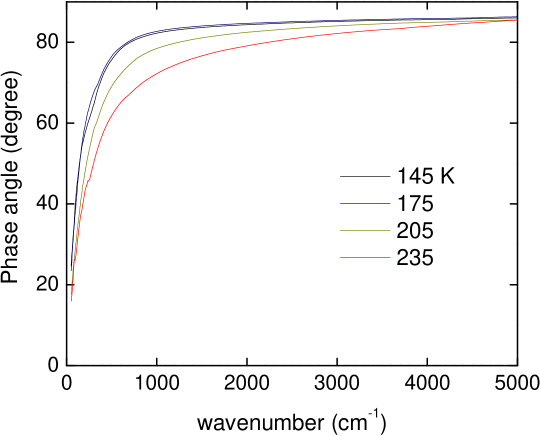
where and . This is also borne out by the frequency dependent phase of this function, displayed in Fig. 6, which asymptotically approaches 90 degree for . The curves for the different temperatures now show a good scaling collapse, also for , where in the analysis of Ref. [1] the curves started to separate. Note, that the imaginary part of has more scatter than the real part, which is due to the fact that for low frequencies the reflectivity spectra depend in in leading order only on . This is the so-called Hagen-Rubens limit, where for a frequency independent the optical reflectivity has a departure from 1.
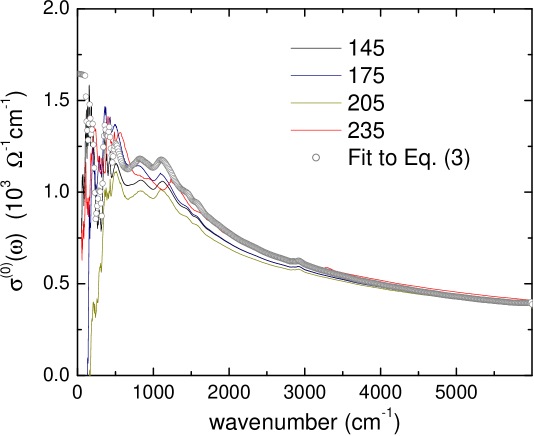
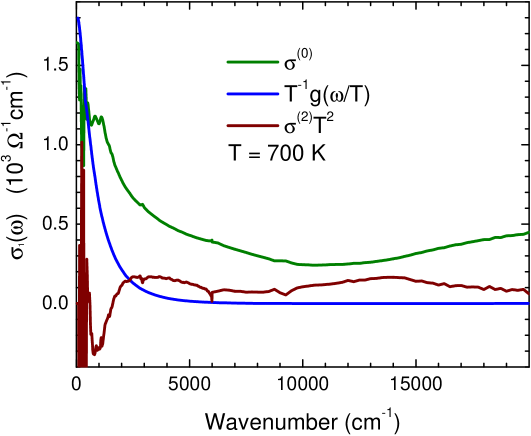
The good collapse of our scaling function for large is clearly due to the fact, that in our analysis we have removed a part of the optical conductivity spectrum which is essentially independent of the temperature. This background, which is obtained by subtracting from the experimental conductivity curves for the temperatures indicated, , is displayed in Fig. 7. If the decomposition in a T-independent part and an term would be perfect, these curves would be exactly on top of each other. In fact, we see that this works quite well, but a few significant changes remain. If we make instead the full decomposition using Eq. 3 as discussed in section2.2, we obtain an almost identical result for and . These results are presented in in Figs. 7 and 10.
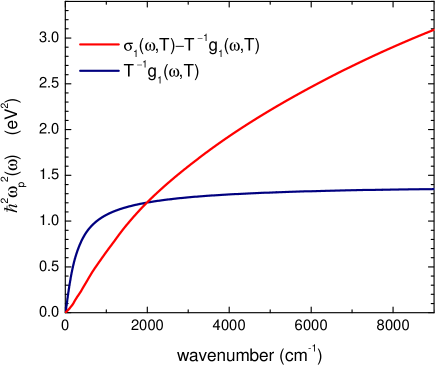
The decomposition of the infrared spectra of the cuprates in a Drude-peak and a so-called mid-infrared band has a long history, dating back to the beginning of the high Tc era. It has been pointed out by Tanner and collaborators[20], that if one splits up the optical spectra this way, one finds that about one quarter of the spectral weight below 1 eV resides in the Drude peak. The remainder is in the temperature independent background. Although our analysis is different in detail, the experimental data do lead us to make an even stronger conclusion: If we try to fit the data to a function of the general form plus a constant background, the result returned for is a simple Drude function with a T-linear scattering rate. That about one third of the spectral weight or less resides in the Drude peak, is borne out by Fig. 8, where we display for the two components the spectral weight function at T=245 K
| (9) |
-
•
Our result indicates that the constant value of the phase above 1000 cm-1 is not a manifestation at high frequencies of the same function which dominates the low frequency optical conductivity of the normal state.
-
•
If the scaling collapse has something to do with quantum criticality, then the constant phase above 1000 cm-1 has a different origin, and vice versa.
-
•
If the decomposition of Eq. 3 would be justified, our result shows that the scattering rate of has a linear dependence on the temperature, while it is a constant as a function of frequency. There are several ways of looking at this. Within a Fermi-liquid type approach this appears to be an inconsistent result, because any reasonable model which provides a temperature dependent scattering would have to produce a similar energy dependent scattering, and vice versa. This observation therefor appears to justify the assumption that the decomposition of Eq. 3 is in fact not justified in this case, and instead the entire optical conductivity below 1 eV (or at least most of it) should be interpreted as the high frequency response of the free charge carriers.
-
•
Our result does not imply that the optical spectra of the cuprates should be regarded as a sum of two independent terms, one of which is essentially a constant of temperature and the other a Drude term, it assumes such a decomposition. In fact, the data in Figs. 5 and 7 do not show a perfect collapse of the curves at different temperatures, and this already conveys a warning that Eq. 3 may not be justified on a fundamental level.
The different terms in Eq.3 are necessary to provide a continuation of for large . However, it seems overwhelmingly natural to interpret the entire spectrum below 1 eV as the response of the free charge carriers. In this view, the mid-infrared peak corresponds to the incoherent part of the optical response. Whereas the Drude peak results from the collective response to an electric field of the quasi-particles, the incoherent part results from the fact that those quasi-particles are formed out of ordinary electrons due to the coupling to a bosonic spectrum, . The Kubo formula for the optical conductivity is
| (10) |
where is the self energy devided by the temperature, , and follows from perturbation theory of the electron-boson coupling[23]
| (11) |
In the Fermi and Bose functions of the above expressions energy/temperature ratios have been substituted with the dimensionless integration variables and respectively. Varma et al.[21, 22] have proposed a bosonic spectrum with the remarkable property, that it contains no low energy scale other than the temperature itself
| (12) |
The high frequency cutoff causes the quasi-particle residue at the Fermi surface to vanish logarithmically at low temperature and frequency[21, 22]. Without , the function would have no explicit dependence on the temperature, and it is clear from the structure of Eqs. 10 and 11, that the explicit temperature dependence would disappear from as well. In other words, the optical conductivity would be of the form as discussed in this article. In this manuscript we have shown that if we assume that the optical response is of the form plus a T-independent background spectrum, the function is characterized by a scattering rate which varies linearly as a function of temperature but is a constant as a function of frequency. At first glance our data therefor appear to disagree with the Ansatz of Eq. 4. However, at present our analysis can not take into account the possible influence of a high energy cutoff . At this stage, based on the arguments presented in this manuscript we can not rule out nor confirm the validity of Eq. 4 for the optical spectra of the optimally doped cuprates. In particular the extent to which can influence the optical spectra at much lower frequencies needs to be investigated.
In a recent paper Norman and Chubukov demonstrated, that the observed phase angle and frequency exponent of the modulus of the conductivity can arise from scattering by a continuum of bosons extending at least to 300 meV[23], a value for which neither lattice vibrations nor some fluctuating order parameter is sensible. They pointed out, that this high frequency cut-off is evident as a peak in Im. Since the factor follows from the f-sum rule, such a graph can be generated from the experimental data without further assumptions. A more radical view on the nature of the excitations studied with optical spectroscopy has been advocated by P.W. Anderson, who points out that, due to the large on-site repulsion, the excitations are not true quasiparticles in the Landau sense[24]. When , the excitations created by absorbing a photon are scattered before they can recohere into the original quasiparticle. In this regime the conductivity of a sample with a hole doping should be a power law[24],
| (13) |
Indeed the experimentally observed exponent is very close to what one expects based on the known value of the doping, . An important point which still requires further theoretical and experimental attention concerns the way in which the is connected to the low frequency range, range. The detailed behavior of this cross-over promises to be an excellent way to compare, and perhaps distinguish, the predictions based on different theoretical models.
5 Conclusions
We have analyzed in detail the possibility that the optical conductivity of the cuprates at optimal doping is described by a universal scaling formula . We have introduced a differential-integral transformation which allows to extract both and from the experimental data, provided that these have been measured with sufficient accuracy and in sufficient dense set of temperatures. We have applied this analysis to recent high precision data of Bi2223. From our analysis we conclude, that corresponds to a simple Drude formula with a scattering rate which depends linearly on the temperature, and which has no frequency dependence. The ’regular’ contribution is almost a constant as a function of frequency and temperature, and contributes two thirds of the spectral weight below 1 eV. The phase of the total, experimental, optical conductivity is a constant as a function of frequency above 0.1 eV. This constant value is a result of the contributions from both and , hence it is not a continuation of the scaling function to high frequencies. Consequently, if the scaling collapse has something to do with quantum criticality, then the constant phase above 1000 cm-1 has probably a different origin, and vice versa.
6 Acknowledgements
We gratefully acknowledge useful discussions about this subject with C. M. Varma, E. Abrahams, J. Zaanen, M. R. Norman, A. V. Chubukov, F. Marsiglio, A. J. Millis, P. W. Anderson and N. Bontemps. This work was supported by the Swiss National Science Foundation through the National Center of Competence in Research ”Materials with Novel Electronic Properties-MaNEP”.
References
- [1] D. van der Marel et al. Nature 425 (2003).
- [2] Z. Schlesinger et al, Phys. Rev. Lett. 65, 801 (1990).
- [3] A. El Azrak et al Phys. Rev. B 49, 9846 (1994).
- [4] C. Baraduc, A. El Azrak, N. Bontemps, J. of Supercond 9, 3 (1996).
- [5] P.W. Anderson, Phys. Rev. B 55, 11785 (1997).
- [6] S. Sachdev, Quantum Phase Transitions (Cambridge Univ. Press, Cambridge, 1999).
- [7] L. B. Ioffe and A. J. Millis, Phys Rev. B 58, 11631 (1998).
- [8] F. Carbone et al., cond-mat/0603737
- [9] E. Giannini et al. Cryst. Res. Technol. 39, 926 (2004).
- [10] P. Phillips and C. Chamon, Phys. Rev. Lett. 95, 107002 (2005).
- [11] S. Sachdev Quantum phase transitions (Cambridge Univ. Press, Cambridge, 1999).
- [12] H. J. A. Molegraaf et al. Science 66, 2239 (2002).
- [13] A. Toschi, M. Capone, M. Ortolani, P. Calvani, S. Lupi, and C. Castellani, Phys. Rev. Lett. 95, 097002 (2005).
- [14] A.F.Santander-Syro et al., Europhys. Lett. 62, 568 (2003).
- [15] A.F. Santander-Syro et al., Phys. Rev. B 70, 134504 (2004).
- [16] G. Deutscher et al., Phys. Rev. B 72, 092504 (2005).
- [17] A.B. Kuzmenko et al., Phys. Rev. B 72, 144503 (2005).
- [18] A.B. Kuzmenko, Rev. Sci. Instr. 76, 083108 (2005).
- [19] N. Clayton et al., Supercond. Sci Technol. 17, S563 (2004).
- [20] M.A. Quijada et al., Phys Rev B 60, 14917 (1999).
- [21] C. M. Varma, P. B. Littlewood, S. Schmitt-Rink, E. Abrahams, and A. E. Ruckenstein, Phys. Rev. Lett. 63, 1996 (1989).
- [22] E. Abrahams, J. Phys. France 6, 2191 (1996).
- [23] M. R. Norman and A.V. Chubukov, cond-mat/0511584.
- [24] P. W. Anderson, cond-mat/0512471