Relation between the Liquid-Liquid Phase Transition
and Dynamic
Behavior in the Jagla Model
Abstract
Using molecular dynamics simulations, we study a spherically-symmetric “two-scale” Jagla potential with both repulsive and attractive ramps. This potential displays a liquid-liquid phase transition with a positively sloped coexistence line ending at critical point well above the equilibrium melting line. We study the dynamic behavior in the vicinity of this liquid-liquid critical point. We find that the dynamics in the more ordered high density phase (HDL) are much slower then the dynamics in the less ordered low density phase (LDL). Moreover, the behavior of the diffusion constant and relaxation time in the HDL phase follows approximately an Arrhenius law, while in the LDL phase the slope of the Arrhenius fit increases upon cooling. On the other hand, if we cool the system at constant pressure above the critical pressure behavior of the dynamics smoothly changes with temperature. It resembles the behavior of the LDL at high temperatures and resembles the behavior of the HDL at low temperatures. This dynamic crossover happens in the vicinity of the Widom line (the extension of the coexistence line into the one-phase region) which also has a positive slope. Our work suggests a possible general relation between a liquid-liquid phase transition and the change in dynamics.
I Introduction
Water is the most important solvent for biological function Bellisent ; Robinson1996 , yet it possesses many properties that are not well understood. An open question of general interest concerning liquid water is the relation between a liquid-liquid (LL) phase transition poole1 ; poole2 and dynamic properties chenJCP2004 ; chen2005PC ; PNAS ; Mallamace_PRL_2005 ; ChenPNAS ; Pradeepnature . Based on analogies with other network forming liquids and with the thermodynamic properties of the amorphous forms of water, it has been suggested that, at ambient pressure, liquid water should show a crossover between fragile behavior at high T to strong behavior at low T Bergman00 ; Angell93 ; Itonature1999 ; chenJCP2004 ; chen2005PC ; Mallamace_PRL_2005 in the deep supercooled region of the phase diagram below the homogeneous nucleation line. This region, called the “no-man’s land,” may contain a LL critical point poole1 , the terminal point of a line of first order LL phase transitions. One current hypothesis concerns the possibility that water’s anomalies are related to the existence of this LL critical point and its associated LL phase transition line poole1 ; PNAS ; Sciortino2003 . Thus far there has been no direct experimental proof of this hypothesis, but recent experiments in nanoscale hydrophilic pores chen2005PC showing a line of sharp crossover in water diffusivity were interpreted in terms of the effects of the LL critical point. A dynamic crossover has also been associated with the LL phase transition in silicon and silica Poolenature2001 ; sastrynature2003 . The relation between LL phase transition and dynamics properties may be not limited to tetrahedral liquids, but is a general feature of all liquids near the LL critical point. Here we review the results of Ref. PNAS on the Jagla model of liquid which models intermolecular interactions using a spherically-symmetric soft-core potential. We also study phase segregation and dynamics below the LL critical point.
II Two-scale spherically-symmetric Jagla ramp potential
A spherically-symmetric potential with two different length scales has been studied recently Sadr98 ; Scala01 ; Buldyrev02 ; buldyrev02 ; Stell72 ; Jagla99 ; franzese2001nature ; Wilding2002 ; Wilding2006 ; yan_PRL_2005 ; PNAS . Here, we study the linear ramp potential with both attractive and repulsive parts Jagla99 . The potential is defined as
| (1) |
where is the repulsive energy, is the attractive part, is the hardcore diameter, is the well minimum, and is the cutoff at large distance [Fig. 1].
We approximate the potential of Eq.( 1) by a step function with small steps and implement the standard discrete molecular dynamics algorithm for particles interacting with step potentials rapaport ; Buldyrev2003physicA ; franzese2001nature , We use as the unit of length, particle mass as the unit of mass and as the unit of energy. The simulation time is therefore measured in units of , temperature in unit of , pressure in units of and density in units of , where is the size of the system and is the number of particles. We use the Berendsen thermostat and barostat for constant temperature and constant pressure simulations berendsenJCP1984 .

III Results
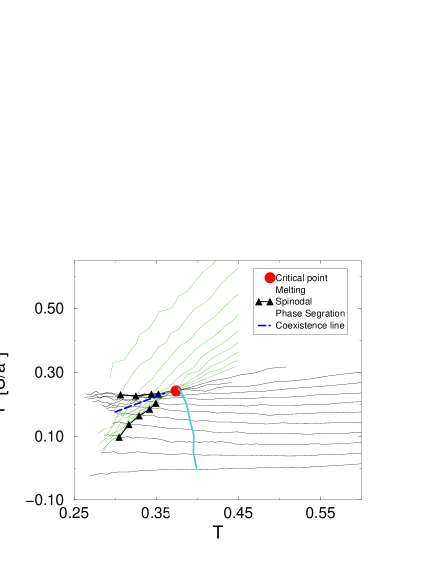
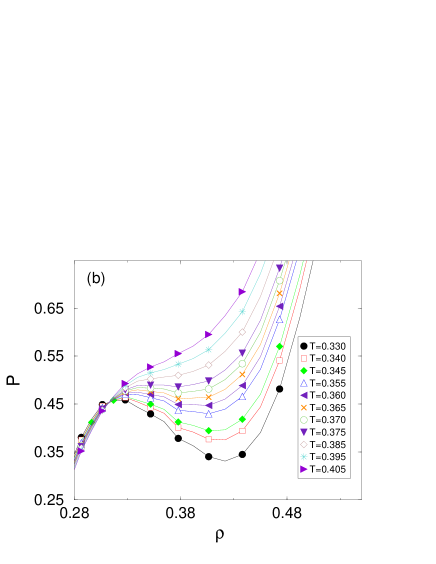
The equation of state of the Jagla model [Fig. 2] is obtained by using constant volume and constant temperature simulations (NVT-ensemble). The model displays a LL critical point located at , , and . We determine the LL coexistence line by Maxwell construction on the isotherms [Fig. 3]. The coexistence line has a positive slope of . According to the Clapeyron equation
| (2) |
the entropy in the HDL phase is lower than entropy in LDL phase. Thus the HDL phase is more ordered than the LDL phase, which is opposite to the LL transition found in simulations for water poole2 and silicon Poolenature2001 . The position of the melting line is estimated as the temperature at which the solid – liquid first order phase transition occurs upon gradually heating a system initially consisting of a crystal configuration obtained by spontaneous crystallization at low temperature. The equilibrium melting line is about below the upper limit melting temperatures Stilinger_JCP_1985 ; valeria2005 . Very recently, it has been suggested that by shrinking the attractive and repulsive ramp parameters of the Jagla model it is possible to change the sign of the slope of the LL coexistence line as well as to move the position of the critical point into the super-cooled region as in water Wilding2006 . The stability limit is defined by the HDL and low LDL spinodal lines at which
| (3) |
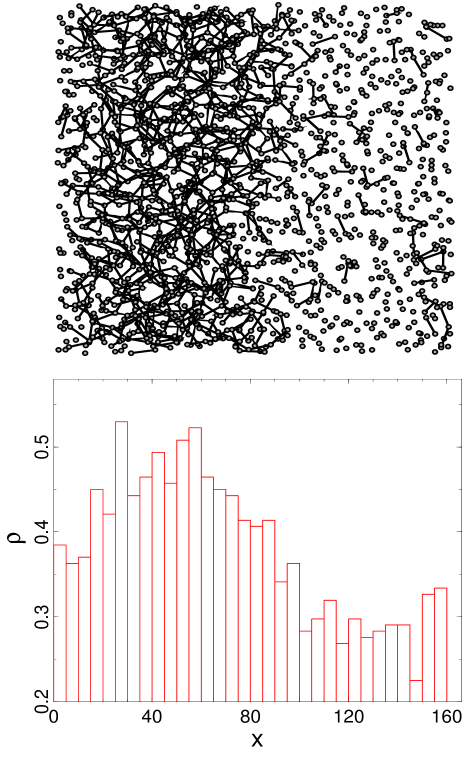
We examine the LL phase segregation along each isochore as we cool the system down in the two-phase region. We did not observe any signs of the phase segregation at temperatures higher than the spinodal temperature for a given density. In Fig. 2, the isochores terminate at points where the phase segregation is clearly visible. We show the structure of the system upon phase segregation, for at . The liquid separates into two types of liquids – HDL and LDL – with a clear phase boundary. The density of each phase is consistent with the density at the coexistent line. We present a clear visualization of the phase boundary by displaying the bonds between particles within the range . In the LDL phase, there are practically no such particles, while in the HDL phase any particle has at least one neighbor within this range. This is reflected in the high peak in the radial distribution function which appears in the HDL phase [Fig. 4].
We also study the diffusivity
| (4) |
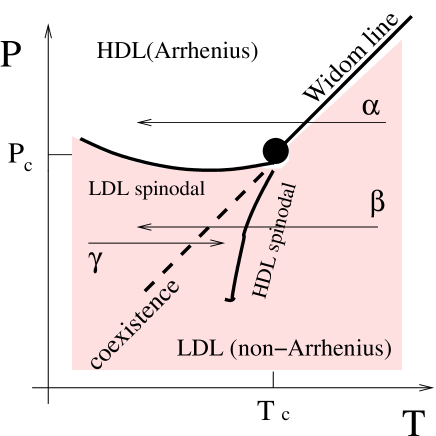
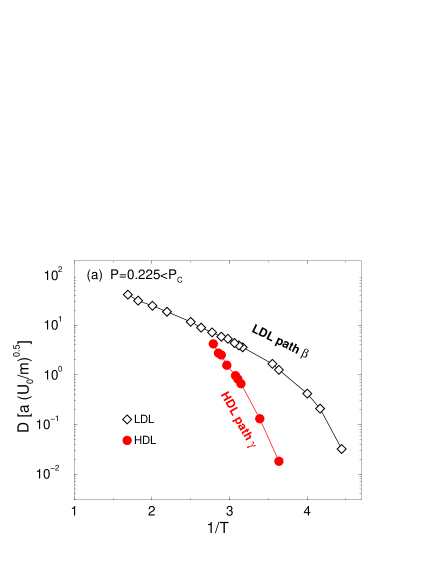
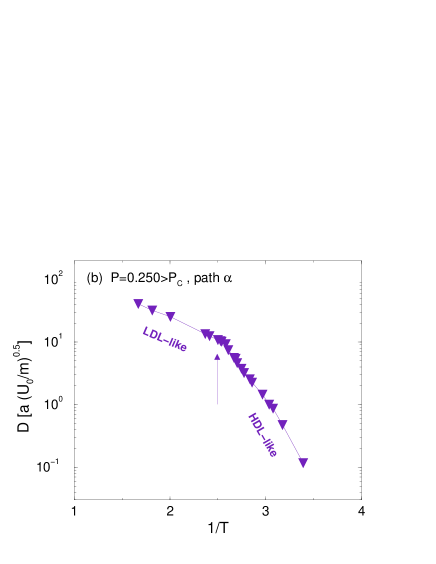
where denotes an average over all particles and over all along constant pressure paths in three different regions: (i) path above the critical point in one-phase region [Fig. 5], (ii) path [Fig. 5], below the critical point in the LDL phase, and (iii) path , in the HDL phase [Fig. 5].
Below the LL critical point along path , the diffusivity exhibits a temperature behavior different from the behavior in the LDL phase along path . The behavior of the diffusion constant and relaxation time in the HDL phase follows an approximately Arrhenius law, while in the LDL phase the slope of the Arrhenius fit increases upon cooling. As we cool along path , we can achieve very low temperatures without phase segregation so that we can measure the dynamic properties of the LDL in a metastable region below the coexistence line.
On the other hand, by heating the HDL phase along path , we can reach the stability limit of the HDL denoted by a HDL spinodal line. As we cross the HDL spinodal at constant pressure, the density of abruptly increases and the diffusivity of the system becomes equal to that of the LDL. In contrast, along path in the one phase region above the LL critical point, exhibits a dynamic crossover from the LDL-like behavior on the high temperature side of the Widom line to HDL-like behavior on the low temperature side. This dynamic crossover is an indication of crossing the Widom line above the LL critical point PNAS .
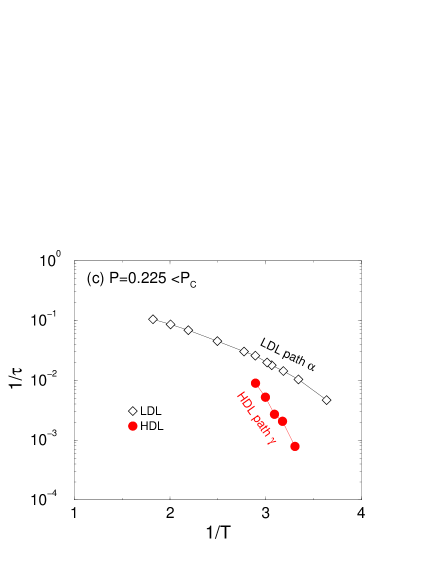
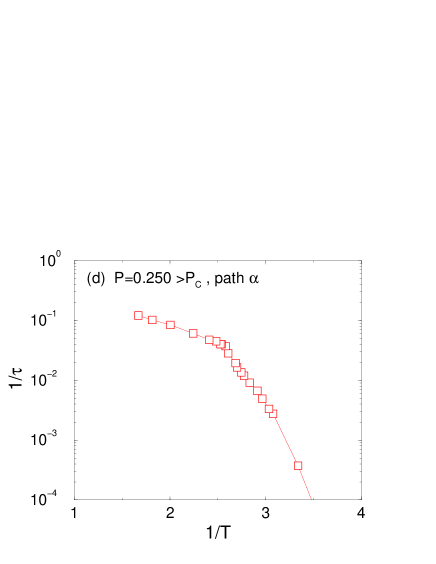
We also present results for the relaxation time along different paths, where is defined as the time when the intermediate scattering function decays to value for a certain (the first peak of the static structure factor) Sciortino . Along path with [Fig. 6(c)], differs from its behavior in LDL phase along path [Fig. 6(d)]. Above the LL critical point, along path with , we find that displays a crossover from LDL-like behavior on the high-temperature side to HDL-like behavior on the low temperature side, which is similar to the crossover found in .
IV Summary
In summary, we study a simple spherically symmetric two-scale Jagla potential with both repulsive and attractive parts. The system displays a LL phase transition well above the equilibrium melting line. The phase segregation shows direct evidence of the coexistence of two metastable states – HDL and LDL phase. The dynamic behaviors in the LDL and HDL are different from each other below the critical pressure, and change from LDL-like behavior to HDL-like behavior upon cooling above the critical pressure, suggesting the association of the changes in dynamic behavior with the LL critical point similar to the changes observed in water in nan-pores chen2005PC .
We thank C. A. Angell, S.-H Chen, G. Franzese, P. Kumar, J. M. H. Levelt Sengers, M. Mazza, P. H. Poole, F. Sciortino, S. Sastry, F. W. Starr, B. Widom, and Z. Yan for helpful discussions and National Science Fundation grant CHE 0096892 for support. We also thank the Boston University Computation Center for allocation of CPU time. SVB thanks the Office of Academic Affairs of the Yeshiva University for funding the high-performance computer cluster.
References
- (1) G. W. Robinson, S. -B. Zhu, S. Singh, and M. W. Evans, Water in Biology, Chemistry, and Physics: Experimental Overviews and Computational Methodologies (World Scientific, Singapore, 1996).
- (2) M.-C. Bellissent-Funel, ed., Hydration Processes in Biology: Theoretical and Experimental Approaches (IOS Press, Amsterdam, 1999).
- (3) P. H. Poole, F. Sciortino, U. Essmann, and H. E. Stanley, Nature (London) 360, 324 (1992).
- (4) P. H. Poole, I. Saika-Voivod, and F. Sciortino, J. Phys. Condens. Matter. 17, L431 (2005).
- (5) A. Faraone, L. Liu, C.-Y. Mou, C.-W. Yen, and S.-H. Chen, J. Chem. Phys. 121, 10843 (2004).
- (6) L. Liu, S.-H. Chen, A. Faraone, C.-W. Yen, and C.-Y. Mou, Phys. Rev. Lett. 95, 117802 (2005).
- (7) L. Xu, P. Kumar, S. V. Buldyrev, S.-H. Chen, P. H. Poole, F. Sciortino, and H. E. Stanley, Proc. Natl. Acad. Sci. bf 102, 16807 (2005).
- (8) F. Mallamace, M. Broccio, C. Corsaro, A. Faraone, U. Wanderlingh, L. Liu, C.-Y. Mou, and S.-H. Chen, J. Chem. Phys.
- (9) F. Sciortino, E. La Nave, P. Tartaglia, Phys. Rev. Lett. 91, 155701, (2003).
- (10) S.-H. Chen, L. Liu, E. Fratini, P. Baglioni, A. Faraone, and E. Mamontov, PNAS (in press).
- (11) P. Kumar, L. Xu, Z. Yan, M. G. Mazza, S. V. Buldyrev, S.-H. Chen, S. Sastry, and H. E. Stanley, cond-mat/0603557.
- (12) C. A. Angell, J. Phys. Chem. 97, 6339 (1993).
- (13) K. Ito, C. T. Moynihan, and C. A. Angell, Nature 398, 492 (1999).
- (14) R. Bergman and J. Swenson Nature 403, 283 (2000).
- (15) I. Saika-Voivod, P. H. Poole, and F. Sciortino, Nature 412, 514 (2001).
- (16) S. Sastry and C. A. Angell, Nature Materials 2, 739 (2003).
- (17) P. C. Hemmer and G. Stell, Phys. Rev. Lett. 24, 1284 (1970); G. Stell and P. C. Hemmer, J. Chem. Phys. 56, 4274 (1972); J. M. Kincaid and G. Stell, J. Chem. Phys. 67, 420 (1977); J. M. Kincaid, G. Stell and E. Goldmark, J. Chem. Phys. 65, 2172 (1976); J. M. Kincaid, G. Stell and C. K. Hall, J. Chem. Phys. 65, 2161 (1976).
- (18) M. R. Sadr-Lahijany, A. Scala, S. V. Buldyrev, and H. E. Stanley, Phys. Rev. Lett. 81, 4895 (1998); Phys. Rev. E 60, 6714 (1999).
- (19) E. A. Jagla, J. Chem. Phys. 111, 8980 (1999); J. Phys. Chem. 11, 10251 (1999); Phys. Rev. E 63, 061509 (2001).
- (20) A. Scala, M. Reza Sadr-Lahijany, N. Giovambattista, S. V. Buldyrev, and H. E. Stanley, J. Stat. Phys. 100 97 (2000); Phys. Rev. E 63 041202 (2001).
- (21) G. Franzese, G. Malescio, A. Skibinsky, S. V. Buldyrev, and H. E. Stanley, Nature, 409, 692 (2001); G. Franzese, M. I. Marqués, and H. E. Stanley, Phys. Rev. E 67, 011103 (2003); A. Skibinsky, S. V. Buldyrev, G. Franzese, G. Malescio, and H. E. Stanley, Phys. Rev. E 69, 061206 (2004); G. Malescio et al., Phys. Rev. E (2005)
- (22) S. V. Buldyrev, G. Franzese, N. Giovambattista, G. Malescio, M. R. Sadr-Lahijany, A. Scala, A. Skibinsky, and H. E. Stanley, in New Kinds of Phase Transitions: Transformations in Disordered Substances, NATO Advanced Research Workshop, Volga River, edited by V. Brazhkin, S. V. Buldyrev, V. Ryzhov, and H. E. Stanley (Kluwer, Dordrecht, 2002), pp. 97–120.
- (23) S. V. Buldyrev, G. Franzese, N. Giovambattista, G. Malescio, M. R. Sadr-Lahijany, A. Scala, A. Skibinsky, and H. E. Stanley, Physica A 304, 23 (2002).
- (24) H. M. Gibson and N. B. Wilding, cond-mat/0601474 (2006).
- (25) N. B. Wilding and J. E. Magee, Phys. Rev. E 6, 031509 (2002).
- (26) Z. Yan, S. V. Buldyrev, N. Giovambattisa, and H. E. Stanley, Phys. Rev. Lett. 95, 130604 (2005); Z. Yan, S. V. Buldyrev, N. Giovambattista, P. G. Debenedetti, H. E. Stanley, cond-mat/0601554.
- (27) D. C. Rapaport, The Art of Molecular Dynamics Simulation (Cambridge University Press, Cambridge, 1995).
- (28) S. V. Buldyrev and H. E. Stanley, Physica A 330, 124 (2003).
- (29) H. J. C. Berendsen et al., J. Chem. Phys. 81, 3684 (1984).
- (30) F. H. Stillinger and T. A. Weber, Phys. Rev. B 31, 5262 (1985).
- (31) V. Molinero, S. Sastry, C. A. Angell, cond-mat/0510292.
- (32) P. Gallo, F. Sciortino, P. Tartaglia, and S.-H. Chen, Phys. Rev. Lett. 76, 2730 (1996).