Large magnetic anisotropy in Ferrihydrite nanoparticles synthesized from reverse micelles
Abstract
Six-line ferrihydrite(FH) nanoparticles have been synthesized in the core of reverse micelles, used as nanoreactors to obtain average particle sizes 2 to 4 nm. The blocking temperatures extracted from magnetization data increased from to K for increasing particle size. Low-temperature Mössbauer measurements allowed to observe the onset of differentiated contributions from particle core and surface as the particle size increases. The magnetic properties measured in the liquid state of the original emulsion showed that the ferrihydrite phase is not present in the liquid precursor, but precipitates in the micelle cores after the free water is freeze-dried. Systematic susceptibility measurements showed the dependence of the effective magnetic anisotropy energies with particle volume, and yielded an effective anisotropy value of kJ/m3.
pacs:
75.30.Gw, 75.50.Tt, 76.80.+y, 75.75.+aI INTRODUCTION
Ferrihydrite is a poorly crystalline Fe3+ oxyhydroxide whose detailed crystal structure has remained elusive up to now, as reflected by the identification of the known phases as ’2-line’ and ’6-line’ on the basis of their two or six broad X-ray diffraction (XRD) peaks. It has been proposed that the 2-line type consists of extremely small crystalline domains, whereas the 6-line has larger crystal domains of hexagonal structure with unit-cell with parameters a = 2.96 Å, c = 9.40 Å. DRI93 More recently, Jansen et al. JAN02 have refined their XRD data by considering a space group P 1c phase plus a defective phase with P3 space group. Electron Microscopy and Mössbauer spectroscopy have been employed quite successfully for identifying the properties of both kind of structures regarding their local structural and magnetic properties. MUR96 ; MUR80 ; JOL04 ; PUN04 These works on ferrihydrite have consistently provided a landscape where some aggregates with ordered structure, with small regions of nm, display definite lattice fringes and narrow distribution of hyperfine parameters. This iron oxyhydroxide phase is found in many biological systems (e.g., iron-reducing bacteria, Aedes aegypti mosquito), as well as in hydrometallurgical operations (as an undesired precipitate). UDOFE Along with the interest of the basic physical mechanisms governing structure and surface formation, ferrihydrite has also significance because it constitutes the core of ferritin, a protein that plants and animals use to sequester and store iron, providing a fully biocompatible material to carry iron particles in potential drug delivery applications. PAR03
Regarding the magnetic properties of ferrihydrite , many reported studies on its behavior are based on its biological complex ferritin, using either 57Fe Mössbauer spectroscopy BEL84 ; BAU89 or magnetization measurements FH8 ; FH9 . The main results point to a cluster-like structure with ions antiferromagnetically ordered within the core and a small uncompensated magnetic moment (probably at the particle surface). But the actual physical units from which the observed cluster or superparamagnetic (SPM) behavior is originated have not been univocally defined.

For antiferromagnetic (AFM) particles of few-nanometer diameter, a small uncompensated magnetic moment is expected to arise from defects within the particle and/or from the unpaired surface moments of the particle. NEE61 The net magnetic moment of the particle reverses among different spatial orientations with a characteristic time that depends on temperature and particle volume. Within Néel’s model NEE49 the probability of switching the particle’s magnetic moment is a thermally activated process described by
| (1) |
where is the energy barrier that separates two energy minima between magnetization states (up and down), and is the Boltzmann constant. The pre-exponential parameter is usually assumed to be of the order of , and dependent on the reversal mechanism.MOR90A ; DOR97

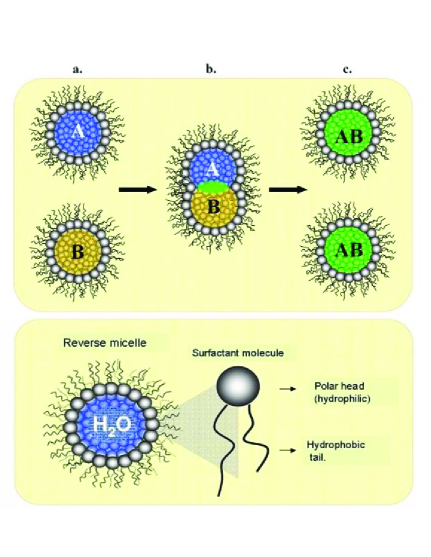
In this work we present a characterization of ferrihydrite particles with different average diameters ranging from ca. to nm, synthesized using reverse micelles as nanoreactors with the aim to have a particle volume control. Reverse Micelles (RM) consist of nanometer-sized aqueous droplets suspended in a nonpolar continuous organic phase by surfactant shells. The size of the water cores is determined by the water-to- surfactant molar ratio, W. Some aqueous phase reactions, including chemical precipitation of solid particles, can be accomplished in the micelle core. In particular, RM has been successfully employed as a nanoreactor in the synthesis of some ferrites (magnetite, , , among others) by several groups.PIL00 ; CON99 ; LIU00 However, after the precursor is formed in the micellar core, it is extracted and submitted to a thermal treatment to reach the desired compound with diameters ranging from to nm. In our case, we have realized that such precursor is, indeed, made up of 6-L ferrihydrite nanoparticles with size diameters smaller than nm depending on W. To the best of our knowledge, it is the first time that the magnetic properties of this kind of ferrihydrite synthesized in the core of RM is reported. The main objective is to investigate the contribution of the finite size and surface effects on the magnetic properties through their evolution for increasing particle size.
II MATERIALS AND METHODS
II.1 Chemicals and Synthesis
Surfactant sodium bis(2-ethylhexyl) sulfosuccinate (AOT) was purchased from Fluka Chemicals; isooctane was from Synth, tetra hydrated ferrous chloride () and sodium hydroxide (NaOH) were from Merck. All reagents were used as received. Water was distilled in all-glass apparatus, filtered and de-ionized (milli-Q water). Ethanol and acetone were used during the extraction process of nanoparticles from reverse micelles. All experiments were performed at room temperature of .
The protocol for synthesizing nanoparticles in a micellar environment is well known in the literature CAR99 ; MOT95 , and consists in mixing two reverse micelles () solutions with the same surfactant composition, but differing in the content of their aqueous phases, as shown schematically in figure 1. In our case, both micellar solutions were composed of AOT in isooctane, one of them containing 0.05 M aqueous solution of and the other 0.20 M of sodium hydroxide aqueous solution. For the mixture, 200 of the solution containing was vigorously stirred, whereas 200 of the solution containing was drop wised. The final solution was further stirred for two hours to complete the homogenization. The solution’s color changes from bright yellow to dark brown indicating the formation of iron-oxide particles CON99 ; LIU00 . Four different samples were synthesized, labeled by the molar ratio between AOT and the aqueous concentration as [water]/[AOT], with W values of and (see Table 1). In order to extract the synthesized iron oxide nanoparticles from the , the was firstly evaporated by means of a rotoevaporator. Then, the sample was several times washed with ethanol to remove the surfactant by centrifuging. Finally, the samples were washed with acetone to improve the drying. All samples were stored at room temperature and low pressure in a camera containing silica-gel. Elemental analysis indicated that the resulting dried powders contained c.a. of C in their composition. The presence of C atoms in the synthesized sample is due to the surfactant residues not well eliminated in the washing process, that might remain attached to the nanoparticle surface.
II.2 Apparatus
X-ray diffraction () was used to investigate the crystallographic structure of the powder samples. The experiments were performed by means of a Rigaku-Denki powder diffractometer with a conventional X-ray generator ( radiation, Å and a graphite monochromator) coupled to a scintillation detector. The angular scanning performed on all samples ranged from up to with step-widths. The average particle diameter () was calculated from the full width at half maximum of the more intense reflection using Scherrer’s equation SCH .

Mössbauer spectroscopy (MS) measurements were performed between and in a liquid He flow cryostat, with a conventional constant-acceleration spectrometer in transmission geometry. The spectra were fitted to Lorentzian line shapes using a non-linear least-squares program, calibrating the velocity scale with a foil of at . When necessary, a distribution of hyperfine magnetic fields, isomer shift and quadrupole splitting have been used to fit the spectra. Magnetization and ac magnetic susceptibility measurements were performed in a commercial SQUID magnetometer both in zero-field-cooling (ZFC) and field-cooling (FC) modes (always in the heating direction) between and under applied fields up to . The frequency dependence of both in-phase and out-of-phase components of the ac magnetic susceptibility were measured by using an excitation field of and driving frequencies .
III EXPERIMENTAL RESULTS
III.1 Structural Analysis and Particle Dimension

X-ray profiles performed on dried powders showed two prominent peaks at and , as indicated by the arrows in the figure 2, corresponding to q values of 2.49 Å-1 and 4.17 Å-1, respectively. The broad peak at seems to be two peaks combined. Additionally, small peaks at and can be noticed, and also a very small feature at . These features on the XRD pattern agrees with a 6-line ferrihydrite phase. JAM98 The sample presents additional peaks that are identified as diffraction peaks from crystals. This phase is likely to be formed during the AOT extraction process, since it is known that at values all water in the pool is strongly bounded and there is a high local amount of hydroxyl ions (related to the AOT hydrolysis process). When a nanoparticle grows in this environment, it must also be strongly bound to the hydrolyzed AOT polar head, yielding formation on the nanoparticle surface. This is not observed at concentration ratios to because the presence of bulk water facilitates the nanoparticle solvation and a decrease in concentration of local hydroxyl ions.
Because of the low crystallinity of ferrihydrites, the broad peaks cannot be directly used for an accurate determination of the particle size through the Scherrer’s formula, so that further transmission electron microscopy (TEM) images were used to better define the particle dimension. Figure 3 shows as an example a TEM micrograph from W15 sample. All images were recorded with a slow scan CCD camera (Proscan) and processed in the AnalySis 3.0 software that allows to work with enhanced images in such a way that particle-by-particle size measurement can be performed with high precision. Table 1 contains the average particle diameter obtained from the diffraction data, calculated from the broad diffraction peak at . The resulting values were compatible with the mean values observed in electron microscope images and expected for six-line ferrihydrites. UDOFE ; JAM98 Note that the average size seems to increase from to , suggesting that the micelle pool features might, in our case, define the iron-oxide based nanoparticle size.
| Sample | IS | |||||||||
|---|---|---|---|---|---|---|---|---|---|---|
| (nm) | (K)a | J)a | (kOe) | J)b | (mm/s) | (T) | (T) | (a.u.) | ||
| W10 | 10 | 2.4(1) | 10.4(5) | 4.5(3) | 1.23(9) | 3.1(3) | 0.42(1) | 47.1(1) | 44.5 | 3470 |
| W15 | 15 | 3.2(1) | 17.4(5) | 7.8(4) | 1.22(9) | 5.0(4) | 0.42(1) | 48.3(1) | 46.6 | 2336 |
| W20 | 20 | 3.1(1) | 20.1(5) | 10.1(3) | 1.22(9) | 6.6(3) | 0.43(1) | 48.5(1) | 46.8 | 2004 |
| W30 | 30 | 3.9(1) | 29.5(5) | 16.5(5) | 1.13(9) | 11.7(7) | 0.41(1) | 48.7(1) | 46.9 | 1706 |
a From ZFC curves, see text and fig 6.
b From data.
III.2 Mössbauer Measurements
In the SPM state the magnetic hyperfine interactions are averaged to zero due to fast relaxation of the particle magnetic moments, so that the resulting Mössbauer spectra consist of a paramagnetic-like doublet. Accordingly, the room temperature spectra recorded for samples W10 to W30 (Figure 4) showed the expected doublet, with essentially identical hyperfine parameters, i.e., quadrupole splitting QS mm/s and Isomer Shift IS mm/s for all samples. In the blocked state, the nuclear spin levels of the probe are split by the magnetic interactions yielding a six-line Mössbauer spectrum. For a few-nanometer particle, it is known that surface contributions become increasingly important, resulting in a experimentally observed decrease of hyperfine magnetic fields , assigned to weaker exchange fields sensed by the atoms at the surface. RUS03 For the present particles with average diameters nm (corresponding to few lattice parameters, respectively), about of the spins will be located at the surface of the particle. Accordingly, the resulting spectra at T = 4.2 K (fig. 5) were composed of an unresolved distribution of magnetic sextets reflecting the different local Fe environments and, therefore, hyperfine field distributions were used for fitting the low temperature spectra. The resulting parameters (Table 1) showed a reduced value of hyperfine fields (both the maximum and mean values) for the W10 sample that increase smoothly for the larger particle sizes, reflecting the large surface effects of the smallest particles. For samples W15, 20, 30 the hyperfine parameters are in agreement with 6-lines ferrihydrite though with a slightly reduced when compared to the corresponding values in ”well-crystallized” 6-line ferrihydrite. THE06 This decrease could be related to lattice defects (vacancies). It is possible to observe that the second moment of the distribution, which describes how the fields are distributed around , steadily decreases with increasing particle size. For sample W30 the distribution is quite narrow, and the profile shows an incipient shoulder at T. This shoulder suggests a difference between surface and core spin environments for the largest particles. For sample this shoulder is still noticeable, but for smaller particles ( and ) the spin environments of surface and core become increasingly alike, the corresponding hyperfine fields merge each other and the resulting distributions become broader.

III.3 Magnetization data
The magnetization curves M(T) taken in field-cooling (FC) and zero-field-cooling (ZFC) modes with Oe are shown in Fig. 6. The maxima of the ZFC branches, from which the blocking temperature is usually defined, shifts smoothly to larger temperatures for increasing W values (Table 1). It is well known that interparticle interactions can influence the blocking process and even the magnetic dynamics of the system DOR97 . The interparticle interactions are mainly determined by the ratio of the average distance between particles to their size. For the present concentrated (powder) samples dipolar interactions (DI) are likely to exist and to influence to some extent the magnetic behavior, although we are unable to quantify these parameters. However, the fact that W10 and Wgel samples, with identical particle size but different interparticle distances shown nearly identical blocking temperatures (fig 6 and 7 and discussion below) suggest that DI are not the dominating contribution to the energy barrier in these particles. For each sample, both ZFC and FC curves (measured for increasing temperatures) merge each other at temperatures very close ( K) above , and the system displays full reversibility above this temperature. In real systems the distribution of particle sizes yields a distribution of , so that can only be reached when all particles, including the largest ones, become unblocked. The close values between and is a clear indication of the extremely narrow distribution of particle sizes in our samples.

In order to see whether the magnetic phase is formed inside the reverse micelles in the liquid state, we have measured the curves for the precursor aqueous solutions. Figure 7 shows the results for the precursor liquid having molar ratio (i.e., identical to the W10 sample). The observed paramagnetic behavior down to K demonstrates that no formation of phases with long-range magnetic order occurs at the liquid stage of the synthesis process. To further investigate the formation process, the original solution was liophylized at Torr during 1 h, until most of the liquid was freeze-dried. The resulting ZFC curve of (fig. 7) shows a maximum in the ZFC branch, clearly showing the development of the magnetic phase having large-range magnetic order. The position of this maximum, located at the same temperature K than the corresponding W10 sample, indicates that particles with the same average particle size are present in both and W10 samples. The above results support the idea that the particle growth is limited by the micelles, whose boundary determines the final particle volume.

The magnetization as a function of applied fields M(H) taken at 4.2 K showed non saturating behavior up to (see fig. 8), with coercive field values kOe, which are compatible with previously reported values for this material. THE06 This non-saturating behavior has been explained by Néel as originated in the contribution of the core susceptibility of the antiferromagnetic (AFM) fine particles.NEE61 The coercivity of the particles was found to vanish very close from TB of each sample, as observed in fig. 8 for sample W10, showing almost no coercivity already at T K.
III.4 Susceptibility measurements
A typical set of data from the real (,T) and imaginary (,T) components of the ac susceptibility is shown in Figure 9. Similar trends were observed for all samples. Both components of (,T) exhibit the expected behavior for SPM systems, i.e., the occurrence of a maximum at a temperature that shifts towards higher values with increasing frequency. DOR97 It can be observed from Table 1 that the values increase from to samples. The observed increase of could reflect either the influence of the particle volume and/or anisotropy on the effective activation energy = , since our results clearly show (see fig. 10) that the Néel-Arrhenius model correctly suits the behavior of all samples. However, although the relaxation times of all samples exhibit exponential dependence on temperature (Eq.1), the fitted values of are increasingly smaller than the to s expected for SPM systems. Both effects (i.e., increase in energy barriers and small relaxation times) are known to occur in system of interacting particles DOR97 ; YOENDOJAP where, in addition to the contributions from the intrinsic particle anisotropy to such as shape, magnetocrystalline, or stress ansotropies, interparticle interactions (dipolar or exchange) can also modify the energy barrier.
The fitting of the experimental data using eq. 1 and the average particle radii from XRD data yielded the values of kJ/m3, which lays within the wide range of values reported for the effective anisotropy constant of synthetic ferrihydrite = . SUZ96 ; GIL00 ; HAR99

IV DISCUSSION
Single-domain magnetic particles reverse their magnetization direction due to thermal agitation, with a characteristic time and, therefore, the temperature of the blocking transition depends on the window time of the experimental technique used. Typical magnetization measurement assumes as s, and Mössbauer spectroscopy s. A first estimation of the activation energy was made using the values of and and the relation at the SPM transition DOR97
| (2) |
.
The resulting values are included in Table 1. The observed increase of could be attributed to the increasing particle volume on the energy barriers of the system. It is known that the ratio between the average distances and sizes of the particles usually determines how much the interaction influences . For example, at low concentrations the interaction is weak and therefore the single-particle anisotropy is dominant. However, as already discussed for ac susceptibility data these values are obtained in non-diluted samples and thus they include the (unknown) contribution from magnetic dipolar interactions to the effective anisotropy constant . Since the samples are in the concentrated regime, small changes in particle volume could affect the dipolar interactions because particle diameters are comparable to the average distance between particles. The observed variation of in fig. 10 seems too large to be explained only by volume changes, so that changes in the interparticle interactions cannot be discarded. The value obtained from eq. 2 amounted to kJ/m3, which is in agreement with the kJ/m3 value from ac susceptibility discussed above. These values are nearly two orders of magnitude larger than the usual values for iron oxides. We propose that this large value for the magnetic anisotropy is mainly related to the ferrihydrite phase, and give some arguments below.
The fit of the frequency dependence (fig. 10) gave very close values of magnetic anisotropy for all samples, suggesting that the slight spread in values are related to experimental sources of error. Although this value obtained for the present non-diluted system also includes the effects of dipolar interactions, such a large value suggests other sources of anisotropy. Shape anisotropy is not expected to be the main contribution due to the spherical morphology observed from TEM images. We have estimated the shape contribution expected for deviations into a (e.g. prolate) spheroid with ( and are the minor and major axis, respectively), to the effective anisotropy. For the above situation, the shape-anisotropy constant given by KSHAPE
| (3) |
where is the particle magnetization and . An upper limit for this contribution can be estimated setting , and noting that particles with this ratio value, that should be easily observable, were not detected from TEM images. Even if particles having this shape were present, they would contribute to with , which is only of the experimental value. It should be noted that the ferrihydrite particles retain their surfactant layer after lyophilization, and therefore exchange coupling between particles is not expected. We have discarded possible anisotropy contributions from the organic coating, since the value of the effective anisotropy is expected to decrease for increasing particle size when surface effects are dominant.
It can be noted from figure 10 that the linear fits using eq.1 extrapolate to increasingly large values at (i.e., ) for increasing values, in agreement with the expected dependence of this parameter on temperature and particle volume. NOW05 However, a quantitative analysis of this dependence would require a general expression for , which is not yet known. DOR97 .

In conclusion, we have succeeded in controlling the resulting particle sizes of ferrihydrite particles by varying the water and surfactant molar ratio in the reverse micelle used as a nanoreactor. The resulting magnetic behavior reflects this control of average particle size through the smooth variation of the magnetic parameters, such as blocking temperature and activation energy . By investigating the thermally activated nature of the blocking process through dynamical data, a rather large anisotropy constant of kJ/m3 has been obtained. The origin of this anisotropy, which is times larger than the typical for iron oxides, remains uncertain, as well as question whether it is located at the core or surface of the particles. The well-known ability of ferrihydrite to transform quite easily into other iron phases, depending on the environmental conditions JAM98 ; EGG88 (further favored in nanoparticles due to the large surface area) led us to search for evidence of phase evolution in our particles. After repeating both magnetization and Mössbauer experiments several weeks later, we obtained essentially the same results as in fresh samples.
V Acknowledgments
This work was supported in part by the
Brazilian agencies FAPESP, CNPq and CAPES/Procad. ELD was a
recipient of CNPQ PhD fellowship. TSB was supported by National
Science Foundation (NSF) grant EAR 0311869 from the Biogeosciences
program. This is IRM publication No. 0604. ELJ is thankful to the
VolkswagenStiftung, Germany, for providing financial support through
a Postdoctoral Fellowship. GFG acknowledges financial support from
the Spanish Ramon y Cajal
program.
References
- (1) Drits V, Sakharov A, Salyn B A, Manceau A L, and Clay A, 1993 Miner. 28 185.
- (2) Jansen E, Kyek A, Schäfer W, and Schwertmann U, 2002 Appl. Phys. A - Mater. Sci. and Processing 74 1004.
- (3) Murad E, 1996 Phys. Chem. Minerals 23 248.
- (4) Murad E, and Schwertmann U, 1980 American Mineralogist 65 1044.
- (5) Jolivet J P, Chanéac C, and Tronc E., 2004 Chem. Commun. 5 477.
- (6) Punnoose A, Phanthavady T, Seehra M S, Shah N, and Huffman J P, 2004 Phys. Rev. B 69 054425.
- (7) Cornell R M, and Schwertmann U, 1996 The Iron Oxides: Structure, Properties, Reactions, Occurrences and Uses (Wenheim, Germany: Wiley-VCH).
- (8) Pardoe H, Chua-anusorn W., St. Pierre T G, and Dobson J, 2003 Phys. Med. Biol. 48 N89.
- (9) Bell S H, Weir M P, Dickson D P E, Gibson J F, Sharp G A, and Peters T J, 1984 Biochim. Biophys. Acta 787 227.
- (10) Bauminger E P, and Nowik I, 1989 Hyp. Int. 50 489.
- (11) Kilcoyne S H, and Cywinsky R, 1995 J. Magn. Magn. Mat. 140 1466.
- (12) Makhlouf S A, Parker F T, and Berkowitz A E, 1997 Phys. Rev. B 55 R14 717.
- (13) Néel L, 1961 C. R. Acad. Sciences 253 9.
- (14) Néel L, 1949 Ann. Geophys. 5 99.
- (15) Mørup S, 1990 Hyp. Int. 60 959.
- (16) Dormann J L, Fiorani D, and Tronc E, 1997 Adv. Chem. Phys. 98 283.
- (17) Hochepied J F, Bonville P, and Pileni M P, 2000 J. Phys. Chem. B 104 905.
- (18) O’Connor C J, Seip C T, Carpenter E E, Li S, and John V T, 1999 Nanostructured Mat. 12 65.
- (19) Liu C, Zou V S, Rondinone A J, and Zhang Z J, 2000 J. Phys. Chem. B 104 1141.
- (20) Carpenter E E, and O’Connor C J, 1999 J. Appl. Phys. 85 5175.
- (21) Motte L, Billoudet F, and Pileni M P, 1995 J. Phys. Chem. 99 16425.
- (22) Klug H P, and Alexander L E, 1974 X-Ray Diffraction Procedures for Polycrystalline and Amorphous Materials, Ed. (New York: Wiley-Interscience).
- (23) Jambor J L, and Dutrizac J E, 1998 Chem. Rev. 98 2549.
- (24) Guyodo Y, Banerjee S K, Lee Penn R, Burleson D, Berquo T S, Seda T, and Solheid P, 2006 Phys. Earth Planet. 154 222.
- (25) Rusponi S, Cren T, Weiss N, Epple M, Buluschek P, Claude L, and Brune H, 2003 Nature Materials 2 546.
- (26) Arelaro A D, Brandl A L, Lima Jr. E, and Goya G F, 2005 J. Appl. Phys. 97 014133.
- (27) Suzdalev I P, Buravtsev V N, Imshennik V K, Maksimov Yu V, Matveev V V, Novichikhin S V, Trautwein A X, Winkler H, 1996 Z. Phys. D 37 55.
- (28) Gilles C, Bonville P, Wong K K W, and Mann S, 2000 Eur. Phys. J. B 17 417.
- (29) Harris J G E, Grimaldi J E, Awschalom D D, Chiolero A, and Loss D, 1999 Phys. Rev. B 60 3453.
- (30) Aharoni A, 1998 J. Appl. Phys. 83 3432.
- (31) Nowak U, Mryasov O N, Wieser R, Guslienko K, and Chantrell R W, 2005 Phys. Rev. B 72 172410.
- (32) Eggleton R A, and Fitzpatrick R W, 1988 Clays Clay Miner. 36 111.