Origin of the slow dynamics and the aging of a soft glass
Abstract
We study by light microscopy a soft glass consisting of a compact arrangement of polydisperse multilamellar vesicles. We show that its slow and non-stationary dynamics results from the unavoidable small fluctuations of temperature, which induce intermittent local shear deformations in the sample, because of thermal expansion and contraction. Temperature-induced shear provokes both reversible and irreversible rearrangements whose amplitude decreases with time, leading to an exponential slowing down of the dynamics with sample age.
pacs:
82.70.-y, 61.20.Lc, 61.43.-j, 62.20.FeQuite generally, correlation functions in glassy systems exhibit a two-step relaxation Donth2001 . This applies to supercooled molecular liquids and spin glasses, but also to a large variety of soft materials, such as concentrated colloidal suspensions vanMegenPRE1998 , emulsions HugangPRE99 , surfactant phases, and gels Faraday03 . In soft glasses, the initial decay of density-density correlators measured e.g. by dynamic light scattering is well understood: it corresponds to the thermally activated motion of particles in the cage formed by their neighbors vanMegenPRE1998 , or to overdamped phonons, whose amplitude is restricted by structural constraints, like in concentrated emulsions HugangPRE99 or surfactant phases Faraday03 . By contrast, the motion associated with the final relaxation of the correlation function is still poorly understood, in spite of the large research effort of the last years. Subdiffusive vanMegenPRE1998 ; SimeonovaPRL2004 , diffusive AbouPRE2001 , hyperdiffusive KnaebelEPL2000 and ballistic Faraday03 ; BandyopadhyayPRL2004 behavior has been observed, often associated with dynamical heterogeneity KegelScience2000 ; WeeksScience2000 ; LucaJPCM2003 ; DuriPRE2005 and aging KnaebelEPL2000 ; AbouPRE2001 ; ViasnoffPRL2002 ; CourtlandJPCM2003 ; SimeonovaPRL2004 . In most cases, the origin of this slow dynamics is not clear, although elasticity and the relaxation of internal stress have been highlighted as possible key ingredients Faraday03 ; RamosPRL2005 ; BandyopadhyayPRL2004 ; KnaebelEPL2000 . Indeed, light scattering experiments coupled to rheology have shown that an external oscillatory shear strain can help the system evolve towards a more relaxed configuration, presumably by relaxing internal stress PineHebraudPRL ; PetekidisPRE2002 ; ViasnoffPRL2002 . However, the physical mechanism by which internal stress may be relaxed in undriven systems has not been identified clearly to date.
In this Letter we present light microscopy experiments that probe the aging dynamics of a compact arrangement of multilamellar vesicles. Surprisingly, we find that the driving mechanism for the slow evolution of the sample configuration are the experimentally unavoidable fluctuations of temperature, which induce intermittent local mechanical shears in the sample, due to thermal expansion and contraction. We find that the amplitude of both reversible and irreversible rearrangements provoked by the shear decreases with time, leading to aging.
The sample is a water-based mixture of surfactants and a block-copolymer, whose composition is given in ref. RamosPRL2001 . At the sample is fluid; above the increase of the hydrophobicity of one segment of the block-copolymer leads to the formation of polydisperse multilamellar vesicles, or onions equilibriumonions . All experiments are performed at temperature , where the onions are densely packed and no changes in the structure are observed with time. Previous linear rheology and dynamic light scattering experiments RamosPRL2001 ; RamosPRL2005 have shown that this system displays a slow dynamics whose characteristic timescale increases with time after a transition from the fluid to the gel-like phase (“aging”).

The sample is loaded at in a glass capillary of length a few cm and rectangular cross-section (), which is flame-sealed to prevent evaporation. Centrifugation is used to confine the air bubble left after filling at one end of the capillary. The sample is then placed in an oven (Instec) that sets the temperature to ( is measured on the capillary in the close vicinity of the sample). The standard deviation of over 1 day is . Age is defined as the time at which has reached . A microscope equipped with a 10x objective is used to image the onions between crossed polarizers (see the inset of Fig. 1). The field of view is and is located in a horizontal plane in the center of the capillary. Images are taken every sec for about hours and analyzed with the Image Correlation Velocimetry method PIV to quantify the time evolution of the (coarse-grained) displacement field. Each image is divided into regions of interest (ROIs) corresponding to in the sample and the displacement (i. e. translational motion) of each ROI for pairs of images taken at time and is measured with an accuracy of 50 nm NotePIV .
We first discuss the relative displacement, defined as , where denotes an instantaneous spatial average over all ROIs. We calculate the mean-squared relative displacements (MSDs) and , where the subscript has been dropped for simplicity and and refer to the two horizontal components of , parallel and perpendicular to the long axis of the capillary, respectively. denotes a time average over a window of sec centered around . We find that the motion is strongly anisotropic, with the parallel displacement typically one order of magnitude larger than the perpendicular one; therefore, in the following we focus on the parallel motion that dominates the dynamics. Figure 1 shows the parallel MSD as a function of the lag , for three ages (open symbols). Three distinct regimes are observed: a first rapid increase of the MSD with at short lags, an almost flat plateau at intermediate lags, extending over about two orders of magnitude in , and a long-lag regime where the MSD increases strongly with . Moreover, the dynamics slows down with age, as revealed by the decrease of the MSD with at all lags.
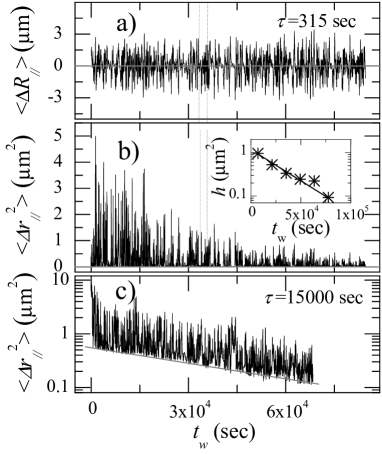
To get insight in the physical mechanisms at the origin of this slow dynamics, we examine time-resolved quantities. The two-time squared relative displacement, , exhibits strong fluctuations with , with intermittent peaks of high amplitude. This is shown, for sec, in fig. 2a for a short time window and in fig. 3b for the whole duration of the experiment (this lag corresponds to the plateau of the MSD, see fig. 1). A visual inspection of the movie of the sample motion suggests that the fluctuations of the relative displacement are associated with those of the global displacement, , and that the latter are of the same order of magnitude as the former. The movie shows also a large drift during the initial temperature jump, due to the thermal expansion of the sample. This suggests that the fluctuations of recorded once a constant temperature is reached may be due to small fluctuations of , which are experimentally unavoidable. Indeed, a raise (decrease) of would induce an expansion (contraction) of the sample. Because the material is confined, it would deform essentially perpendicular to the free interface. Hence, the expansion/contraction of the sample is expected to be uniaxial, resulting mostly in a global displacement in the direction, as observed experimentally.
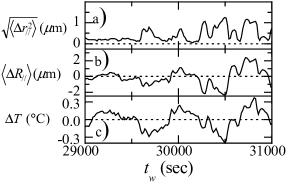
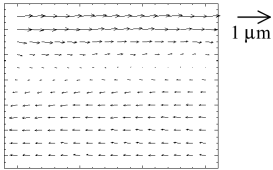
To test this hypothesis, we show in fig. 2c the variation of over a lag , defined as , and we compare it to (fig. 2a) and (fig. 2b). Clearly, whenever increases or decreases so does . Similarly, any peak in the relative mean squared displacement (positive by definition) corresponds to a (positive or negative) fluctuation of . Note that the time-averaged value of the global displacement is (see fig. 3a), consistently with the fact that there is no net drift of . The similarity between the different signals shown in fig. 2 can be quantified by calculating their linear correlation coefficient, , which ranges from 0 to 1. For the pair , and for all ages and all lags, we find demonstrating a strong correlation between the fluctuations of the global displacement field and those of the temperature. A significant correlation, although with a lower value , is also found between and , suggesting that the larger the global displacement field, the more spatially heterogeneous the deformation. This heterogeneity is in contrast to what may be expected for simple fluids or diluted suspensions. It is likely to stem from local variations of the viscoelastic properties of the sample, due to its jammed nature, and to the curvature of the meniscus at the sample-air interface. For lags corresponding to the MSD plateau, the relative displacement field most often corresponds to a shear in the direction, as shown in fig. 4. Note that the displacement field varies slowly: thus, the dynamics is strongly correlated in space and the shear, of order at most, is in the linear regime, as determined by a strain sweep at a frequency of Hz RamosPRL2001 . This long-range correlation is in contrast with the case of molecular glass formers and colloidal hard spheres, for which dynamical correlations extend over a few particles Donth2001 ; WeeksScience2000 .
To seek further support for the crucial role of the fluctuations of , we compare the macroscopic thermal expansion coefficient, , to that estimated from our observations. For the latter, one has , where cm is the length of the sample from the bubble-free capillary end to the position of the field of view and the length variation provoked by a temperature variation . By taking for and the standard deviation of and , respectively, and using the data for sec we find in good agreement with for water ThermalExpansionCoeff .
Temperature fluctuations are thus at the origin of the intermittent motion shown in figs. 3a,b, where peaks of correspond to large fluctuations of and hence of . Given the key role of temperature fluctuations, deeper insight on the evolution of the MSD shown in fig. 1 may be obtained by comparing the data to the analogous of the MSD for , . This quantity is plotted in fig. 1 as a solid line and displays remarkable analogies with the MSD. Similarly to the MSD, increases with until reaching a plateau for sec, a time scale of the order of the slowest fluctuations of . For , is on average monotonic. The relative MSD follows the evolution of and hence increases monotonically as well. By contrast, for time lags , the sample has been submitted to several fluctuations of , which have induced several shear deformations in the two opposite directions. On these time scales, this back and forth motion is virtually fully reversible and does not lead to a growth of the cumulated displacement; hence, a plateau is measured for the MSD. The reversible nature of the motion in this regime is further supported by the observation that the peaks of the two-time squared displacement shown in fig. 3b raise from a base line that is essentially zero, corresponding to pairs of images taken —by chance— at nearly the same . Thus, the initial growth of and the plateau are not due to the usual “rattling in the cage” mechanism, but rather to reversible shear deformations caused by temperature fluctuations. However, while saturates at the plateau value for all , a further increase of the MSD is observed at very large . This suggests that several expansion/contraction cycles imposed by the fluctuations of eventually trigger irreversible rearrangements, whose cumulated effect is responsible for the final growth of the MSD.
This picture is confirmed by the time evolution of calculated for a lag and shown in fig. 3c. Intermittent peaks similar to those of fig. 3b are observed, corresponding to the largest values of . In contrast with the data for shorter lags, however, the peaks in fig. 3c raise from a base line larger than zero (grey line). As discussed previously, the baseline corresponds to pairs of images taken at nearly the same , in the absence of any global displacements. A non-zero baseline confirms that the -induced shear deformations have led to irreversible rearrangements of the sample. This behavior is strongly reminiscent of that of colloidal systems submitted to a mechanical shear PineNature ; PineHebraudPRL ; PetekidisPRE2002 ; ViasnoffPRL2002 ; OzonPRE2003 or vibrated granular media granular . Although the microscopic mechanism responsible for rearrangements may vary (e.g. hydrodynamic interactions play a major role in PineNature ; PetekidisPRE2002 ), the general picture is the same: shear deformations lead to irreversible rearrangements. In our experiments no mechanical shear is imposed; remarkably, however, the small strain due to temperature fluctuations is sufficient to induce irreversible rearrangements on very long time scales.
At a given age, the height of the baseline shown in fig. 3c provides a direct measurement of the relative mean squared displacement for sec when only irreversible rearrangements are taken into account. We calculate the irreversible mean squared displacement, , by analyzing in a similar way data at a variety of time lags, and show in fig. 1 the result for sec (star symbols). Remarkably, we find over about two orders of magnitude in , with , thus indicating that the irreversible motion is close to ballistic, for which . We stress that a similar ballistic motion has been invoked to explain the slow dynamics in a variety of soft glassy materials probed by light and X-photon scattering techniques Faraday03 ; RamosPRL2001 ; BandyopadhyayPRL2004 , including the very same samples described here.
With age, the change in configuration corresponding to both the reversible and the irreversible rearrangements diminishes: this is demonstrated by the decrease of the height of the peaks of with (figs. 3b,c), as well as by the negative slope of the base line of measured at long lags (fig. 3c). We find that the amplitude of both reversible and irreversible rearrangements decays exponentially with sample age, with roughly the same characteristic time : independently of , sec for irreversible (reversible) rearrangements. For irreversible rearrangements, is obtained from the slope of the base line in a log-lin representation of vs , as in fig. 3c. For reversible rearrangements, we divide the data in 6 time windows and plot the average height, , of the top 25% largest peaks of each window as a function of (see inset of fig. 3b); is then obtained by fitting an exponential decay to NotePercentage . A similar exponential aging has been observed for other soft glasses Faraday03 ; AbouPRE2001 ; it may be explained by assuming , where is the number of irreversible rearrangements per unit time, occurring in “weak sites”. These sites correspond to the regions that are initially most unstable mechanically and are more likely to be relaxed by a rearrangement. We further assume , with the probability of rearrangement per unit time (dictated by the fluctuations of temperature and thus independent of age) and the number of weak sites not yet rearranged. The temporal evolution of obeys and hence , thus explaining the exponential decay of the irreversible mean square displacement. We cannot exclude that new weak sites are created, however, in the time window we probe, the dynamics is dominated by the relaxation process. Note that the amplitude of the deformation field due to a temperature-induced expansion or contraction is likely to be larger the more numerous the weak zones still to be relaxed. Thus, the evolution of would also explain the exponential decay of that parallels that of .
As a final remark, we note that the behavior reported in this work should be relevant to other closely packed soft systems, such as concentrated emulsions or surfactant phases and swollen polymer spheres or star polymers, where elasticity prevails over dissipation. Indeed, fluctuations in most typical experiments on soft materials are comparable to those reported here and would lead to similar strains, since the thermal expansion coefficient of water- or organic solvent-based systems is of the same order of magnitude.
We thank W. Kob, L. Berthier, and E. Pitard for discussions. This work was supported in part by the European MCRTN “Arrested matter” (MRTN-CT-2003-504712) and NoE “SoftComp“ (NMP3-CT-2004-502235), and by CNES (03/CNES/4800000123) and the Ministère de la Recherche (ACI JC2076). L.C. is a junior member of the Institut Universitaire de France.
References
- (1) E. Donth, The Glass Transition (Springer, Berlin, 2001).
- (2) W. van Megen et al. Phys. Rev. E 58, 6073 (1998).
- (3) H. Gang et al., Phys. Rev. E 59, 715 (1999).
- (4) L. Cipelletti et al., Faraday Discuss. 123, 237 (2003).
- (5) N. B. Simeonova and W. K. Kegel, Phys. Rev. Lett. 93, 035701 (2004).
- (6) B. Abou, D. Bonn and J. Meunier, Phys. Rev. E 64, 021510 (2001).
- (7) A. Knaebel et al., Europhys. Lett. 52, 73 (2000).
- (8) R. Bandyopadhyay et al. Phys. Rev. Lett. 93, 228302 (2004).
- (9) W. K. Kegel and A. van Blaaderen, Science 287, 290 (2000).
- (10) E. R. Weeks et al., Science 287, 627 (2000).
- (11) L. Cipelletti et al., J. Phys.: Condens. Matter 15, S257 (2003).
- (12) A. Duri et al., Phys. Rev. E 72, 051401 (2005).
- (13) V. Viasnoff and F. Lequeux, Phys. Rev. Lett. 89, 065701 (2002).
- (14) R. E. Courtland and E. R. Weeks, J. Phys.: Condens. Matter 15, S359 (2003).
- (15) L. Ramos and L. Cipelletti, Phys. Rev. Lett. 94, 158301 (2005).
- (16) P. Hébraud et al., Phys. Rev. Lett. 78, 4657 (1997).
- (17) G. Petekidis, A. Moussaïd and P. N. Pusey, Phys. Rev. E 66, 051402 (2002).
- (18) L. Ramos and L. Cipelletti, Phys. Rev. Lett. 87, 245503 (2001).
- (19) L. Ramos et al., Europhys. Lett. 66, 888 (2004).
- (20) P. T. Tokumaru and P. E. Dimotakis, Experiments in Fluids 19, 1 (1995).
- (21) This technique does not allow one to directly probe internal motions on a length scale smaller than the ROI size. By changing the ROI size, we have checked that the internal motion within ROIs is negligeable compared to the translational motions of the ROIs.
- (22) Recall that the onion phase is composed by % water.
- (23) D. J. Pine et al., Nature 438, 997 (2005).
- (24) F. Ozon et al., Phys. Rev. E 68, 032401 (2003).
- (25) E. R. Novak et al., Phys. Rev. E 57, 1971 (1998).
- (26) Similar results are obtained with other threshold values.