In-plane optical spectral weight transfer in optimally doped Bi2Sr2Ca2Cu3O10
Abstract
We examine the redistribution of the in-plane optical spectral weight in the normal and superconducting state in tri-layer Bi2Sr2Ca2Cu3O10 (Bi2223) near optimal doping ( = 110 K) on a single crystal via infrared reflectivity and spectroscopic ellipsometry. We report the temperature dependence of the low-frequency integrated spectral weight for different values of the cutoff energy . Two different model-independent analyses consistently show that for = 1 eV, which is below the charge transfer gap, increases below , implying the lowering of the kinetic energy of the holes. This is opposite to the BCS scenario, but it follows the same trend observed in the bi-layer compound Bi2Sr2CaCu2O8 (Bi2212). The size of this effect is larger in Bi2223 than in Bi2212, approximately scaling with the critical temperature. In the normal state, the temperature dependence of is close to up to 300 K.
I INTRODUCTION
The discussion as to what extent the superconductivity in high- cuprates can be understood as a BCS-like pairing-instability of a standard Fermi-liquid is open for almost two decades. The dominating role of the Coulomb interaction in the formation of the non-Fermi-liquid electronic state in the underdoped region of the phase diagram questions the ability of the BCS theory, where these interactions are treated only as a perturbation, to universally explain the mechanism of superconductivity in the high- cuprates. The pseudogap WalstedtScience90 ; NormanNature93 ; PuchkovJPCM96 , and the d-wave symmetry of the superconducting gap HarlingenRMP95 are difficult to understand in terms of the standard BCS mechanism based on the electron-phonon interaction. Another indication for an unconventional pairing mechanism came from the experimental temperature dependence of the low energy spectral weight of optimally doped and underdoped Bi2212MolegraafScience02 ; SantanderEPL03 , which behaves opposite to the prediction from BCS theoryMarelKluwer03 . On the other hand, it has been shown that in the overdoped region of the phase diagram the system has a more conventional Fermi-liquid behaviorProustPRL02 ; YusofPRL02 ; JunodPC99 ; DeutscherPRB05 . In a conventional superconductor, the internal energy is lowered as the net result of a decrease of the charge carrier interaction energy and a smaller increase of their kinetic energy. Several alternative models have been proposed for the pairing mechanism of high cuprates AndersonScience87 ; AndersonJPCM87 ; HirschPC92 , many of them predict a decrease of kinetic energy in the superconducting state AndersonScience87 ; AndersonJPCM87 ; HirschPC92 ; EcklPRB03 ; WrobelJPCM03 . This issue can be addressed by optical techniquesMolegraafScience02 ; SantanderEPL03 , taking advantage of the relation between the intraband spectral weight and the energy momentum dispersion of the conduction electrons MaldaguePRB77
| (1) |
where is the real part of the optical conductivity, is a cutoff frequency, is the in-plane lattice constant, is the volume of the unit cell, and . In the superconducting state, the integration must include the -peak at zero frequency due to the condensate. In the nearest neighbor tight-binding approximation is exactly the kinetic energy of the conduction band electrons, but even in the next nearest neighbor model with (where and are the nearest neighbor and the next nearest neighbor hopping parameters respectively) the kinetic energy and are approximately equal and they follow the same trends as a function of temperature MarelKluwer03 . In this case the lowering of implies an increase of the electronic kinetic energy and vice-versa. The value of has to be chosen as to cut off the region of the interband transitions. In the presence of strong electron correlations the intraband energy region becomes very broad as it includes the high-frequency peaks due to the electronic transitions leading to the double occupancy. Recently Wrobel et al. WrobelJPCM03 pointed out that is representative of the kinetic energy within the t-J model, if is chosen between the values of exchange integral 0.1 eV and hopping 0.4 eV, while it corresponds to the kinetic energy of the Hubbard model when the cutoff energy is above 2 eV.
In this paper we experimentally address these issues by analysing infrared and optical spectra of the tri-layer compound Bi2223. This material has an advantage of a very high transition temperature (about 110 K), resulting in a large superconductivity-induced change of the optical conductivity, and a high-quality cleaved optical surface. Furthermore, it belongs to the same homologic family as the much more extensively studied bi-layer Bi2212, making it suitable for a comparative study of the spectral weight transfer in materials with different numbers of CuO2 planes per unit cell. Given the theoretical implications related to the choice of the cut-off frequency we present the temperature dependence of for different relevant values of .
While the physical meaning of the temperature dependent W() is a matter of theoretical interpretations, it can be, in fact, experimentally determined without model assumptions. The latter is non-trivial, since the integration in Eq.1 requires, at first glance, the knowledge of down to zero frequency and a separate determination of the superfluid density. Fortunately, an additional information about the real part of the dielectric function , which is independently obtained from ellipsometry as well as reflectivity measurement (since reflectivity depends on both and ), allows one to determine accurately and its temperature dependence without low-frequency data extrapolations. Although this point was emphasized in our previous publicationsMolegraafScience02 ; KuzmenkoPRB05 , we reiterate in this article the details of the experimental determination of due to its topmost experimental importance. Two different numerical approaches were used which gave us consistent results: (i) the calculation of at each temperature and (ii) the temperature-modulation analysis of superconductivity induced changes of the optical propertiesKuzmenkoPRB05 .
II EXPERIMENT AND RESULTS
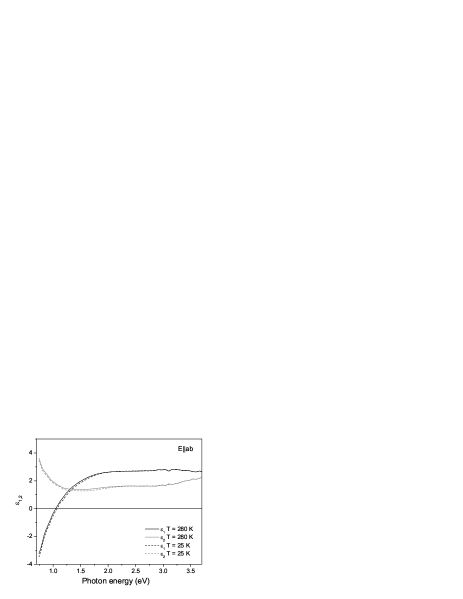
Two large single crystals of Bi2Sr2Ca2Cu3O10 with = 110 K and transition width 1 K were prepared as described in Ref. GianniniSST04, . The samples had dimensions () of mm3 and of mm3 respectively. The first crystal has been used to measure the in-plane optical properties and was cleaved within minutes before being inserted into the cryostat. We measured the normal-incidence reflectivity from 100 and 7000 cm-1 (12.5 meV - 0.87 eV) using a Fourier transform spectrometer, evaporating gold in situ on the crystal surface as a reference. The reflectivity curves for selected temperatures are displayed in Fig. 1. The ellipsometric measurements were made on the same sample surface in the frequency range between 6000 and 36000 cm-1 (0.75 - 4.5 eV) at an angle of incidence of 74∘. The ellipsometrically measured pseudo-dielectric function was numerically corrected for the admixture of the c-axis component which provided the true ab-plane dielectric function, whose real and imaginary parts are shown in Fig. 2. The c-axis dielectric function that is required for this correction was measured independently on the ac-oriented surface of the second crystal as described in the Appendix. It is shown in Fig. 3.

The superconductivity induced changes of the optical properties at photon energies above the superconducting gap (in the mid-infrared and higher frequencies), are rather small but their reliable detection is crucial to determine to correct sign and magnitude of the spectral weight transfer. We used home-made optical cryostats, whose special design preserves the sample alignment during thermal cycling. In the visible - ultraviolet (UV) region, in order to avoid spurious temperature dependencies of the optical constants due to adsorbed gases at the sample surface, an ultra high vacuum cryostat was used, operating at a pressure in the mbar range. All data were acquired in the regime of continuous temperature scans at a rate of about 1 K/minute between 20 K and 300 K with a resolution of 1 K. The signal to noise ratio of the temperature dependent reflectivity in the mid-infrared is about 2000.

In order to obtain the optical conductivity in the infrared region we used a variational routine KuzmenkoRSI05 yielding the Kramers-Kronig consistent dielectric function which reproduces all the fine details of the infrared reflectivity spectra while simultaneously fitting to the ellipsometrically measured complex dielectric function in the visible and UV-range. In contrast to the ”conventional” KK reflectivity transformation this procedure anchors the phase of the complex reflectivity to the one at high energies measured directly with ellipsometryBozovicPRB90 .
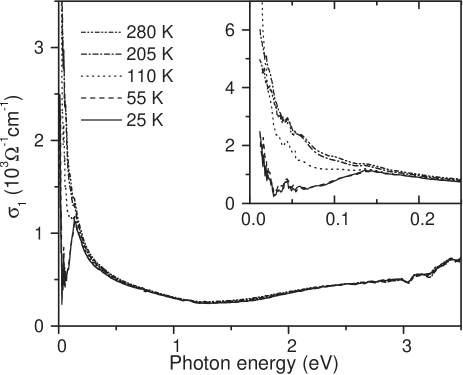
In Fig. 4 we show the optical conductivity at selected temperatures. The spectral and temperature dependence of of Bi2223 is very similar to the one of Bi2212QuijadaPRB99 ; MolegraafScience02 , although the conductivity of Bi2223 is slightly larger, likely due to a higher volume density of the CuO2 planes in the tri-layer compound. The strongest changes as a function of temperature occur at low frequencies. In the normal state the dominant trend is the narrowing of the Drude peak. The onset of superconductivity is marked by the opening of the superconducting gap which suppresses below about 120-140 meV, slightly higher than in Bi2212. Such a large scale is apparently caused by a large gap value in Bi2223, which amounts up to 60 meV, as shown by tunnelling measurements KuglerJMMM05 .
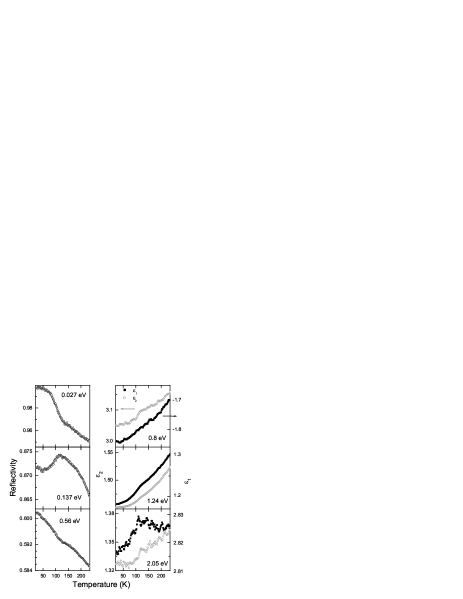
The much smaller absolute conductivity changes at higher energies, which are not discernible at this scale, can be better seen in Fig. 5 where we show the temperature dependent optical constants taken at selected photon energies. The change induced by superconductivity in the optical constant is clearly visible as a kink at for energies up to at least 2 eV, which tells that the energy range where the redistribution of spectral weight takes place is very large.
III Integrated spectral weight
III.1 Experimental determination of
The extraction of the spectral weight from the measured spectra is a delicate issue. Formally, one has to integrate the optical conductivity over a broad frequency range, including the region below the low-frequency experimental cutoff (in our case about 100 cm-1) containing the condensate -peak (below ) at and a narrow quasiparticle peak. According to a frequently occurring misconception the existence of such a cutoff inhibits the calculation of this integral. Indeed if only the real part of the optical conductivity in some finite frequency interval was available, clearly an essential piece of information needed to calculate would be missing, namely below . However, due to the fact that the real and imaginary part of the dielectric constant are related non-locally via the Kramers-Kronig transformation, any change in one of them will affect the other in a broad region of the spectrum. In particular, any change of below must influence at higher frequencies. Since the latter is measured independently (directly by the ellipsometry above 0.75 eV cm-1 and indirectly via the reflectivity in the infrared), it puts constraints on the possible values of below and . Obviously, these constraints are going to be the more tight the more accurately the optical constants are determined in the accessible interval.
According to the KK relation
| (2) |
the leading contribution of below to above is proportional to the integral whereas is much less sensitive to the spectral details of below BozovicPRB90 ; KuzmenkoPRB05 . For example, the contributions of the superfluid condensate and of a narrow quasiparticle peak (provided that its width ) to (and thus to the reflectivity) at high frequencies are almost indistinguishable. Therefore the value of the integral of can be model-independently determined from our experimental data, while resolving the details of below 100 cm-1, for example the separation of the superfluid density and quasiparticle spectral weight, is not possible.
In practice, the realization of the extra bounds on the value of using the additional information contained in the real part of the dielectric function can be done via the aforementioned procedure of variational Kramers-Kronig constrained fittingKuzmenkoRSI05 . Essentially, this is a modeling of the data with a very large number of narrow oscillators, which are added to the model dielectric function until all the fine details of the measured spectra are reproduced. Importantly, the model function always satisfies the KK relations. Once a satisfactory fit of both reflectivity in the infrared region and and above 0.75 eV is obtained, we use the integral of generated analytically by this multi-oscillator model as an estimate of the spectral weight. Since the number of oscillators is very large and their parameters are all automatically adjustable, this procedure is essentially model independent. The spectral weight as a function of temperature is shown in Fig. 6, for different cut off frequencies.

In order to illustrate that the measured spectra can indeed anchor the value of the low frequency spectral weight without the need of the low-frequency extrapolations of reflectivity (as it would be the case in the conventional KK transform of reflectivity), we performed the following numerical test. In the superconducting state, the model contains a narrow oscillator centered at zero frequency which accounts for the spectral weight of the condensate and a narrow quasiparticle peak. We artificially displaced this oscillator from the origin to a finite frequency, yet below . The least mean square routine then readjusted all the other parameters in order to produce a new best fit. After that the overall fitting quality (the mean-squared error ) and the low frequency spectral weight remained almost unchanged with respect to the initial values, which is indicated by the errorbar in Fig. 7, while the reflectivity below 100 cm-1 now shows a very different behavior, as it is shown in Fig. 8. This demonstrates that the details of and below 100 cm-1 are not essential for the determination of ).
III.2 Temperature dependent redistribution of spectral weight
It is important to establish the relevant cutoff energy in the spectral weight integral. The optical conductivity of Bi2223 (see Fig.4) as well as the one of Bi2212QuijadaPRB99 ; MolegraafScience02 shows a minimum around 1 eV separating the Drude peak from the lowest-energy interband transition, which is believed to be a charge transfer excitation. It is interesting that such a separation is even more pronounced if we plot the difference between conductivity spectra at and a high temperature: (see upper panel of Fig. 9). A sharp upturn below 20 meV, a dip at around 50 meV and a slow approaching of this difference to zero (while being negative) as the energy increases can be attributed to the narrowing of the Drude peak KuzmenkoPRB05 . However, above the same characteristic energy of about 1 eV this monotonic trend totally disappears. Instead, shows a dip at 1.5-2 eV, which corresponds to the removal of spectral weight from this region, as the system is cooled down. The difference between the two spectra in the superconducting state also shows that the effect of the narrowing of the Drude peak does not noticeably extend above 1 eV (Fig. 9).
We can learn more from the corresponding differences of the integrated spectral weight and which are displayed in the lower panel of Fig. 9. In order to separate the effect of the superconducting transition from the temperature dependence already present in the normal state, we additionally plot the ’normal-state corrected’ spectral weight difference of the superconducting state relative to the normal state calculated according to the procedure described in Section III.3. Not surprisingly, all curves show an intense spectral structure below 0.3 eV as a result of strong changes of the shape of the Drude peak with temperature. However between 0.3-0.5 and 1.0-1.5 eV the spectral variation is weak and, importantly, both normal- and superconducting-state differences remain positive in this ’plateau’ region. This indicates an increase of the intraband spectral weight as the sample is cooled down and an extra increase in the superconducting state. Above 1.5-2 eV, the normal-state difference decreases rapidly and becomes negative, which suggests that spectral weight is transferred between the charge-transfer and the intraband regions. In contrast, the superconducting state differences (both normal-state corrected and not) continue decreasing slowly and remain positive up to at least 2.5 eV, which means that the Ferrell-Glover-Tinkham sum rule is not yet recovered at this energy.
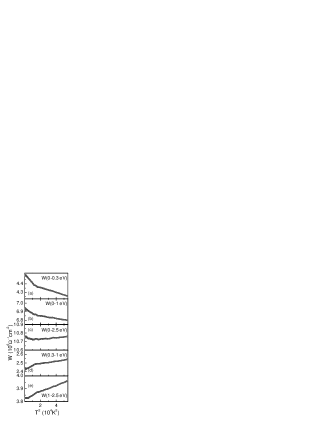
Another way to visualize the spectral weight transfer is to plot as a function of temperature for different cutoff energies. In Fig. 6(a-c) we present such curves for = 0.3, 1 and 2.5 eV.
One can immediately notice that the curves and , apart from different absolute values, have almost identical temperature dependencies; accordingly, the integrated spectral weight between 0.3 and 1 eV (Fig. 6d) shows a very little variation with temperature. This is, of course, a manifestation of the existence of the discussed above ’plateau’ region in the frequency dependent spectral weight differences (Fig. 9). This observation is in line with the theoretical findings of Wrobel et alWrobelJPCM03 who pointed out that spectral weight integrated to the hopping parameter 0.3-0.4 eV is representative of the kinetic energy of the t-J model.
Above , the spectral weight for the cutoff of 1 eV increases gradually with cooling down in a virtually fashion, which is most clearly seen when is plotted versus (Fig. 6a,b). A similar normal state behavior was observed in optimally and underdoped Bi2212MolegraafScience02 and in La2CuO4OrtolaniPRL05 . Although a term follows trivially from the Sommerfeld expansion for the temperature broadening of the Fermi-Dirac distribution, the absolute value of this term turns out to be several times larger than what one expects from this expansionBenfattoPRB05 ; ToschiPRL05 . The DMFT calculations within the Hubbard model ToschiPRL05 showed that this may be caused by strong correlation effects. On the other hand, it was recently pointed outKarakozovCM05 ; Benfatto06 that the temperature dependence of the one-electron spectral function due to inelastic electron-boson scattering contributes to the overall temperature dependence of the optical sum rule much stronger than the Sommerfeld term. The extra contribution though is predominantly -linear if the boson energy is smallBenfatto06 .
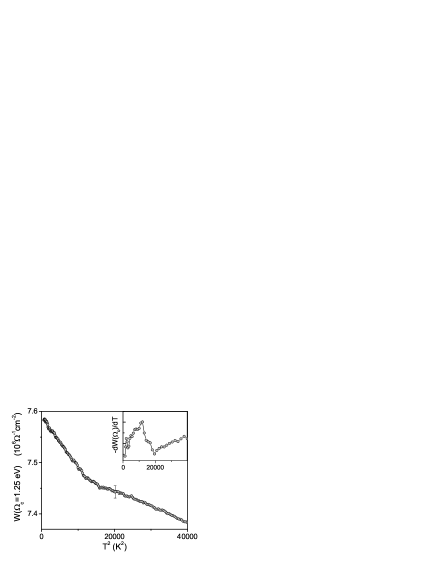
At the superconducting transition the curve shows a sharp upward kink (slope change) close to = 110 K. The same effect was observed in optimally and underdoped Bi2212 MolegraafScience02 . In order to directly compare these data to the results of Ref. MolegraafScience02, , we plot in Fig. 7 the for =1.25 eV together with the temperature derivative. One should stress that the corresponding kinks are already observed on the temperature dependence of directly measured optical constants (see Fig.5). By extrapolating the normal state trend to T = 0 K, we can estimate the size of the superconductivity induced spectral weight transfer in the intraband region: cm-2, which is about 1% of the total intraband spectral weight (as shown by Fig.6).
Remarkably, the upward kink of at is still observed for the cutoff of 2.5 eV (Fig. 6c) suggesting that superconductivity induced spectral weight transfer involves energies above the charge transfer gap, as we could already see from Fig. 9. In the context of the Hubbard model, the integrated spectral weight corresponds to the kinetic energy of the Hubbard hamiltonian WrobelJPCM03 when the cut off frequency is set much higher than the . One would be tempted conclude from the superconductivity-induced increase of W(2.5eV) that also the total kinetic energy of the Hubbard model is lowered below Tc, as observed in the cluster DMFT calculations MaierPRL04 . We stress, however, that in order to make a definitive statement about the kinetic energy in the Hubbard model one should extend the cutoff frequency much higher than 2.5 eV. Unfortunately, the noise level at higher energies precludes the observation of the small superconductivity-induced effects. Another problem is that this range overlaps with strong absorption range due to charge transfer from oxygen to copper and that those transitions may have temperature dependencies for a variety of reasons which are not related to the kinetic energy lowering of the charge carriers.

III.3 Temperature modulation analysis at
The existence of relatively sharp kinks (slope discontinuities) at on the curves of the temperature dependence of various optical functions (see Fig.5) enables an alternative way to quantify the superconductivity-induced spectral weight changes which gives perhaps a better feeling of the error bars involved KuzmenkoPRL03 . We recently applied this procedure, which is essentially a temperature-modulation method, to a similar set of data on optimally doped Bi2212 KuzmenkoPRB05 .
In order to separate the superconductivity-induced effect from the large temperature dependence in the normal state not related to the onset of superconductivity we apply the ’slope-difference operator’ defined as KuzmenkoPRL03 :
| (3) |
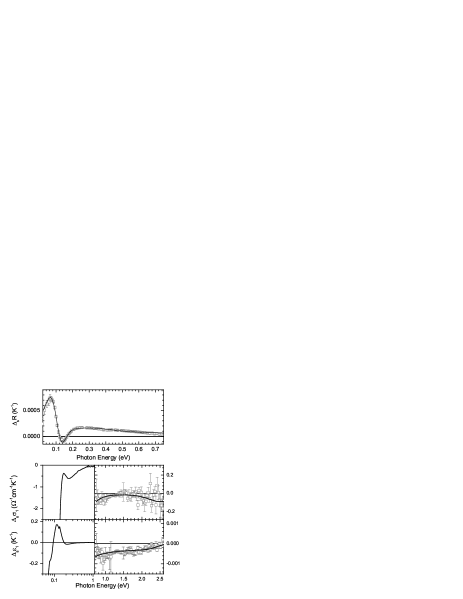
where stands for any temperature dependent function. In Fig.10 the slope-difference spectra , and are displayed with the error bars, which we determined from the temperature dependent curves such as shown in Fig.5, using a numerical procedure, described in Ref.KuzmenkoPRB05, . Since is a linear operator, the KK relation between and holds also for the slope-difference spectra and . Thus we can fit the latter spectra with a multi-oscillator Drude-Lorentz model, which automatically satisfies the KK relations. If the number of oscillators is large enough, the procedure becomes essentially model-independent. Using the same dielectric function we can additionally calculate the slope-difference spectrum of reflectivity as it is related to and :
| (4) |
The functions and can be derived from the analysis of optical spectra at KuzmenkoPRB05 .
The best fit of the slope-difference optical constants for Bi2223 is shown by the solid curves in Fig.10. From this we also calculate the slope-difference integrated spectral weight as shown in Fig.10(a). At = 1 eV we obtain the value of +1100 cm-2K-1 which corresponds to the superconductivity-induced increase of spectral weight, in agreement with the previous analysis.
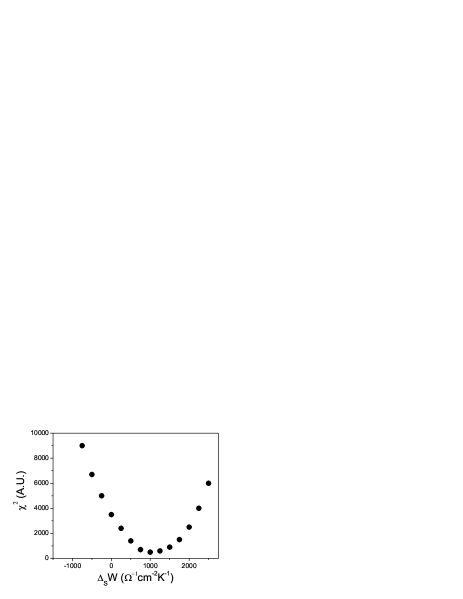
To check that the value of is well defined by the present set of experimental spectra we repeated the fitting routine while forcing to be equal to some imposed value . We did this for different values of and monitored the quality of the fit, as expressed by the mean-squared error . In Fig. 11 we plot as a function of . The best fit quality is, of course, achieved for the mentioned value cm-2K-1. It is evident that the fit quality deteriorates rapidly as is dragged away from this value. For example, the value of for the case = 0 (which would be the full recovery of the sum rule at 1 eV) is about 10 times larger than the optimal value; the corresponding data fit should be regarded as unacceptable. As it was discussed in Ref.KuzmenkoPRB05, and in this paper, this is due to the fact that any change of the low-frequency spectral weight inevitably affects the value of and at higher frequencies.
To compare the approach described in this Section and the one from previous Section, we derive from the curve , plotted in Fig. 6 (=1 eV) 1500 cm-2K-1. This is not far from the aforementioned value of 1100 cm-2K-1 which quantitatively confirms the central assertion of this paper, namely that the low frequency spectral weight increases below .
As it was discussed in Ref.KuzmenkoPRB05, , the ’normal-state corrected’ spectral weight difference of the superconducting state relative to the normal state, can be estimated from the slope-difference conductivity spectra:
| (5) |
where is a dimensionless coefficient. The choice of is suggested by the temperature dependence of KuzmenkoPRB05 . Since we observe in both normal and superconducting state a temperature dependence close to then we choose . The corresponding curve is shown as a dotted line in Fig.9. One can see that it is slightly smaller than the direct difference . The latter fact is not surprising since the spectral weight in the normal state is increasing as a function of temperature.
IV Discussion and conclusions
The superconductivity-induced increase of low-frequency spectral weight, which implies the opposite to the BCS type lowering of the electronic kinetic energy, was previously observed in the under-doped and optimally doped bi-layer Bi2Sr2CaCu2O8 MolegraafScience02 ; SantanderEPL03 ; KuzmenkoPRB05 . Recent studiesDeutscherPRB05 ; CarboneDopDep show that this effect changes sign for strongly overdoped samples of the Bi2212, following the trend of the BCS model. A temperature dependence of the low energy spectral weight in accordance to BCS theory has also been claimed for optimally doped YBa2Cu3O7-δ and slightly underdoped Bi2212BorisScience04 , although the latter result is controversialKuzmenkoPRB05 ; SantanderCM05 . Hence the ’unconventional’ superconductivity induced increase of low energy spectral weight appears to be a property characteristic of the Bi-based multi-layer cuprates at and below optimal doping, but not of the entire cuprate family for all doping levels.
Recently an intriguing connection has been pointed out between the superconductivity induced increase of on the one hand, and the drop of scattering rate on the other hand MarsiglioPRB06 . Since the former involves a spectral weight integral over 1 eV, whereas the latter is measured at microwave frequencies, these two experimental observations are seemingly unrelated. However, decreasing the scattering results in sharpening of the occupation distribution in -space. Hence a decrease of scattering automatically implies a decrease of the average kinetic energy, which in turn is observed as an increased when the sample turns from normal to superconducting. Since the standard BCS model (without a change in scattering) already predicts a superconductivity induced increase of the kinetic energy, the net result of both effects (scattering change and intrinsic BCS effect) will depend on the relative magnitude of these two effects. This explanation successfully relates two classes of experiments, without directly relating either one of these experiments to a particular pairing mechanism. The starting assumption of an anomalous drop in scattering is at this stage a phenomenological one, and still requires a microscopic explanation.
We observe that the increase of spectral weight below in Bi2223 is larger than in Bi2212MolegraafScience02 . We believe that this can be quite generally understood. It is well known that in the BCS theory
| (6) |
The first equality holds generally for situations where the electronic occupation numbers are redistributed in an energy range around , whereas the second is suggested simply by a dimensional analysis. Recent STM studies KuglerJMMM05 evidence that the SC gap is indeed larger in Bi2223 than in Bi2212 at a similar doping level. Assuming that Eq. (6) is also valid in Bi2212 and Bi2223 at optimal doping, and Eq. (1) is exact, we obtain . This ratio value matches the experimental observation, supporting the idea that the spectral weight transfer is intimately related to the SC-induced redistribution of the occupation numbers.
In summary, we have observed a superconductivity-induced increase of the in-plane low-frequency optical spectral weight in tri-layer Bi2Sr2Ca2Cu3O10 near optimal doping from the reflectivity and ellipsometric measurements. Comparison to the case of optimally doped Bi2212 suggests that the size of the spectral weight transfer scales with the value of the critical temperature. In the normal state, the temperature dependence of the is essentially proportional to .
ACKNOWLEDGMENTS
We are grateful to F. Marsiglio, T. Timusk, N. Bontemps, A.F. Santander-Syro, J. Orenstein, and C. Bernhard for stimulating discussions and A. Piriou for technical assistance. This work was supported by the Swiss National Science Foundation through the National Center of Competence in Research ”Materials with Novel Electronic Properties-MaNEP”.
V APPENDIX
V.1 Determination of the c-axis dielectric function
In order to properly convert the pseudodielectric function measured ellipsometrically on the ab-crystal surface to the true dielectric function along the ab-plane, we additionally measured the c-axis dielectric function using another crystal of Bi2223 grown under the same conditions.
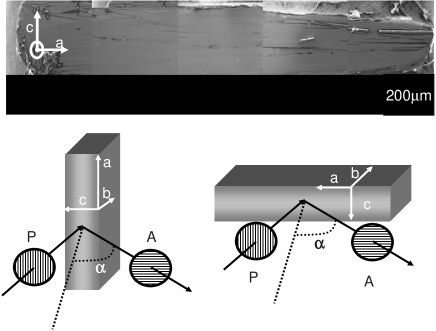
We did spectroscopic ellipsometry from 6000 and 36000 cm-1 on an ac surface of dimensions () 30.8 mm2 which we cut and polished with a diamond paper of 0.1 m grain size. The surface image is shown in Fig. 12. Two orthogonal orientations of the sample were used, designated as (ac) and (ca), as shown in Fig.12 which provided four ellipsometric parameters at each frequency. Assuming that we inverted four corresponding expressions based on the Fresnel equations in order to obtain four unknown variables , , . We applied this procedure for three angles of incidence 65∘, 70∘ and 75∘ simultaneously in order to improve the accuracy of the inversion.
We also measured the normal incidence reflectivity between 450 and 8000 cm-1 on the same crystal plane for the electric field parallel to the c-axis. This measurement agrees well with the ellipsometrically determined , which confirms the validity of the described inversion procedure. Finally, the reflectivity and ellipsometry output were all fitted simultaneously with a variational KK consistent function KuzmenkoRSI05 in order to extend the frequency dependence of down to 450 cm-1 while anchoring the unknown phase of the reflectivity by the ellipsometric data.
The c-axis reflectivity , optical conductivity and the real part of the dielectric function are displayed in Fig. 3. We observe a weak wavelength dependence for , which is in a good agreement with with a previous report by Petit et al PetitEPJB02 . However, we found a rather different which is likely due to the fact in that in Ref.PetitEPJB02, the reflectivity was measured on a textured polycrystalline sample of Bi2223 and the conductivity was obtained by a conventional Kramers-Kronig transform. As it was pointed in Ref.PetitEPJB02, , the misalignment of the grains of the oriented ceramic can have a considerable impact on the final result. The main advance compared to these earlier results is that our samples were single crystals, and we determined the real and imaginary part of the dielectric tensor in a direct way using ellipsometry, without the need of a Kramers-Kronig transformation.
V.2 The sensitivity of the in-plane dielectric function to the c-axis correction
The pseudodielectric function measured on the ab oriented crystal surface depends on both components of the dielectric tensor and the angle of incidence : . It was shown by AspnesAspnesJOSA80 that in this case the pseudodielectric function should be much more sensitive to the ab-plane component, which lies along the crossing line of the plane of incidence and the sample surface, than to the c-axis one. In order to verify that this is the case, we show in Fig. 13 the ”sensitivity functions” and calculated for the actual angle of incidence (in our case 74∘) on the base of described above ac-plane ellipsometry results.
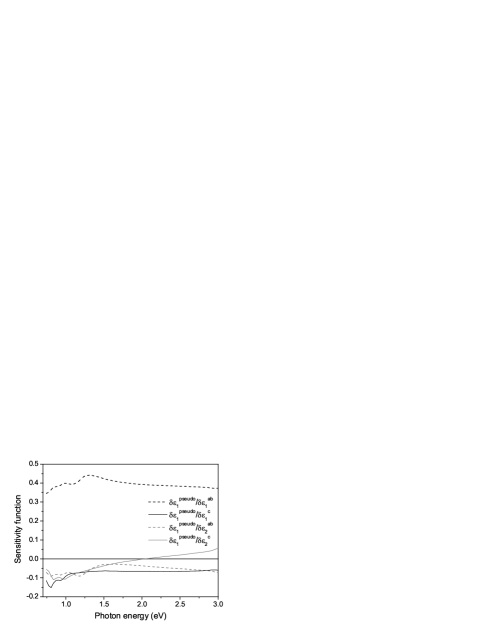
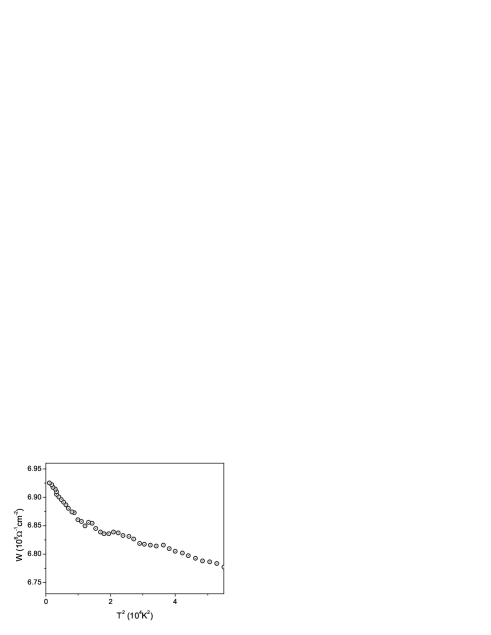
One can see that the pseudodielectric function is indeed much less sensitive to the c-axis component since is about 4-5 times smaller than . For this reason, the temperature dependence of the c-axis dielectric function is expected to have only a minor effect on that of the measured pseudodielectric function. In order to verify this, we performed the c-axis correction of the ab-plane pseudodielectric function and calculated the spectral weight integral ) using in the first case the temperature dependent c-axis dielectric function and in the second case a constant, temperature-averaged one. The resulting temperature dependence of ) in the former case is shown in Fig. 14, while the one in the latter case is shown in Fig.6. One can see that accounting for the temperature dependence of the c-axis dielectric function does not have any significant influence on temperature dependence of ), except for a stronger scatter of the datapoints as a result of the inevitable noise introduced by extra measurement on a small crystal surface. Therefore we used the temperature averaged c-axis data to correct the ab-plane pseudodielectric function in the main part of this paper.
References
- (1) R.E. Walstedt, Jr and W.W. Warren, Science 248, 1082 (1990).
- (2) M.R. Norman et al. Nature 392, 56 (1993).
- (3) A.V. Puchkov, D.N. Basov, and T. Timusk, J. Phys.: Condens. Matter 8, 10049 (1996).
- (4) D.J. Van Harlingen, Rev. Mod. Phys. 67, 515 (1995).
- (5) H. J. A. Molegraaf, C. Presura, D. van der Marel, P. H. Kes, and M. Li, Science 295, 2239 (2002).
- (6) A. F. Santander-Syro, R. P. S. M. Lobo, N. Bontemps, Z. Konstatinovic, Z. Z. Li, and H. Raffy, Europhys. Lett. 62, 568 (2003).
- (7) D. van der Marel, H. J. A. Molegraaf, C. Presura, and I. Santoso, in Concepts in electron correlation, edited by A. Hewson and V. Zlatic, Kluwer (2003); cond-mat/0302169.
- (8) C. Proust, E. Boaknin, R.W. Hill, L. Taillefer and A.P. Mackenzie, Phys. Rev. Lett. 89, 147003 (2002).
- (9) Z.M. Yusof, B.O. Wells, T. Valla, A.V. Fedorov, P.D. Johnson, Q. Li, C. Kendziora, Sha Jian, and D. G. Hinks, Phys. Rev. Lett. 88, 167006 (2002).
- (10) A. Junod, A. Erb, and C. Renner, Physica C 317, 333 (1999).
- (11) G. Deutscher, A.F. Santander-Syro, and N. Bontemps, Phys. Rev. B 72, 092504 (2005).
- (12) P.W. Anderson, Science 235, 1196 (1987).
- (13) P.W. Anderson, P.A. Lee, M. Randeria, T.M. Rice, N. Trivedi, and F.C. Zhang, J. Phys.: Condens. Matter 16, R755 (2004).
- (14) J.E. Hirsch, Physica C 201, 347 (1992).
- (15) T. Eckl, W. Hanke and E. Arrigoni, Phys. Rev. B 68, 014505 (2003).
- (16) P. Wrobel, R. Eder, and P. Fulde, J. Phys.: Condend. Matter 15, 6599 (2003).
- (17) P.F. Maldague, Phys. Rev. B 16, 2437 (1977).
- (18) A.B. Kuzmenko, H.J.A. Molegraaf, F. Carbone and D. van der Marel, Phys. Rev. B, 72, 144503 (2005).
- (19) E. Giannini, V. Garnier, R. Gladyshevskii, and R. Fl kiger, Supercond. Sci. Technol. 17, 220 (2004).
- (20) A.B. Kuzmenko, Rev. Sci. Instrum. 76, 083108 (2005).
- (21) I. Bozovic, Phys. Rev. B 42, 1969 (1990).
- (22) M.A. Quijada, D.B. Tanner, R.J. Kelley, M. Onellion, H. Berger, and G. Margaritondo, Phys Rev B 60, 14917 (1999).
- (23) M. Kugler et al. J. Phys. Chem. Solids, in press.
- (24) M. Ortolani, P. Calvani, and S. Lupi, Phys. Rev. Lett. 94, 067002 (2005).
- (25) L. Benfatto, S.G. Sharapov, N. Andrenacci, and H. Beck, Phys. Rev. B 71, 104511 (2005).
- (26) A. Toschi, M. Capone, M. Ortolani, P. Calvani, S. Lupi, and C. Castellani, Phys. Rev. Lett. 95, 097002 (2005).
- (27) A.E. Karakozov and E.G. Maksimov, cond-mat/0511185.
- (28) L. Benfatto, J.P.Carbotte, and F. Marsiglio, preprint.
- (29) Th. A. Maier, M. Jarrell, A. Macridin, and C. Slezak, Phys. Rev. Lett. 92, 027005 (2004).
- (30) A.B. Kuzmenko, N. Tombros, H.J.A. Molegraaf, M. Grüninger, D. van der Marel, and S. Uchida, Phys. Rev. Lett. 91, 037004 (2003).
- (31) F. Carbone, H.J.A. Molegraaf, A.B. Kuzmenko, V. Lukovac, E. van Heumen, E. Giannini, H. Berger, and D. van der Marel, to be published.
- (32) A.V. Boris, N.N. Kovaleva, O.V. Dolgov, T. Holden, C.T. Lin, B. Keimer, and C. Bernhard, Science 304, 708 (2004).
- (33) A. F. Santander-Syro and N. Bontemps, cond-mat/0503767.
- (34) F. Marsiglio, Phys. Rev. B 73, 064507 (2006).
- (35) N. Petit, V. Garnier, V. Ta Phuoc, R. Caillard, A.M. Frelin, A. Ruyter, I. Laffez, J.C. Soret, A. Maignan, F. Gervais, Eur. Phys. J. B 25, 423 (2002).
- (36) D.E. Aspnes, J. Opt. Soc. Am. 70, 1275 (1980).