Absence of long-ranged charge order in at x=0.08
Abstract
A periodic density of states (DOS) modulation (a “checkerboard pattern”) was observed with STM in (NCCOC) [T. Hanaguri et al., Nature 430, 1001 (2004)]. Its periodicity is the same as that of the “stripe” charge order observed with neutron scattering in (LBCO) [J. M. Tranquada et al., Nature 429, 534 (2004)] and (LNSCO) [J. M. Tranquada et al., Phys. Rev. B 54, 7489 (1996)]. An obvious question is whether the “stripes” are actually “checkers”. Unfortunately, because NCCOC samples are small and LBCO samples do not cleave, neutron and STM measurements cannot be carried out on the same system. To determine the relationship between stripes and checkers we used resonant soft x-ray scattering (RSXS), previously applied to LBCO [P. Abbamonte et al., Nature Physics 1, 155 (2005)], to study single crystals of NCCOC. No evidence was seen for a DOS modulation, indicating that the checkerboard effect is not directly related to the stripe modulation in LBCO. Our measurements suggest either glassy electronic behavior or the existence of a surface-nucleated phase transition in NCCOC [S. E. Brown et al., Phys. Rev. B 71, 224512 (2005)].
pacs:
74.25.Jb, 74.72.Jt, 78.70.Ck(NCCOC) is a high temperature superconductor with a crystal structure similar to that of (LSCO), however with the LaO layers replaced by CaCl layers. In particular, an apical chlorine atom in NCCOC is substituted for the apical oxygen in LSCO. The discovery of superconductivity in this compound was the original proof that high- superconductivity can occur in the absence of an apical breathing phonon. HKT1996 Because of the absence of apical oxygens the coupling between planes in NCCOC is decidedly weaker than in LSCO, making NCCOC electronically more two-dimensional and cleavable. KAYS2002 This latter trait has facilitated studies of NCCOC with optics and transport probes WKKS2004 , angle-resolved photoemission RSKS2002 , and scanning tunneling spectroscopy (STS) HLKL2004 ; KISH2004 .
A recent STS study of cleaved NCCOC has shown evidence for a “checkerboard” electronic superlattice with a period of unit cells. HLKL2004 ; KISH2004 The periodicity of this pattern is very close to that of the charge superlattice observed with neutron scattering in (LNSCO) TAIN1996 and (LBCO) TWPG2004 , which is frequently cited as evidence for charged stripes. Interestingly, NCCOC is by nature tetragonal at all temperatures and the “stripe” charge order only forms when LNSCO or LBCO are in the low temperature tetragonal phase. Because of the similarity in crystal structures and superlattice periods, these STS measurements have raised the question of whether NCCOC, LNSCO and LBCO contain the same phase and, in fact, are all checkerboards rather than stripes. Unfortunately, because LNSCO and LBCO do not cleave, and single crystals of NCCOC are extremely small (typically ), it is not possible to do both STS and neutron scattering on the same system to determine if these effects are related.
We recently reported a study of the charge order in LBCO with resonant soft x-ray scattering (RSXS) at the edge. PRSG2005 While RSXS cannot easily discriminate between stripe and checkerboard order, we were able to determine that the charge order in LBCO is mainly electronic and similar in amplitude to that claimed for NCCOC. NOTE1 RSXS can be performed on small samples as well as materials that do not cleave. To determine if the checkerboards in NCCOC are related to the charge order in LBCO, we have used soft x-ray absorption spectroscopy (XAS) and RSXS to characterize the electronic structure of NCCOC.
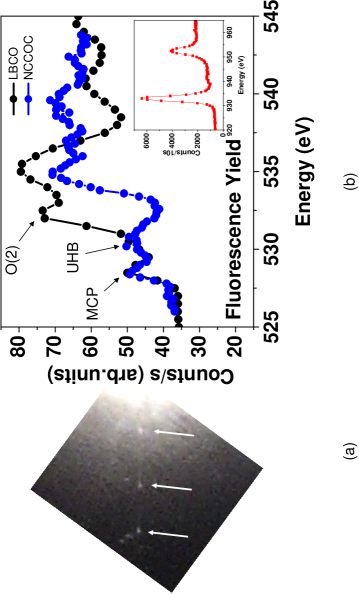
The NCCOC crystals were grown following preparation conditions described previously. KAYS2002 We investigated two batches, grown at and , with a doping at which charge order was previously reported HLKL2004 . NCCOC is extremely hygroscopic so sample mounting and handling was done in a nitrogen-filled glove box with . The crystals were oriented ex situ on a Laue diffractometer prior to x-ray measurements. To minimize exposure to air the crystals were covered with a thin polycarbonate foil and the exposure time limited to the minimum necessary for an unambiguous identification of the and axes. An example of a Laue image is shown in Fig. 1. Prolonged exposure to air causes these points to broaden into concentric arcs along a direction parallel to the arrows; the absence of arcs in Fig. 1 is indicative of good sample quality.
XAS and RSXS measurements were carried out on the X1B soft x-ray undulator beam line at the National Synchrotron Light Source with a ten-axis, ultrahigh vacuum-compatible diffractometer. The focus size was allowing investigation of moderately small samples. Measurements were typically done in a vacuum of . XAS measurements were made at room temperature and in fluorescence yield mode to assure bulk sensitivity. The checkerboard pattern has been observed in STM images up to ; therefore all RSXS measurements were done at , a temperature at which the charge order is stable. In the geometry used the probe depth was approximately for XAS and RSXS measurements.
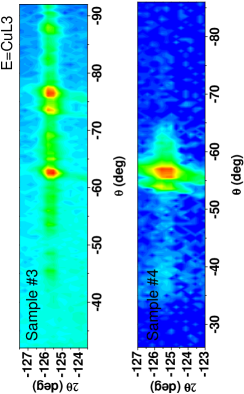
Prior to x-ray measurements the crystals were cleaved at room temperature in a vacuum and immediately transferred to the UHV chamber. Cleaving sometimes resulted in poor diffraction maps of the (002) Bragg reflection, indicating a highly corrugated near-surface region. Examples of good and bad cleaves are shown in Fig. 2. For good cleaves, however, the angular width of the (002) was resolution-limited. We denote reciprocal space in this article by Miller indices which indicate a momentum transfer with and .
Absorption spectra of NCCOC and LBCO with (from Ref. 9) are shown in Fig. 1. The NCCOC spectra are similar to previous studies of the closely related insulator HNK1998 , however with a pronounced mobile carrier peak (MCP) band and decreased upper Hubbard band (UHB). This indicates that spectral weight in the NCCOC system is transferred with doping from the UHB peak to the MCP peak, as in other cuprates CSMH1991 . It also indicates that our cleaved NCCOC surface is good within the probe depth of about .
When compared to LBCO, the most striking feature of NCCOC absorption spectrum is the absence of the peak labeled in Fig. 1. The tight-binding model DPP1989 ; M1990 ; HNK1998 is an useful framework to analyze these differences. This O(2) peak is absent in (SCO) ABR2004 , which also does not have apical oxygens, implying that the peak is due to hybridization of apical oxygen states. In addition, this peak was shown to be visible only for photon polarizations in CTKK1992 , which is consistent with it arising from apical oxygen levels polarized in the plane. In the tight-binding model apical oxygen states hybridize with a Cu d state or with La d states with an interaction energy of and in LBCO, respectively. DPP1989 ; M1990 In the first case, for hybridization, the energies of the mixed states are below the Fermi level. In contrast, because the energy of non-interacting La d levels are high above the Fermi energy, the energy of a mixed state is above the Fermi level, which is close to the measured value of the O(2) peak. We conclude that the most likely origin of the peak at in is La-O(2) hybridization and its absence is a signature of the reduced dimensionality of NCCOC.
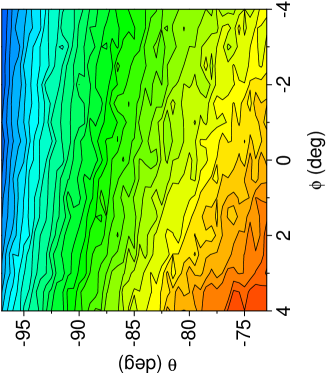
To study the charge order in NCCOC we tuned the x-ray energy to either the edge or mobile carrier peak CSMH1991 ; AVRS2002 and searched for superlattice reflections. Broad mesh scans in the and sample angles were performed around selected values of to allow for possible misalignment in the Laue images (see Fig. 3). The in-plane components of Q were determined from STS observations HLKL2004 , i.e. and . However, these measurements are two dimensional so do not suggest a particular value of . In hard x-ray and neutron scattering studies of LNSCO ZVNI1998 and LBCO T2005 , however, the charge order peaks are broad in , following a dependence. Based on these effects, three values for L were investigated: , and . For geometric reasons the first was done with the photon energy tuned to the mobile carrier peak AVRS2002 below the edge (528.6 eV) and the latter two at the peak of the edge (933 eV).
The reciprocal space region around (H, K, L)=(0.25, 0, 1.5), measured at the edge, is shown in Fig. 3. No peak of the type seen in Ref. 9 was visible in this or several other samples studied. Negative results were also obtained around (0.25, 0, 2) and (0.25, 0, 0.75). Evidently the checkerboard in NCCOC, in contrast to the charge order in LBCO, is below our sensitivity limit.
There are several possibilities for why this might be. First, while difficult to judge from the data in Ref. 5, it is possible that the electronic checkerboard ordering is glassy despite a well-ordered crystal structure, i.e. the charge amplitude is large but its correlation length is short. The signature of glassy ordering in coherent scattering is a broad peak centered at the ordering wave vector whose integrated intensity is substantial but whose peak count rate may be low. If the charge ordering is glassy the scattering is present but below our fluorescence background, i.e. at least 50 times weaker than the charge scattering from LBCO. This scenario allows us to place an upper bound on the quantity , where is the charge amplitude and is the in-plane correlation length. Specifically, assuming the charge order in NCCOC and LBCO have the same c-axis correlation lengths, it must be that . For and we arrive at .
Another possibility is that the structure exists only at the surface. In a recent mean field analysis, Brown et. al. BFK2005 , motivated by the lack of a signature of charge order in the transport properties of NCCOC WKKS2004 , showed that a commensurate charge density wave can be enhanced at the surface by poor screening or the presence of soft surface phonon modes. The authors argue that the commensurate checkerboard pattern in NCCOC is located in the near-surface region only and is an example of a surface “extraordinary” phase transition which precedes a bulk phase transition in NCCOC. The RSXS signal from such a surface effect would be weaker than the bulk signal by a factor of . Regardless of the possible explanation for the absence of a superlattice reflection, we conclude that there is no bulk static long-range charge order in NCCOC.
Acknowledgements.
The authors acknowledge helpful discussions with Tonica Valla, Eduardo Fradkin, and J. C. Séamus Davis. This work was supported by US Department of Energy.References
- (1) Z. Hiroi, N. Kobayashi, M. Takano, Nature 371, 139 (1994); Z. Hiroi, N. Kobayashi, M. Takano, Physica C 266, 191 (1996).
- (2) Yuhki Kohsaka, Masaki Azuma, Ikuya Yamada, Takao Sasagawa, Tetsuo Hanaguri, Mikio Takano, Hidenori Takagi, J. Am. Chem. Soc. 124, 12275 (2002).
- (3) K. Waku, T. Katsufuji, Y. Kohsaka, T. Sasagawa, H. Takagi, H. Kishida, H. Okamoto, M. Azuma, M. Takano, Phys. Rev. B 70, 134501 (2004).
- (4) F. Ronning, T. Sasagawa, Y. Kohsaka, K. M. Shen, A. Damascelli, C. Kim, T. Yoshida, N. P. Armitage, D. H. Lu, D. L. Feng, L. L. Miller, H. Takagi, Z.-X. Shen, Phys. Rev. B 67, 165101 (2003); K. M. Shen et al. Phys. Rev. B 69, 54503 (2004); K. M. Shen et al. Phys. Rev. Lett. 93, 267002 (2004); K. M. Shen, F. Ronning, D. H. Lu, F. Baumberger, N. J. C. Ingle, W. S. Lee, W. Meevasana, Y. Kohsaka, M. Azuma, M. Takano, H. Takagi, Z.-X. Shen, Science 307, 901 (2005).
- (5) T. Hanaguri, C. Lupien, Y. Kohsaka, D.-H. Lee, M. Azuma, M. Takano, H. Takagi, J. C. Davis, Nature 430, 1001 (2004).
- (6) Y. Kohsaka, K. Iwaya, S. Satow, T. Hanaguri, M. Azuma, M. Takano, H. Takagi, Phys. Rev. Lett. 93, 97004 (2004).
- (7) J. M. Tranquada, J. D. Axe, N. Ichikawa, Y. Nakamura, S. Uchida, B. Nachumi, Phys. Rev. B 54, 7489 (1996).
- (8) J. M. Tranquada, H. Woo, T. J. Perring, H. Goka, G. D. Gu, G. Xu, M. Fujita, K. Yamada, Nature 429, 534 (2004).
- (9) P. Abbamonte, A. Rusydi, S. Smadici, G. D. Gu, G. A. Sawatzky, D. L. Feng, Nature Physics 1, 155 (2005).
- (10) The NCCOC superlattice is visible in spectra within bias voltage, indicating a significant hole modulation with amplitude .
- (11) S. Haffner, R. Neudert, M. Kielwein, M. Knupfer, M. S. Golden, K. Ruck, G. Krabbes, J. Fink, H. Rosner, R. Hayn, H. Eisaki, S. Uchida, Z. Hu, M. Domke, G. Kaindl, Phys. Rev. B 57, 3672 (1998).
- (12) C. T. Chen, F. Sette, Y. Ma, M. S. Hybertsen, E. B. Stechel, W. M. C. Foulkes, M. Schluter, S.-W. Cheong, A. S. Cooper, L. W. Rupp, Jr., B. Batlogg, Y. L. Soo, Z. H. Ming, A. Krol, Y. H. Kao, Phys. Rev. Lett. 66, 104 (1991).
- (13) M. J. DeWeert, D. A. Papaconstantopoulos, W. E. Pickett, Phys. Rev. B 39, 4235 (1989).
- (14) L. F. Mattheiss, Phys. Rev. B 42, 354 (1990).
- (15) P. Abbamonte, G. Blumberg, A. Rusydi, A. Gozar, P. G. Evans, T. Siegrist, L. Venema, H. Eisaki, E. D. Isaacs, G. A. Sawatzky, Nature 431, 1078 (2004).
- (16) C. T. Chen, L. H. Tjeng, J. Kwo, H. L. Kao, P. Rudolf, F. Sette, R. M. Fleming, Phys. Rev. Lett. 68, 2543 (1992); E. Pellegrin, N. Ncker, J. Fink, S. L. Molodtsov, A. Gutirrez, E. Navas, O. Strebel, Z. Hu, M. Domke, G. Kaindl, S. Uchida, Y. Nakamura, J. Markl, M. Klauda, G. Saemann-Ischenko, A. Krol, J. L. Peng, Z. Y. Li, R. L. Greene, Phys. Rev. B 47, 3354 (1993).
- (17) P. Abbamonte, L. Venema, A. Rusydi, G. A. Sawatzky, G. Logvenov, I. Bozovi, Science 297, 581 (2002).
- (18) M. v Zimmermann, A. Vigilante, T. Niemller, N. Ichikawa, T. Frello, J. Madsen, P. Wochner, S. Uchida, N. H. Andersen, J. M. Tranquada, D. Gibbs, J. R. Schneider, Europhys. Lett. 41, 629 (1998); H. Kimura, H. Goka, M. Fujita, Y. Noda, K. Yamada, N. Ikeda, Phys. Rev. B 67, 140503(R) (2003).
- (19) J. M. Tranquada, private communication.
- (20) Stuart E. Brown, Eduardo Fradkin, Steven A. Kivelson, Phys. Rev. B 71, 224512 (2005).