The Transient Growth of Ammonium Chloride Dendrites
Abstract
We report measurements of the initial growth and subsequent transient response of dendritic crystals of ammonium chloride grown from supersaturated aqueous solution. Starting from a small, nearly spherical seed held in unstable equilibrium, we lower the temperature to initiate growth. The growth speed and tip radius approach the same steady state values independent of initial seed size. We then explore the response of the growing dendrite to changes in temperature. The crystal adjusts quickly and smoothly to the new growth conditions, maintaining an approximately constant value of throughout. Dissolving dendrites, on the other hand, are not characterized by the same value of .
keywords:
A1. Dendrites , A2. Growth from solution , A1. Crystal morphologyPACS:
68.70.+w , 81.10.Dn , 64.70.Dvand url]http://www.lafayette.edu/doughera
1 Introduction
Dendritic crystals are commonly observed when a non-faceted material grows from a supercooled melt or supersaturated solution. Metals and metal alloys are perhaps the most technologically important applications, but dendrites are also observed in some transparent organic compounds and in some salt solutions. For broad overviews with additional references, see Refs. [1, 2]. Mathematically, dendritic crystal growth is a challenging moving boundary problem, and is one of the canonical problems of pattern formation in non-linear, non-equilibrium systems [3].
One steady-state solution for the growth of a crystal is an approximately parabolic dendrite with radius of curvature propagating at constant speed determined by the material properties and growth conditions [4, 5]. Real dendrites, however, are not simple steady-state crystals. The smooth shape is unstable to sidebranching perturbations, resulting in a complex time-dependent shape where a compete specification of the state at any time could depend on the previous growth history [6, 7].
Numerical simulations, particularly phase field models, have made considerable progress in following this time-dependent evolution and extracting the steady state results. For reviews, see Refs. [8, 9]. Careful experimental measurements are still needed to determine whether those models indeed contain all of the relevant physics, and how well they apply to noisy irregular dendrites growing under actual experimental conditions.
In this work, we examine the role of transients in dendritic crystal growth. In particular, we look at the initial emergence and growth of a dendritic crystal from a well-characterized nearly spherical seed. We then monitor the changes in the crystal when it is subjected to carefully-controlled changes in growth conditions. The experimental protocol is designed to be readily reproducible in numerical simulations.
2 Experiments
The experiments were performed with aqueous solutions of ammonium chloride with approximately 38% NH4Cl by weight. The saturation temperature was approximately C. The solution was placed in a mm glass spectrophotometer cell sealed with a Teflon stopper held in place by epoxy. The cell was mounted in a massive copper block, surrounded by an outer aluminum block, and placed on a microscope enclosed in an insulating box.
The temperature of the outer aluminum block was controlled to approximately C. The temperature of the inner copper block was controlled directly by computer, allowing complete programmatic control over the temperature during the course of a run. The temperature of the sample was stable to within approximately C.
Images were obtained from a charged coupled device (CCD) camera attached to the microscope and acquired directly into the computer via a Data Translation DT3155 frame grabber with a resolution of pixels. The ultimate resolution of the images was m/pixel. The interface position was determined in the same manner as in Refs. [10, 11].
To obtain a single crystal, the solution was heated to dissolve all the NH4Cl, stirred to eliminate concentration gradients, and then cooled to initiate growth. Many crystals would nucleate, but an automated process was set up to acquire images and slowly adjust the temperature until only a single isolated crystal remained. The temperature was then continually adjusted until this crystal was the desired size. Although such a spherical crystal is in a state of unstable equilibrium, we found it possible to maintain it indefinitely, provided we continually monitored the size and adjusted the temperature accordingly. This isolated, nearly spherical, crystal was allowed to stabilize for several days.
For an experimental run, the temperature was first held constant for 500 seconds, and then lowered steadily. The typical drop was C at a rate of Cs. The time when the temperature started dropping was taken as . During the run, images were taken at 1-second intervals.
3 Initial Growth from a Nearly Spherical Seed
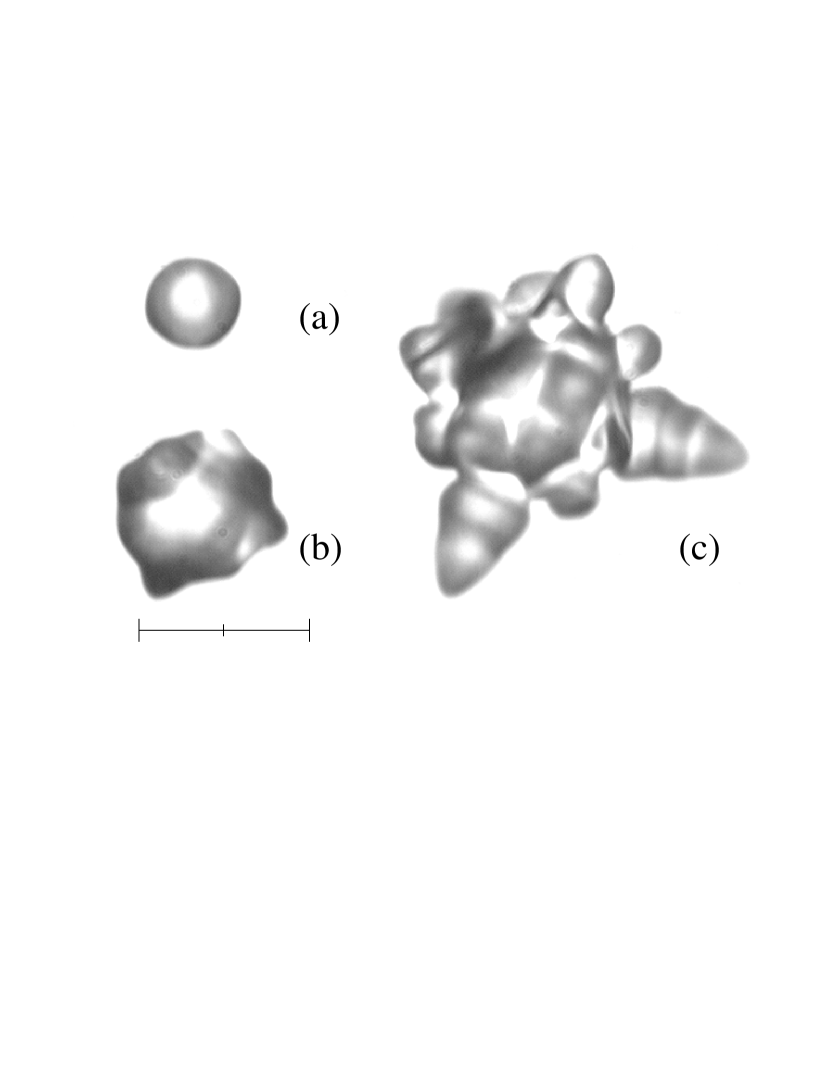
The initial stages of a growing crystal of NH4Cl are shown in Fig. 1. Initially, the crystal remains approximately spherical as it grows. As it gets larger, however, the smooth surface becomes unstable and precursors to dendritic tips emerge. Since NH4Cl has cubic symmetry, six dendrites would normally be expected in the [100] directions—four in the plane of the image, and two perpendicular to that plane. (The asymmetry in Fig. 1 is due to the imperfect orientation of the crystal.) In addition, there are smaller protuberances at angles between the main dendrite arms corresponding to less-favored growth directions [12, 13].
We model the initial stages of the growth as a quasi-static, spherically symmetric, and diffusion-limited process. Under those constraints, the radius of the crystal is given by
| (1) |
where is the diffusion coefficient for NH4Cl in aqueous solution, is the dimensionless supersaturation, and is the capillary length, which incorporates the surface energy [3]. The diffusion coefficient for lower concentrations and temperatures was measured by Lutz and Mendenhall [14] and by Hall, Wishaw, and Stokes [15]. Extrapolating those published values, we estimate ms. For this experiment, where the crystal rests against the bottom plate of the growth cell, we estimate the effective diffusion constant to be [10]. Lastly, was assumed to be linearly related to the temperature and the bulk equilibrium temperature by
| (2) |
The coefficient and the capillary length were determined by fits to Eq. 1.
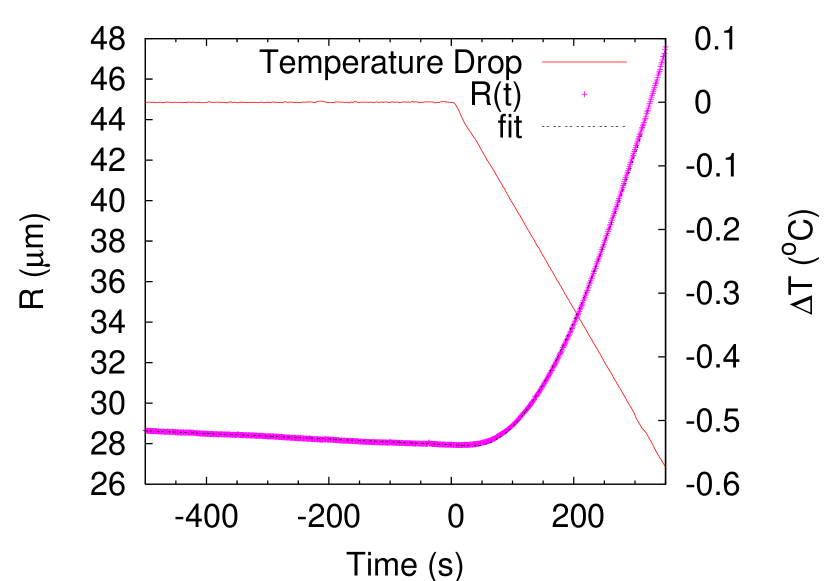
The radius as a function of time for the crystal in Fig. 1 is shown in Fig. 2, along with a fit to Eq. 1. The fit only includes times prior to that corresponding to Fig. 1(b), since the crystal shape becomes significantly distorted away from spherical after those times. From the fit shown in Fig. 2, we estimate C. We also used m, but the fit is not very sensitive to that value, since the second term in Eq. 1 is small for the large crystals considered here.
4 Emergence of Dendrites
To study the transition from initial sphere to fully-developed dendrites, we considered two runs with identical temperature profiles; one starting from a relatively small seed, and the second from a much larger seed. As above, we initially held the temperature constant for 500 seconds, and then lowered the temperature C at a rate of Cs.
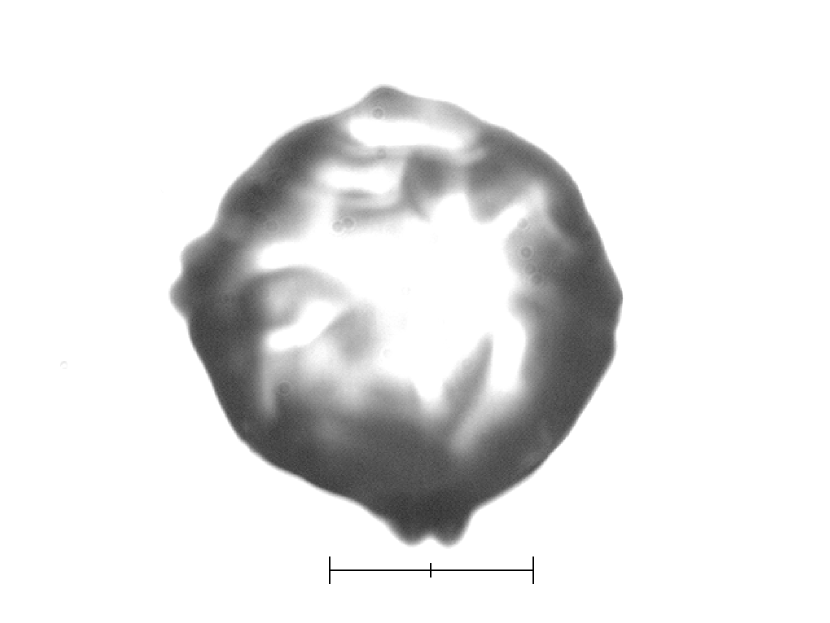
The initial growth of the small seed was shown above in Fig. 1. The large seed is shown in Fig. 3 at a time of 550s after initiating growth. Near the bottom of the image, instead of a single dendrite arm, there are two nearly equal arms competing. Eventually, the one on the right won out, and was followed for the remainder of the run.
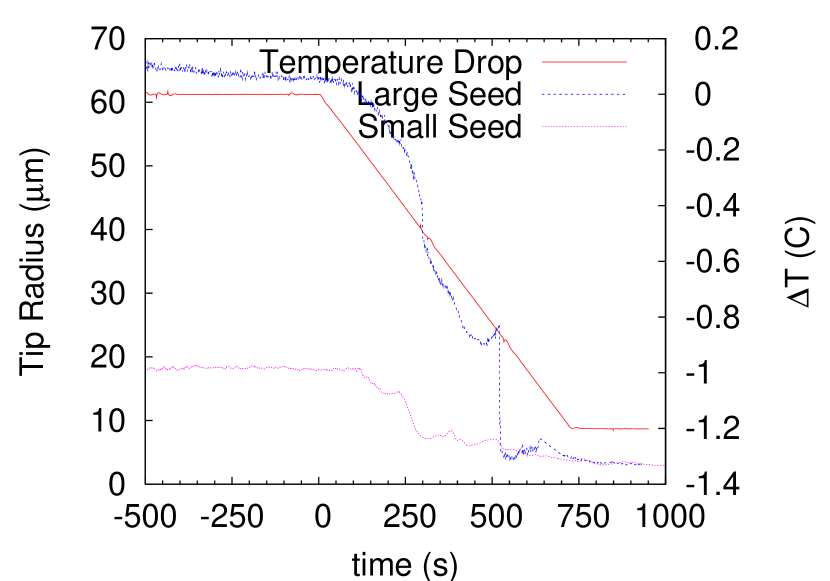
The evolution of the tip radius of curvature for the two crystals is shown in Fig. 4. The curvature was measured by fitting a parabola with a fourth-order correction as in Ref. [11]:
| (3) |
where the growth direction of the dendrite is taken to define the direction, is the location of the tip, is the radius of curvature at the tip, and is an orientation-dependent fourth-order correction. For fully-established steady-state dendrites, the most robust results were obtained if data were taken up to a distance of behind the tip. For incipient dendrites, such as those in Fig. 3, only data a small distance of could be used.
For the large seed, there is a sharp drop near 500s; this corresponds to the time shortly before that shown in Fig. 3, when the instability on the bottom is beginning to develop into two distinct dendrites, and the fitting program switches from fitting an envelope including both emerging tips to a fit including just a single tip. In such cases, the “best” fit is not well-defined, but the graph does accurately reflect the emergence of dendrites. Both large and small seeds approach the same steady-state value to within the experimental uncertainty. For the time interval after the temperature reached its steady-state value, 750–1000s, the average radius for the dendrite grown from either the large or the small seed is m.
The tip speed was determined simply by measuring the displacement of over time. The initial evolution of the tip speed is shown in Fig. 5. The fluctuations for the small seed near 250s correspond to times shortly before that shown in Fig. 1(b), when the initial tips are just becoming discernible, and the fit is not well-defined. Again, both approach the same steady-state value of m/s, though the large seed does so slightly more slowly, perhaps due to the competition between adjacent tips visible at the bottom of Fig. 3.
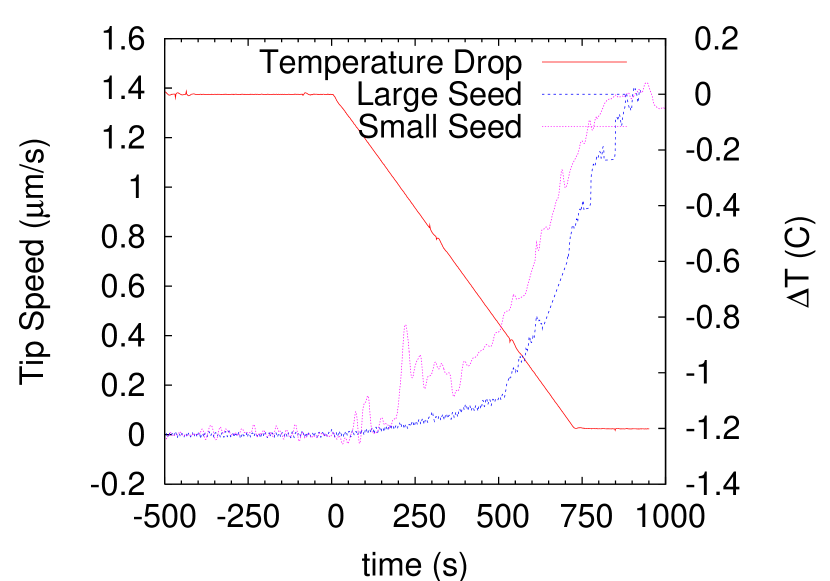
This behavior is somewhat different from that observed in the simulations of Steinbach, Diepers, and Beckermann [16], where the approach to steady state differed depending on initial seed size, but that difference is likely due to different initial conditions. In Ref. [16], the authors used initial conditions appropriate for the Isothermal Dendritic Growth Experiments (IDGE) of Glicksman and co-workers [17, 18, 19]. In those experiments, the growth chamber was held at a constant supercooling, and growth was initiated through a capillary tube, or “stinger”. The initial crystals that grew from the end of the stinger entered a region where the temperature was very nearly uniform, and the steady-state temperature field had not yet been established. Steinbach, Diepers, and Beckermann modeled this as growth from a finite-sized seed placed in a region of originally uniform supercooling. Their simulations showed that the initial transient approach to steady state depended on the size of the initial seed.
In this work, the initial seed is in equilibrium with the saturated solution. The temperature is then lowered, initiating growth. The fit in Fig. 2 demonstrates that the present system is reasonably well described as being in quasi-static equilibrium throughout the initial growth process.
The possible significance of initial seed size was also examined by Pines, Chait, and Zlatkowski [20]. They considered thermal growth at very low undercooling, and concluded that there ought to be corrections on the order of , where is the steady state tip radius, and is the radius of the initial sphere. That ratio is 0.04 and 0.12 for the large and small seeds, respectively, which corresponds to a predicted difference of approximately m, comparable to the uncertainties in the measurements.
5 Response to Transients
To study the response of growing dendrites to transients, the crystals were subjected to a series of temperature changes, and the tip radius and speed were monitored throughout. After the initial transient, the temperature was held constant for a long time, and then the temperature was changed at approximately Cs, which is as quickly as the apparatus could respond.
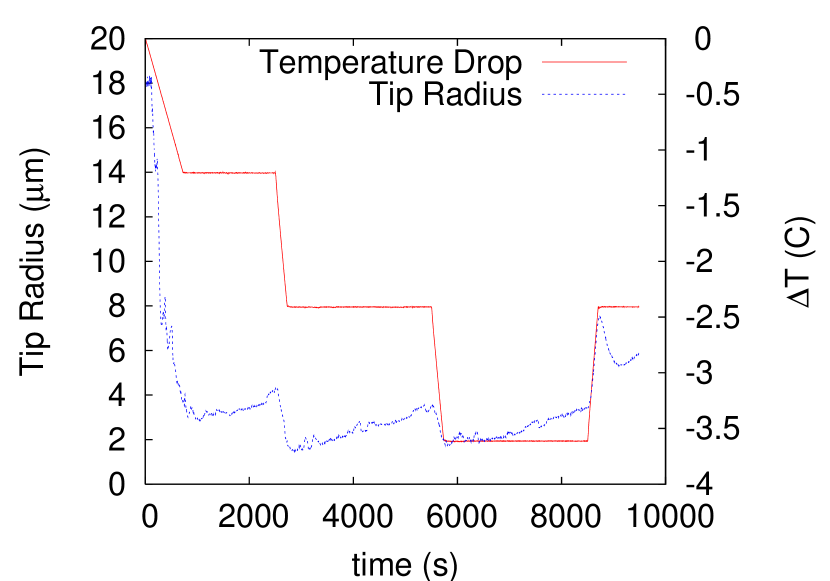
The evolution of the tip radius is shown in Fig. 6. During each segment at constant temperature, the growing crystal slowly depletes the growth cell, so the tip radius gradually increases and the tip speed gradually decreases. (Similar finite size effects were also seen in the IDGE results at very low supercoolings [17, 18, 19, 21, 22].) Each subsequent lowering of the temperature brings on a fresh burst of growth.
The primary cause of the scatter in the data is the slight change in focus as the crystal grows across the screen. Since the crystal does not grow exactly in the horizontal plane, the focus changes slightly during the course of the run, and has to be periodically adjusted. This leads to small fluctuations in the measured value for .
The changes in crystal morphology shortly before and after transients are shown in Fig. 7. A steady state dendrite at s is shown in Fig. 7(a). There are fairly regular sets of sidebranches growing on each side. Fig. 7(b) shows the crystal at s, after the temperature began to drop at 2500s. The arrows show the location of the tip at s. Because of the decrease in temperature, the tip speed is higher and the tip radius is smaller. Finally, Fig. 7(c) shows the crystal at s, when the speed dropped to zero after the temperature was increased at 8500s. The arrows show the location of the tip at s.
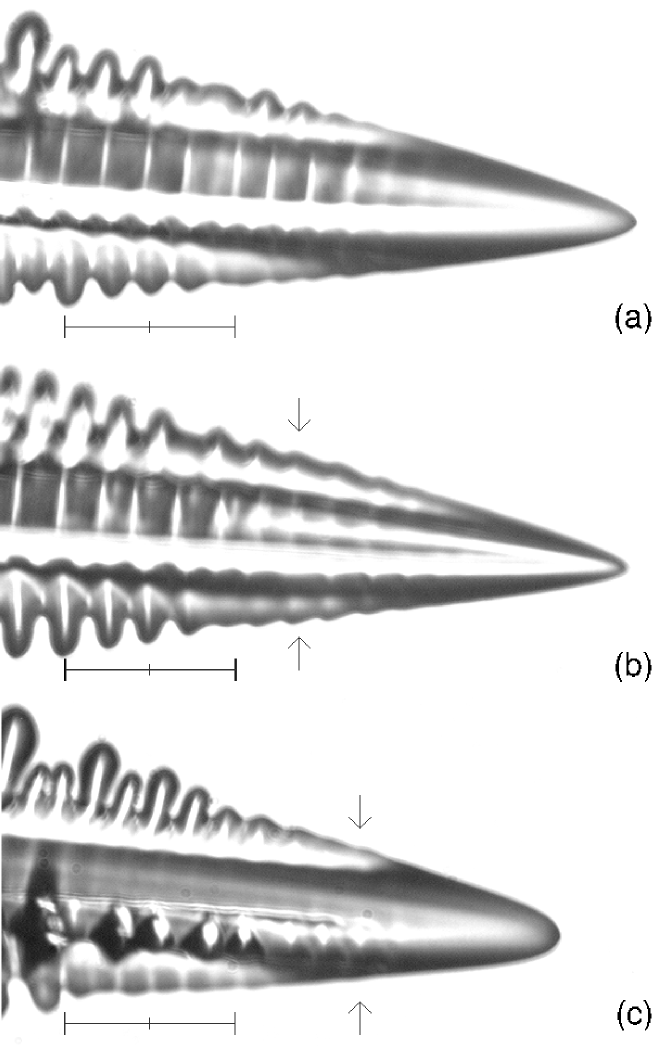
Overall, the transients in this case are slow enough that the crystal is able to adjust relatively smoothly to the change, without the generation of large sets of sidebranches. Other experiments with more rapid transients have seen large sets of sidebranches generated [23, 24, 25, 26]. We also saw no evidence of any transition to doublons, as has been observed in xenon dendrites [27, 28].
During the transitions, the tip curvature is not precisely defined, since the fit to Eq. 3 attempts to include portions of the crystal grown under different conditions, but the distortion is not too significant, as seen in Fig. 6. At s, the temperature was raised back up so that the crystal started to dissolve. While dissolving, the crystal shape deviates significantly from that given by Eq. 3, though the measured tip curvatures are still a reasonable representation of the tip size.
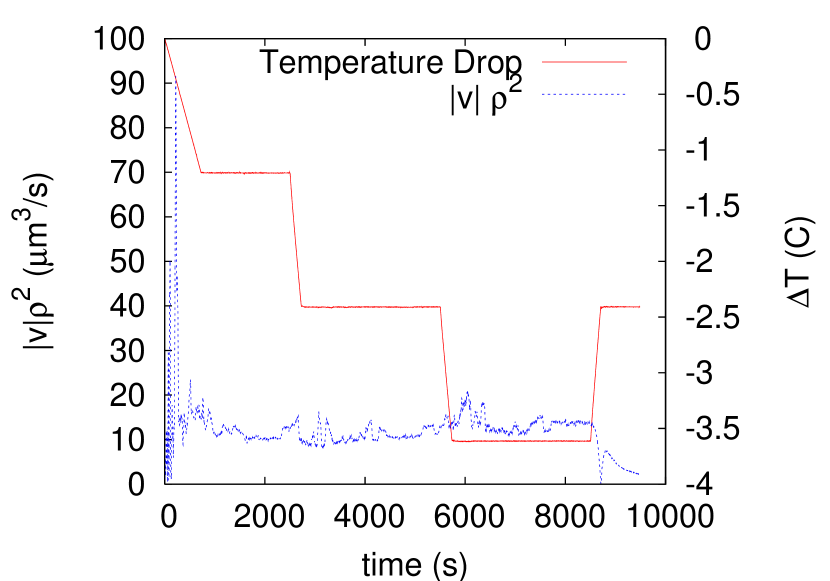
Finally, throughout the experiment, the quantity remains approximately constant during growth, as shown in Fig. 8, with an average value of ms. There are no significant changes during the transients. The large fluctuations near the beginning are due to the initial growth of the instability, exacerbated by the ambiguities inherent in determining the tip radius and position of incipient dendrites, such as those in Fig. 1(b). Around s, the crystal reached the edge of the viewing area, and the growth cell was moved to bring it back into view. This apparently caused a small bit of motion inside the cell, leading to a momentary increase in speed. After s, the crystal began dissolving, and the velocity became negative. During the dissolution, the quantity was no longer constant.
These results are consistent with the findings of Steinbach et al., who observed significant transients in their simulations, but estimated that the time for transient responses is of the order of [16], which is of the order of 1.0s in the present experiments.
6 Conclusions
We have performed experiments on the growth of NH4Cl dendrites in which the growth conditions have been carefully controlled. We find that the approach to steady-state growth is rather robust; the same tip radius and speed are obtained independent of initial seed size. We also find that the crystal smoothly adjusts to transients that are reasonably slow compared to the time scale . Future experiments will focus on faster transients and on the response of the sidebranching structure to those transients.
References
- [1] W. Boettinger, S. Coriell, A. Greer, A. Karma, W. Kurz, M. Rappaz, R. Trivedi, Acta Mater. 48 (2000) 43–70.
- [2] M. E. Glicksman, S. P. March, in: D. J. T. Hurle (Ed.), Handbook of Crystal Growth, Elsevier Science, 1993, p. 1081.
- [3] J. Langer, Rev. Mod. Phys. 52 (1980) 1.
- [4] D. A. Kessler, J. Koplik, H. Levine, Adv. Phys. 37 (1988) 255.
- [5] G. B. McFadden, S. R. Coriell, R. F. Sekerka, Acta Mater. 48 (2000) 3177.
- [6] R. J. Schaefer, J. Cryst. Growth 43 (1978) 17–20.
- [7] J. Lacombe, M. Koss, D. Corrigan, A. Lupulescu, L. Tennenhouse, M. Glicksman, J. Cryst. Growth 206 (1999) 331–344.
- [8] A. Karma, Encyclopedia of Materials: Science and Technology, Vol. 7, Elsevier, Oxford, 2001, p. 6873.
- [9] W. J. Boettinger, C. Beckermann, A. Karma, J. A. Warren, Ann. Rev. Mater. Sci. 32 (2002) 163.
- [10] A. Dougherty, J. P. Gollub, Phys. Rev. A 38 (1988) 3043.
- [11] A. Dougherty, M. Lahiri, J. Cryst. Growth 274 (2005) 233–240.
- [12] S.-K. Chan, H.-H. Reimer, M. Kahlweit, J. Cryst. Growth 32 (1976) 303.
- [13] S.-K. Chan, H.-H. Reimer, M. Kahlweit, J. Cryst. Growth 43 (1978) 229.
- [14] J. L. Lutz, G. D. Mendenhall, J. Cryst. Growth 217 (2000) 183–188.
- [15] J. R. Hall, B. F. Wishaw, R. H. Stokes, J. Am. Chem. Soc. 75 (1953) 1556–1560.
- [16] I. Steinbach, H.-J. Diepers, C. Beckermann, J. Cryst. Growth 275 (2005) 624–638.
- [17] M. Glicksman, M. Koss, E. Winsa, Phys. Rev. Lett. 73 (1994) 573–576.
- [18] D. Corrigan, M. Koss, J. Lacombe, K. Dejager, L. Tennenhouse, M. Glicksman, Phys. Rev. E 60 (1999) 7217–7223.
- [19] M. Koss, J. Lacombe, L. Tennenhouse, M. Glicksman, E. Winsa, Metall. and Mater. Trans. A 30 (1999) 3177–3190.
- [20] V. Pines, A. Chait, M. Zlatkowski, J. Cryst. Growth 182 (1997) 219–226.
- [21] V. Pines, A. Chait, M. Zlatkowski, J. Cryst. Growth 167 (1996) 383–386.
- [22] R. F. Sekerka, S. R. Coriell, G. B. McFadden, J. Cryst. Growth 171 (1997) 303–306.
- [23] L. M. Williams, M. Muschol, X. Qian, W. Losert, H. Z. Cummins, Phys. Rev. E 48 (1) (1993) 489–499.
- [24] T. Börzsönyi, T. Tóth-Katona, A. Buka, L. Gránásy, Phys. Rev. E 62 (6) (2000) 7817.
- [25] Y. Couder, J. Maurer, R. González-Cinca, A. Hernández-Machado, Phys. Rev. E 71 (2005) 051607.
- [26] M. Fell, J. Bilgram, Bull. Am. Phys. Soc. 51 (1) (2006) 61.
- [27] H. M. Singer, J. H. Bilgram, Phys. Rev. E 70 (2004) 031601.
- [28] H. M. Singer, J. H. Bilgram, J. Cryst. Growth 275 (2005) e243–e247.