Understanding the Unusual Properties of Water
Abstract
Water is commonly associated to the existence of life. However, there is no clear reason why water should be the only liquid in which life could form and survive. Since the seminal work of L. J. Henderson in 1913, scientists are trying to answer the question about the relation between the unusual properties of water and the existence of life. Here we follow the first steps along the challenging path to this answer, trying to understand (i) what is unusual about water; (ii) why water has anomalies; (iii) which are the full implications of these unusual properties; and (iv) if these anomalies are exclusive properties of water. By identifying some interesting clues, then by formulating a working hypothesis and, next, by testing it, we find the surprising results that some properties of water, such as the anomalous behavior of density, are very sensitive to small changes of the microscopic interactions, while others, such as the presence of more than one crystal or a possible phase transition between two liquids with different local structures, are predicted not only in water, but also in other liquids. Since the change of local liquid structure could be relevant in biological processes, the possibility of a wide class of liquids with this property could help in understanding if water is essential for life.
I Introduction
Water is commonly associated to the existence of life. It is the main component of living organisms: the human body is by weight roughly 75% water in the first days of life and roughly 60% water in the adult age. The majority of this water (roughly 60%) is inside the cells, while the rest (extracellular water) flows in the blood and below the tissues.
Many living beings can survive without water only a few days. This is because water participates in the majority of the biological processes Franks1985 , such as the metabolism of nutrients catalysed by enzymes. In order to be effective the enzymes need to be suspended in a fluid to adopt their active three-dimensional structure. The main reason why we need water is that it allows the processes of elimination of cellular metabolic residues. Is through the water that our cells can communicate and that oxygen and nutrients can be brought to our tissues.
However, despites all these considerations, there is no clear reason why water should be the only liquid in which life could form and survive. The debate about the essential role in biological processes played by water and its properties is open.
The first remarkable thing about water is that it has a large number of anomalies with respect to the other usual substances. This fact has fascinated the scientists since centuries. It was, probably, L. J. Henderson in 1913 Henderson the first asking about the relation between the unusual properties of water and the existence of life.
Since then, scientists are trying to reach the answer to this question step by step. Here we will follow the first steps of this long path. Those steps can be summarized by the following questions:
-
•
What is unusual about water?
-
•
Why water has anomalies?
-
•
Which are the full implications of these unusual properties?
-
•
Are these anomalies exclusive properties of water?
Answer to these questions is a scientific challenge. We will organize the discussion by, first, identifying some interesting clues, then by formulating a working hypothesis and, next, by testing it. In this process we will use, among the other theoretical tools, computer simulations. Their applicability to the case of water has been demonstrated by many studies and the dramatic increase of computational power makes them more and more feasible.
II What is unusual about water?
There are many puzzles associated with water. Their relevance for biological processes is sometimes difficult to say, but there is one that is definitely evident: liquid water can exist at temperatures far lower than the melting/freezing temperature.
This property allows living systems to survive at very cold temperatures, far below 0∘C. At this temperatures liquid water is said to be in a supercooled phase, to emphasize that this phase is metastable, i. e. it cannot last forever as a stable phase, but, sooner or later, it will transform into ice.
II.1 Water at very low temperatures
Water in organic cells can avoid freezing at temperatures as low as -20∘C in insects, and -47∘C in plants, for a time long enough to be compared to their lifetime debenedettibook . In laboratory supercooled water has been observed at -41∘C at ambient pressure Cwilong1947 and in situ observation has confirmed the presence in clouds of droplets of liquid water at -37∘C Rosenfeld00 . The lowest measured supercooled liquid water temperature is -92∘C at 2 kbars Kanno1975 .
Below these temperatures water cannot exist as a liquid and forms crystalline ice, by means of a process known as crystal homogeneous nucleation. But water is unusual also in its crystalline phase. Indeed, water is a polymorph, i. e. has many crystalline forms, like a few other unusual substances, e. g. carbon, which may form the cheap graphite or the very expensive diamond. In the case of water, the known polymorphs are as much as thirteen.
At roughly 80 degrees below the homogeneous nucleation temperature water can exists also in a glassy form, i. e. in a frozen, amorphous solid form BrugellerMayer1980 , which crystallize to cubic ice at approximately -123∘C at ambient pressure. Again, unusually, instead of just one amorphous phase, at these temperatures there is more than one polyamorph of glassy water. The first clear indication of this was a discovery of Mishima in 1984. At low pressure there is one form, called low-density amorphous (LDA) ice BrugellerMayer1980 , while at high pressure there is a new form called high-density amorphous (HDA) ice Mishima1985 , with a volume discontinuity between these two phases of 27%, comparable to that separating low-density and high-density polymorphs of crystalline ice Mishima1994-1996 ; Mishima96 ; SuzukiMishima2002 ; ms98 .
Recently, a new form of amorphous water has been experimentally observed by compressing HDA over 0.95 GPa, the very-high-density amorphous (VHDA) ice Loerting01 ; Finney02 , with a volume discontinuity between HDA and VHDA of 11%. At 125 K (-148∘C) the three polyamorphs can be formed by compression in a stepwise process LDA-HDA-VHDA Loerting06 . However, from experimental data is not yet clear if the transformations LDA-HDA and HDA-VHDA are real discontinuous transitions or just very sharp increases of densities and additional investigations are needed to clarify this point. Remarkably, HDA ice is the most abundant ice in the universe, where it is found as a frost on interstellar grains Jenniskens . HDA ice has been proposed as the cradle where small inorganic molecules combine into the large organic molecules at the origin of life webNasa .
II.2 Volume fluctuations
The unusual behavior of water is not limited to the supercooled phase. For example, its isothermal compressibility , that is the departure of the volume per particle from its mean value in response to an infinitesimal pressure change , is anomalous already at high temperatures.
For a typical liquid decreases when one lowers the temperature (Figure 1). In statistical physics we learn that is proportional to the average value of the fluctuations of , hence we expect that decreases with the temperature , because the fluctuations decrease with . For water, instead, is anomalous in three respects: (i) it is larger than one would expect; (ii) below C, instead of decreasing as for usual liquids, it increases, doubling its value before reaching the homogeneous crystal nucleation temperature in the supercooled phase; (iii) it appears as if it might diverge to infinity, at a temperature of about C, increasing like a power law and hinting at some sort of critical behavior Speedy76 .
II.3 Entropy fluctuations
Another anomalous thermodynamic function is the heat capacity at constant pressure , which is the response of the entropy (or disorder) per particle to an infinitesimal temperature change . This quantity decreases with for a typical liquid, because it is proportional to the fluctuations of entropy and these fluctuations decreases with for normal substances. But water is, again, anomalous in the same three respects: (i) its is larger than expected; (ii) below about 35 ∘C the specific heat increases; (iii) this increase is approximated by a power law Angell82 . It is thanks to the high heat capacity of water that we can easily regulate our body temperature by transpiration.
II.4 Volume-entropy cross fluctuations
The last anomalous thermodynamic function we consider is the thermal expansivity , which is the response of the volume to an infinitesimal temperature change . In typical liquids this quantity decreases with and is always positive, because it is proportional to the cross-fluctuations of entropy and volume . Indeed, in normal liquids this quantity is positive because when there is a local increase of fluctuation of the volume , the particles in that region shuffle around increasing the disorder and the associated entropy fluctuation . Water, again, is anomalous in the same three respects: (i) its is 3 time smaller than expected; (ii) below 4 ∘C its is negative and grows rapidly in absolute value; (iii) this absolute value increases as a power law Hare86 .
The fact that is negative below 4∘C shows that water is more disordered when it is more dense. For this reason ice melts if its density increases, e. g. for an increase of pressure, because only by disordering, i. e. liquefying, it can reach the desired density. This behavior is related to the most famous anomaly of water: its density maximum at 4 ∘C. Below this temperature the volume of water expands explaining why frozen water pipes break or why ice cubes float on water once liquid water cools down. In contrast, solid forms of typical substances are denser than their liquid form. Is thank to this anomaly that lakes and seas start to freeze from top, allowing fishes to survive in the liquid water below the ice.
III Why water has anomalies?
After this brief introduction on the unusual properties of water, any scientist would ask why water is so special. Perhaps, the first clue dates back to Linus Pauling Pauling39 , who recognized that the distinguish feature of water, compared to other chemically similar substances, is the preponderance of hydrogen bonds.
Each water molecule has two hydrogen atoms and two lone electron pairs. Each hydrogen has a partial positive charge, forming an O–H bond with en electron pairs on the oxygen side. Each lone pair tends to form a hydrogen bond with the hydrogen of a nearby H2O molecule, whose O–H bond points to the lone pair. Hence, in a simplified view, each molecule can form four hydrogen bonds attracting four nearby molecules.
Since the four electron pairs (two lone pairs and two pairs of the O–H bond) repel each other, the four hydrogen bonds point along the vertexes of an almost perfect tetrahedron. In liquid water many of the possible hydrogen bonds between nearby molecules are formed, giving rise to a hydrogen bond tetrahedral network. The network is not static since hydrogen bonds have a very short lifetime, of the order of picoseconds, allowing the rotation and the diffusion of H2O molecules Laage-Hynes2006 . This dynamic hydrogen bond network slows down when the temperature is decreased and freezes in a full hydrogen bonded network, below the homogeneous nucleation temperature, transforming into ice. The reason why water expands when forms ice at ambient pressure is because the distance between nearby molecules in the ice tetrahedral network is larger than the average inter-molecular distance in the liquid, giving rise to an open structure (hexagonal ice or ice Ih).
Experiments Soper-Ricci00 show that this open tetrahedral structure is preserved even in the liquid at as low as 268 K (-5∘C) up to the second shell of molecules, and that this open structure can coexist with a more compact structure in which the second shell collapses, locally increasing the density of the liquid. This two kinds of local structures are called low-density liquid (LDL), for the open structure, and high-density liquid (HDL) for the collapsed structure, in analogy with the LDA and HDA ices. They were first observed in computer simulations Poole and have suggested two ways to develop a coherent picture of the unusual behavior of water: (i) the liquid-liquid phase transition hypothesis Poole and (ii) the singularity-free interpretation StanleyTeixeira80 ; Sastry96 .
III.1 The liquid-liquid phase transition hypothesis
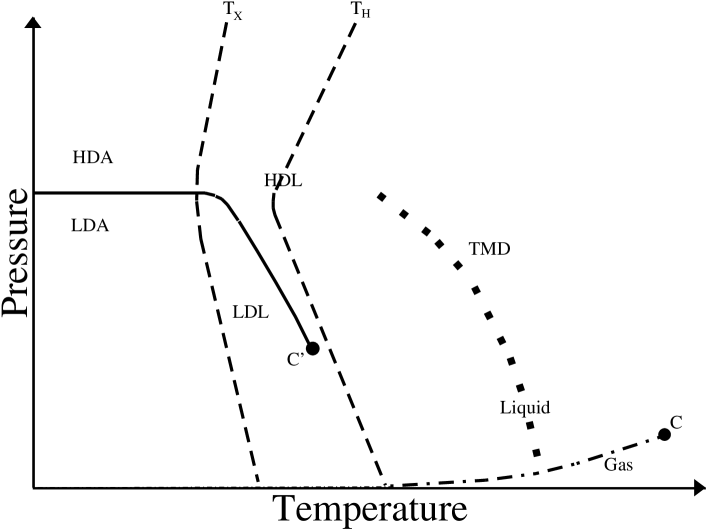
In the liquid-liquid phase transition picture Poole the LDA–HDA transition in supposed discontinuous and marked by a line in the pressure–temperature (–) phase diagram below the temperature of crystallization to cubic ice (Figure 2). It is assumed that this line does not terminate when it reaches the region of spontaneous crystallization at , but extends into it, with LDA transforming without discontinuity into LDL, and HDA into HDL, giving a LDL–HDL phase transition line. According to this hypothesis, along this line the two kinds of liquids coexist as two separate phases, both forming macroscopic droplets of a phase into the other. At pressures above the liquid-liquid coexistence line the only existing phase is HDL, while below there is only LDL. The collapsed structure of HDL is more disordered than the open structure of LDL, hence the entropy of HDL is larger than that of LDL and this implies, for thermodynamics relations, that the liquid-liquid coexistence line has negative slope in the – phase diagram.
An experiment able to cross the liquid-liquid coexistence line should measure a sudden discontinuity in the local density of the liquid. Theoretical and computational estimates of the liquid-liquid coexistence line locate it in the region below the homogeneous nucleation of the crystal at and above the spontaneous crystallization line at . In this range of temperatures the experiments on the liquid cannot be performed, but the phase diagram can be explored with the help of computers and sophisticated water-models. These simulations Poole ; geiger show the discontinuity in density which supports the hypothesis. They also show that the density difference, between the two phases, decreases by increasing the temperature along the line and goes to zero in a liquid-liquid critical point where the line ends. At higher the two phases are indistinguishable and the two kinds of structures (open and collapsed) are found only at the microscopic scale of a few molecules, just as the gas and liquid phases are indistinguishable above the gas-liquid critical point .
The existence of a critical point induces large (critical) fluctuations in a region that extends to temperatures and pressures far away in the phase diagram. For example, experiments show that the effect of the gas-liquid critical point on the response functions is evident even at temperatures twice higher than the -temperature and that these functions diverge as power laws at .
In a similar way, the anomalous increase of the response functions is, in this hypothesis, the effect of approaching the liquid-liquid coexistence line, with a genuine divergence at the critical point . At above the liquid-liquid critical temperature the thermodynamic response functions appear to diverge to infinity approaching the Widom line, that is defined as the analytic extension of the liquid-liquid phase transition line in the – phase diagram. When the system is extremely close to the Widom line, the functions will round off and ultimately remain finite—as experimentally observed in the adiabatic compressibility Trinh .
This hypothesis is consistent with recent experiments ms98 . The melting line of metastable ice IV and stable ice V show an abrupt change in their slope as predicted if it would intersect the metastable liquid-liquid phase transition line. However, the experiment resolution does not allow to conclude if the sharp change is a real discontinuity, as required by the liquid-liquid phase transition hypothesis. Therefore, Mishima and one of us (Stanley) interpolated the experimental data to calculate the Gibbs free energy of the liquid at equilibrium with the different ice polymorphs along their melting line and estimated a liquid-liquid critical point at 1 kbar and 220 K.
III.2 The singularity-free interpretation
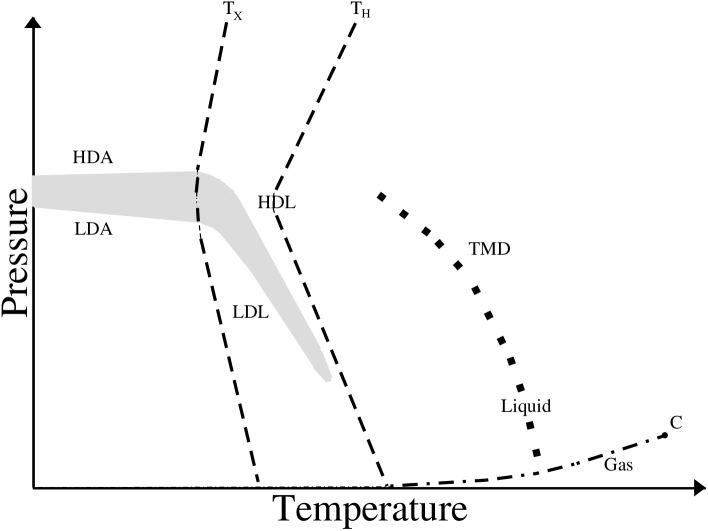
In the singularity-free scenario StanleyTeixeira80 ; Sastry96 (Figure 3) the LDL and HDL are still smoothly connected to LDA and HDA, respectively, but do not represent two distinct phases separated by a discontinuous transition. Instead, they represents local fluctuations of densities and, by increasing the pressure, one can pass from LDL to HDL observing a sharp, but continuous, increase of density, occurring in a limited region. Hence, there is no liquid-liquid phase transition and no liquid-liquid critical point in this scenario. The large increase of response functions seen in the experiments represents only an apparent singularity that eventually rounds off in a maximum, instead of giving rise to a real divergence, in correspondence to the continuous increase of density.
This can be understood because, when LDL regions forms at low , the volume per particle increases while the entropy (disorder) per particle decreases (the molecules are ordered in a more extended tetrahedral structure) giving negative . As we have seen, this cross-fluctuation is proportional to the thermal expansivity , that, as a consequence becomes negative at low temperature. In the same way, the anticorrelated fluctuations of volume and entropy for LDL regions reduce at high with respect to the expected value for an usual liquid. Therefore, the unusual behavior of can be easily interpreted in this scenario.
The temperature where corresponds to the temperature of maximum density (TMD) and, by changing , it form in the – phase diagram a continuous line that bends toward low when increases, as shown by experiments. All the other anomalies we have mentioned so far can be interpreted as a consequence of the presence of the TMD line. Models and calculations have been shown to be consistent with this scenario under some hypothesis, such as neglecting the correlations in the hydrogen-bond formation and breaking.
III.3 The difference between the two scenarios
The liquid-liquid phase transition hypothesis and the singularity-free interpretation are both thermodynamically consistent and only differ in the experimentally-unaccessible region, between and . Away from this region these two interpretations coincide, giving the same description of the TMD line and the unusual behavior of the response functions.
However, the presence of a new liquid phase at low would represent a relevant feature to understand the water dynamics not only in the supercooled and glassy region, but also at moderately low temperature, and it could be relevant for biological process, such as the cold denaturation of protein manuel . For example, the enzymatic activity of most proteins ceases below 220 K Rasmussen92 ; Ferrand93 , the same temperature estimated for the liquid-liquid critical point of water ms98 , showing a possible relation between the two phenomena. This is in agreement with the idea that the dynamics of interfacial water and protein are highly coupled at low temperatures masaki ; Bagchi2005 . Further investigation is needed to understand this relation.
IV Which are the full implications of the unusual properties of water?
Since from the experiments is difficult to reach a conclusive picture about the origin of the anomalies of water, we adopt a different approach, quite common in physics: we develop a schematic model that reproduce the water properties and explore, by theoretical calculations and computer simulations, its phase diagram, focusing on the supercooled region hard to investigate with experiments. The answers we can get in this way are not definitive, because they depend on the inevitable approximations included in the model; hence, different models can give different answers debenedetti-review . However, by studying how the answers change when we modify the features of the model, we can help in clarifying which are the implications of the properties of water.
IV.1 The correlation of the hydrogen bond network
We consider a model for water that (i) has the density anomaly, (ii) forms a hydrogen bond network, and (iii) has a parameter that describes how strong is the correlation among the hydrogen bonds formed by the same molecule fs ; fsPhysA ; fms . The latter feature is introduced because experiments show that the relative orientations of the hydrogen bonds of a water molecule are correlated, with the average H-O-H angle equal to in an isolated molecule, in the gas and in the high- liquid Kern-Hasted-Ichikawa ; Hasted72 ; Ichikawa91 . Therefore, there is an (intra-molecular) interaction between the hydrogen bonds formed by the same molecule. This interaction depends on , because the H-O-H angle changes with temperature, consistent with ab-initio calculations Silvestrelli and molecular dynamics simulations raiteri ; Netz . The strength of this intra-molecular interaction represents the parameter we use in the model to regulate the correlation among the hydrogen bonds of the same molecule.
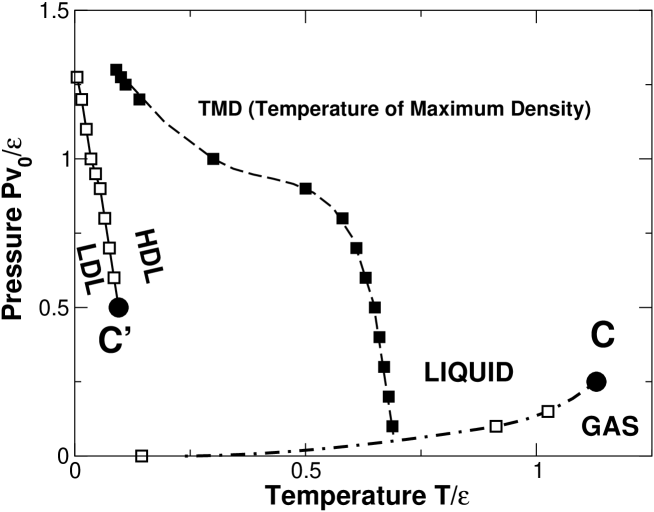
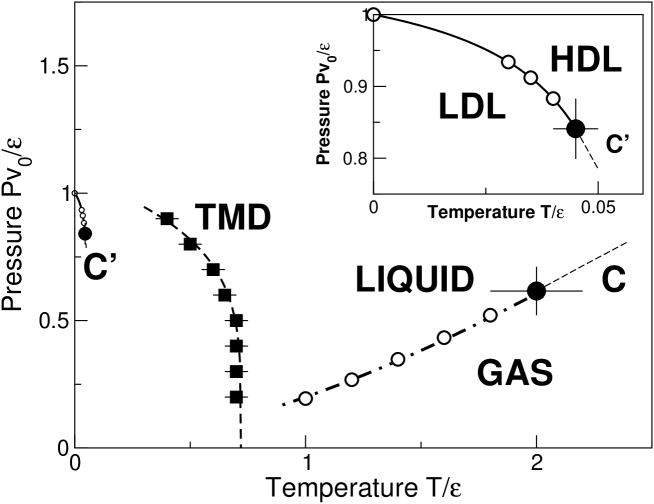
We first check, by theoretical calculations fs ; fsPhysA (Figure 4) and computer simulations fms (Figure 5), that our model reproduces the known phase diagram of fluid water, with the liquid-gas phase transition ending in the critical point and with the TMD line. As shown in the experiments, we find that the TMD line decreases with increasing ANGELL ; Poole97 .
If we fix the intra-molecular interaction between hydrogen bonds to a positive values, we find that in the deeply supercooled region the liquid has a liquid-liquid phase transition ending in the critical point and following a line with negative slope in the – phase diagram. Therefore, we recover the liquid-liquid critical point scenario.
IV.2 Connecting the two interpretations
At this point it is natural to ask if the liquid-liquid critical point is a necessary consequence of the properties of water. With the schematic model we use, it is possible to answer this question by changing the values of (a) the parameters determining the density anomaly and (b) the parameter determining the correlation among the hydrogen bonds.
We first show that by decreasing the parameter in (b), associated to the correlation in the hydrogen bond network, the liquid-liquid critical point moves to lower and higher . When “retraces” on the line of the liquid-liquid phase transition, the divergence of the response functions occurring on this line is replaced by a maximum occurring in a region around a locus (the Widom line in Figure 5) in the – phase diagram.
The case with the parameter in (b) set to zero, studied in Ref. Sastry96 ; Rebelo98 ; LaNave99 , is reached with continuity, with disappearing at and at the corresponding pressure on the liquid-liquid phase transition line in Figures 4 and 5, leaving behind the Widom line with the maxima of the response functions, necessary in the singularity-free scenario.
Therefore, we show, first, that the liquid-liquid critical point is, in this model, a consequence of the hydrogen bond correlation and, second, that two scenarios presented above are related to each other: by decreasing the correlation of the hydrogen bond network, we pass with continuity from the liquid-liquid phase transition scenario to the singularity-free interpretation. The latter, within our schematic model, is only possible in the limiting case of no hydrogen bond correlation, a situation that is not consistent with the experimental data for water.
IV.3 The consequence of the density anomaly
In all the considered cases, we find that the density anomaly and the TMD line are not affected by the variation of the parameter in (b), consistent wit the fact that the these properties are reproduced also when this parameter is set to zero, i. e. in the singularity-free scenario Sastry96 ; Rebelo98 ; LaNave99 . Instead, it is possible to see that, in our model, the parameter in (a) determining the density anomaly and the occurrence of the TMD line, is associated to the local volume expansion caused by the hydrogen bond formation. This local expansion is responsible also for the open structure of the low-density liquid phase. We, therefore, conclude that the liquid-liquid phase transition is a necessary consequence of the density anomaly (due to the open structure) and of the hydrogen bond correlation characterizing the tetrahedral network.
V Are these anomalies exclusive properties of water?
The change of the local structure of the liquid water, related to its anomalies, has been proposed as a possible mechanism for biological processes Authenrieth ; WIGGINS90 ; WIGGINS01 ; manuel ; debenedettibook . Therefore, in the debate about the essentiality of water for life could be relevant to understand which are the liquids that have density anomaly.
Since we have shown that the density anomaly implies the liquid-liquid phase transition when the liquid forms a correlated network of bonds, it is natural to ask if we can use the occurrence of a liquid-liquid phase transition as a signal of density anomaly. For example, recent experiments have shown a liquid-liquid phase transition in phosphorous Katayama ; Katayama04 ; Monaco and in triphenyl phosphite Kurita ; Kurita04 .
Apart from the clear evidences in phosphorous and triphenyl phosphite, experiments show data consistent with the possibility of a liquid-liquid phase transition in silica ANGELL ; Poole97 ; Lacks , carbon Thiel , aluminate liquids McMillan ; Wilding01 ; Wilding02 , selenium Brazhkin98 , and cobalt Vasin , among others McMillan ; Wilding01 ; Wilding02 ; McMillan2 . Moreover, computer simulations predict a liquid-liquid critical point for specific models of carbon G , phosphorous MORISHITA , supercooled silica ANGELL ; Poole97 ; Saika-Voivod ; Sastry-Angell , and hydrogen hydrogen , besides the commonly used models of water Poole ; geiger .
The strategy we follow, to explore if the occurrence of a liquid-liquid phase transition is sufficient for the density anomaly in a liquid, consists in looking at a simple model liquid with the liquid-liquid critical point and test for the density anomaly. To realize this investigation we use a model where the interaction between molecules depends only on their relative distance and not on their relative orientation.
This kind of model have been used to represent materials such as liquid metals hs1 ; STILLINGER ; Mon ; Silbert ; Levesque ; Kincaid ; Cummings ; Velasco ; Voronel , colloids or biological solutions Baksh . They have been proposed also to study anomalous liquids, such as water Head-Gordon93 ; debenedettibook ; jagla2 ; REZA ; Sadr99 ; Scala01 ; Scala00 .
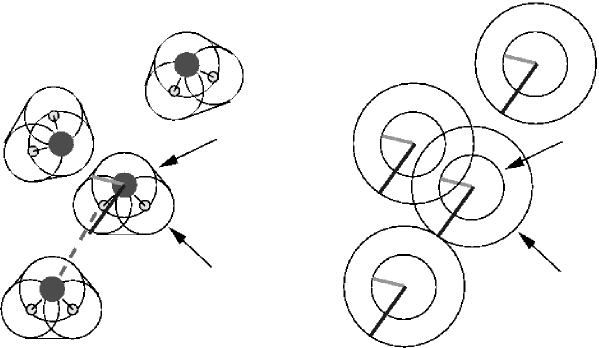
As we have seen, water has an open (at low and ) and a closed (at high and ) local structure mishima_2000 ; Soper-Ricci00 . The existence of these two structures with different densities suggests us a pair interaction with two characteristic distances. For example, in water the shortest distance could be associated with the minimum distance between two non hydrogen bonded molecules (closed structure). The largest distance would correspond to the average distance when the hydrogen bond is formed (open structure), as in Figure 6. The tendency to have an open structure, would correspond to a weak repulsion at lengths between the shortest and the largest distance. The energy gain for the hydrogen bond formation would attract the molecules at the the largest distance. We analyze this simple model with two characteristic interaction distances by means of numerical simulations and theoretical calculations.
V.1 Crystal open structure and polymorphism
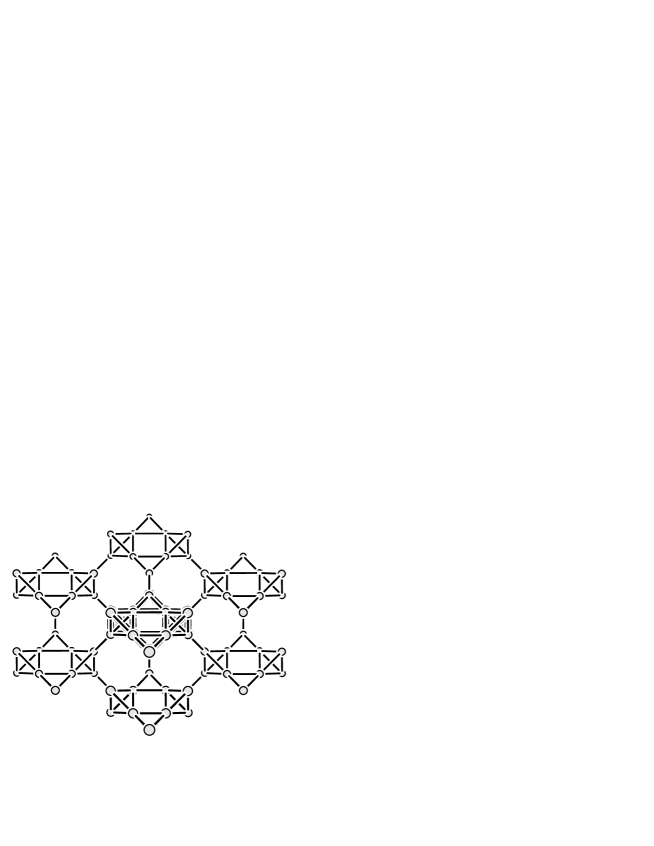
The first surprising result of our simulations is that this simple model is able to reproduce one of the most relevant features of water, i.e. a crystal open structure (Figure 7) fmsbs . The crystal has a complex unit cell of ten molecules, some at the shortest distance, other at the largest distance, with 8-fold and 12-fold symmetries.
This structure appears to be quite stable on a wide range of pressures and temperatures and is the only one we find by equilibrating the system with molecular dynamics simulations. However, since it does not correspond to the most compact configuration, we know that by increasing the pressure the system will ultimately take a (cubic or hexagonal) close packed form. Therefore, the model is able to reproduce the polymorphism typical of water-like substances. It has, at least, two crystals. A low density crystal at low and moderate densities and a high-density crystal at high densities (or pressures).
V.2 The liquid-liquid critical point
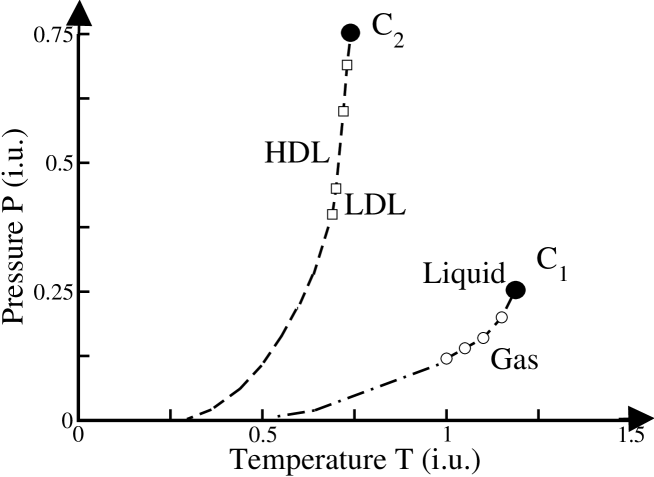
By supercooling the liquid we can avoid the crystal and study the metastable phase diagram below the melting temperature. Below the liquid-gas phase transition, ending in the liquid-gas critical point , we observe two liquids in the supercooled phase, roughly corresponding to the two crystals mentioned above (Figure 8).
The two liquids are separated by a liquid-liquid phase transition ending in a critical point nature ; fmsbs ; sbfms . Therefore, the presence of two length scales is enough to give rise to a phase diagram with two liquid phases, i.e. two liquids with different local structure. However, the slope of the liquid-liquid transition line is positive in the – phase diagram, consistent with a HDL with less entropy than the LDL, suggesting that this model is not describing a water-like system. Nevertheless, the model is appropriate to test if the liquid-liquid transition is sufficient for the density anomaly.
V.3 Condition for the liquid-liquid critical point
By varying the parameters of the model ruling the repulsion and the attraction, we find that the liquid-liquid critical point exists at positive pressures only in a finite range of parameters because its pressure decreases as the its temperature increases. We rationalize this result by using an approximate theoretical approach (a modified van der Waals equation) which qualitatively reproduces the behavior sbfms . Our study shows that not any liquid with two characteristic interaction distances can have a liquid-liquid phase transition, because a balance between attraction and repulsion is necessary.
Indeed, when the attraction is too strong the liquid-liquid phase transition goes to negative pressures, while when the attraction is too week, the liquid-liquid phase transition occurs in the deeply supercooled liquid phase, becoming difficult to observe, as in the experimental situation of water or silica ms98 ; fms ; Sastry-Angell . An extensive investigation, performed with a fast computational method (the integral equation approach in the hypernetted-chain approximation) allow us to quantify better this balance, in terms of the parameters of the model fmsbs ; mfsbs .
V.4 The density behavior
Once we fix the parameters of the model in such a way to satisfy the condition for the liquid-liquid phase transition, we test if the liquid has an anomalous behavior in density. Surprisingly, we find, by means of thermodynamic integration based on our simulation results, that the liquid has no density anomaly fmsbs ; sbfms .
This result excludes the possibility that the coexistence of two liquid phases, one with an open local structure and the other with a closed local structure, in a substance is sufficient for determining the anomalous behavior of density and the presence of a TMD line. Therefore, even if the density anomaly is not an exclusive property of water, since other substances such as silica show it, the solely presence of more than a liquid phase does not signal the occurrence of density maxima.
VI Outlook
Many open questions remain, and many experimental results are of potential relevance to the task of answering the question about the importance of water for life. For example, the dynamics of water could play a fundamental role in biological processes, such as determining the protein folding rate. Hydrophobic collapse and sharp turns (or bends) in polypeptide chains (groups of 50–100 amino acids) in the (secondary) structure of proteins involve the mediation of the water molecules in proximity to the amino acids Baron97 . Protein association could be determined by the the dynamics in the water hydration layer around appropriate amino acid residue sites Camacho00 . Interfacial water could rule the rate of recognition of binding sites of proteins by ligands, inhibitors, and other proteins Zou02 and the water dynamics at the surface of DNA and macromolecules is a promising field of research masaki ; Bagchi2005 .
In this context, it is unclear which could be the effect of the hypothesized second critical point. Is intruiguig to observe that the estimated temperature of 220 K for the liquid-liquid critical point of water ms98 coincides with the temperature below which the enzymatic activity of most proteins ceases Rasmussen92 ; Ferrand93 . This liquid-liquid phase transition is probably hindered by inevitable freezing fms . Indeed, it appears that the liquid-liquid phase transition is below, or at least close to, the glass transition temperature. A recent simulation analysis of the orientational dynamics of water at fixed density pradeep has shown that the temperature of dynamical arrest of the system, defined by the (mode coupling) theory MCT ; Gotze92 , is relatively close in temperature and density to recent estimate of the liquid-liquid critical point geiger .
The anomalous properties of water could be relevant for life in many ways. For example, trees survive arctic temperatures because the water in the cell does not freeze, even though the temperature is below the homogeneous nucleation temperature of -38∘C. This effect, due to the confinement of water, is related to the difficulty for the molecules to form an ordered hydrogen bond tetrahedral network.
The correlation of the hydrogen bonds forming the network is, indeed, the reason of the occurence of the liquid-liquid phase transition, whose necessity for water is supported by theoretical and numerical calculations fms ; slt . We find that the position of the liquid-liquid critical point depends on the strength of the hydrogen bond correlation. For example, if we assume uncorrelated hydrogen bonds Luzar-Chandler ; Luzar96 we find that the liquid-liquid critical point disappear at , giving rise to the singularity-free scenario. However, the hypothesis of a vanishing hydrogen bond correlation does not apply to water raiteri , ruling out the singularity-free scenario for H2O.
The ability of water to have an open and a closed structure, determines the existence of polyamorphs, the LDA, the HDA and the VHDA ice, each in a possible correspondence with, respectively, the LDL, the HDL and the very HDL (VHDL) shown by computer simulations b ; bs ; gss ; geiger ; w . Their different, and anticorrelated, specific volume and entropy, appears to be the feature that gives rise to the anomalous properties of water.
However, these properties are not exclusive of water. Other tetrahedrally-coordinated liquids have, at low temperature and low pressure, anticorrelated entropy and specific volume fluctuations. Examples of such systems are SiO2 and GeO2, known for their geological and technological importance. Recent simulations show, for example, that silica and silicon has a liquid-liquid critical point Saika-Voivod ; Sastry-Angell , while experiments show the occurrence of a liquid-liquid critical point in phosphorous Katayama ; Katayama04 ; Monaco and in triphenyl phosphite Kurita ; Kurita04 .
Interestingly, some properties of water, such as the polymorphism or the existence of a low-density open crystal, could be present also in substances without density anomaly, but with two liquids with different local structures. Since the change of local liquid structure could be relevant in biological processes Authenrieth ; WIGGINS90 ; WIGGINS01 ; manuel ; debenedettibook ; Bagchi2005 , the possibility of a wide class of liquids with this property could help in understanding if water is essential for life.
Acknowledgments
We thank our collaborators, S. V. Buldyrev, N. Giovambattista, P. Kumar, G. Malescio, M. I. Marqués, F. Sciortino, A. Skibinsky, and M. Yamada. We thank Chemistry Program CHE 0096892 and CHE0404673 for support. G. F. thanks the Spanish Ministerio de Educación y Ciencia (Programa Ramón y Cajal and Grant No. FIS2004-03454).
References
- (1) F. Franks, Biochemistry and Biophysics at Low Temperatures (Cambridge University Press, Cambridge, 1985).
- (2) L. J. Henderson, Fitness of the Environment: An Inquiry into the Biological Significance of the Properties of Matter (Macmillan, Basingstoke Hampshire, 1913).
- (3) P. G. Debenedetti, Metastable Liquids: Concepts and Principles (Princeton University Press, Princeton, 1996).
- (4) B. M. Cwilong, Proc. Roy. Soc. A 190, 137 (1947).
- (5) D. Rosenfeld and W. L. Woodley Nature 405, 440(2000).
- (6) H. Kanno, R. J. Speedy, and C. A. Angell Science 189, 881 (1975).
- (7) P. Brügeller and E. Mayer, Nature 288, 569 (1980).
- (8) O. Mishima, L. D. Calvert, and E. Whalley, Nature 314, 76 (1985).
- (9) O. Mishima, J. Chem. Phys. 100, 5910 (1994).
- (10) O. Mishima, Nature 384, 546 (1996).
- (11) Y. Suzuki and O. Mishima, Nature 491, 599 (2002).
- (12) O. Mishima and H. E. Stanley, Nature 396, 329 (1998); Nature 392, 164 (1998).
- (13) T. Loerting, C. Salzmann, I. Kohl, E. Mayer, and A. Hallbrucker, Phys. Chem. Chem. Phys. 3, 5355(2001).
- (14) J. L. Finney, D. T. Bowron, A. K. Soper, T. Loerting, E. Mayer, A. Hallbrucker, Phys. Rev. Lett. 89, 205503 (2002).
- (15) T. Loerting, W. Schustereder, K. Winkel, C. G. Salzmann, I. Kohl, and E. Mayer, Phys. Rev. Lett. 96, 025702 (2006).
- (16) P. Jenniskens, D. F. Blake, M. A. Wilson, and A. Pohorille, Astrophys. J. 455, 389 (1995).
- (17) http://exobiology.nasa.gov/ice/high.html
- (18) R. J. Speedy and C. A. Angell, J. Chem. Phys. 65, 851 (1976).
- (19) C. A. Angell, M. Oguni, and W. J. Sichina, J. Phys. Chem. 86, 998 (1982).
- (20) D. E. Hare and C. M. Sorensen, J. Chem. Phys. 87, 4840 (1987).
- (21) L. Pauling, The Nature of the Chemical Bond, and the Structure of Molecules and Crystals (Cornell University Press, Itacha, 1st ed. 1939, 2nd ed. 1940, 3rd ed. 1960).
- (22) D. Laage and J. T. Hynes, Nature 311, 832(2006).
- (23) A. K. Soper and M. A. Ricci, Phys. Rev. Lett. 84, 2881 (2000).
- (24) P. H. Poole, F. Sciortino, U. Essmann, and H. E. Stanley, Nature 360, 324 (1992).
- (25) H. E. Stanley and J. Teixeira, J. Chem. Phys. 73, 3404 (1980).
- (26) S. Sastry, P. G. Debenedetti, F. Sciortino, and H. E. Stanley, Phys. Rev. E 53, 6144 (1996).
- (27) I. Brovchenko, A. Geiger, and A. Oleinikova, J. Chem. Phys. 123, 044515 (2005).
- (28) E. Trinh and R. E. Apfel, J. Chem. Phys. 72, 6731 (1980).
- (29) M. I. Marqués, J. M. Borreguero, H. E. Stanley, and N. V. Dokholyan, Phys. Rev. Lett. 91, 138103 (2003).
- (30) B. F. Rasmussen, A. M. Stock, D. Ringe, and G. A. Petsko, Nature 357, 423 (1992).
- (31) M. Ferrand, A. J. Dianoux, W. Petry, and G. Zaccai, Proc. Natl. Acad. Sci. 90, 9668 (1993).
- (32) J. Higo, M. Sasai, H. Shirai, H. Nakamura, and T. Kugimiya, Proc. Nat. Acad. Sci. 98, 5961 (2001).
- (33) B. Bagchi, Chem. Rev. 105, 3197(2005).
- (34) P. G. Debenedetti, J. Phys.-Cond. Mat. 15, R1669 (2003).
- (35) G. Franzese and H. E. Stanley, J. Phys.-Cond. Mat. 14, 2201 (2002).
- (36) G. Franzese and H. E. Stanley, Physica A, 314, 508(2002).
- (37) G. Franzese, M. I. Marqués, and H. E. Stanley, Phys. Rev. E 67, 011103 (2003).
- (38) C. W. Kern and M. Karplus, in Water: A Comprehensive Treatise, Vol. 1, edited by F. Franks (Plenum Press, New York, 1972), pp. 21–91.
- (39) J. B. Hasted, Water: A Comprehensive Treatise, Vol. 1, edited by F. Franks (Plenum Press, New York, 1972), pp. 255–309.
- (40) K. Ichikawa, Y. Kameda, T. Yamaguchi, H. Wakita, and M. Misawa, Mol. Phys. 73, 79 (1991).
- (41) P. L. Silvestrelli and M. Parrinello, J. Chem. Phys. 111, 3572 (1999).
- (42) P. Raiteri, A. Laio, and M. Parrinello, Phys. Rev. Lett. 93, 087801 (2004).
- (43) P. A. Netz, F. Starr, M. C. Barbosa, and H. E. Stanley, J. Mol. Liq. 101, 159(2002).
- (44) C. A. Angell, S. Borick, and M. Grabow, J. Non-Cryst. Solids 207, 463 (1996).
- (45) P. H. Poole, M. Hemmati, and C. A. Angell, Phys. Rev. Lett. 79, 2281 (1997).
- (46) L. P. N. Rebelo, P. G. Debenedetti, and S. Sastry, J. Chem. Phys. 109, 626 (1998).
- (47) E. La Nave, S. Sastry, F. Sciortino, and P. Tartaglia, Phys. Rev. E 59, 6348 (1999).
- (48) F. Authenrieth, E. Tajkhorshid, K. Schulten, and Z. Luthey-Schulten, J. Phys, Chem. B 108, 20376 (2004).
- (49) P. M. Wiggins, Microbiological Reviews 54, 432 (1990).
- (50) P. M. Wiggins, Cellular and Molecular Biology 47, 735 (2001).
- (51) Y. Katayama, T. Mizutani, W. Utsumi, O. Shimomura, M. Ya-makata, and K. Funakoshi, Nature 403, 170 (2000).
- (52) Y. Katayama, Y. Inamura, T. Mizutani, M. Yamakata, W. Utsumi, and O. Shimomura, Science 306, 848 (2004).
- (53) G. Monaco, S. Falconi, W. A. Crichton, and M. Mezouar, Phys. Rev. Lett. 90, 255701 (2003).
- (54) H. Tanaka, R. Kurita, and H. Mataki, Phys. Rev. Lett. 92, 025701 (2004)
- (55) R. Kurita and H. Tanaka, Science 306, 845 (2004).
- (56) D. J. Lacks, Phys. Rev. Lett. 84, 4629 (2000).
- (57) M. van Thiel and F. H. Ree, Phys. Rev. B 48, 3591 (1993).
- (58) S. Aasland and P. F. McMillan, Nature 369, 633 (1994).
- (59) M. C. Wilding and P. F. McMillan, J. Non-Cyst. Solids 293, 357 (2001).
- (60) M. C. Wilding, C. J. Benmore, and P. F. McMillan J. Non-Cryst. Solids 297, 143 (2002).
- (61) V. V. Brazhkin, E. L. Gromnitskaya, O. V. Stalgorova, and A. G. Lyapin, Rev. High Pressure Sci. Technol. 7, 1129 (1998).
- (62) M. G. Vasin and V. I. Ladýanov, Phys. Rev. E 68, 051202 (2003).
- (63) P. F. McMillan, J. Mat. Chem. 14, 1506 (2004).
- (64) J. N. Glosli and F. H. Ree, Phys. Rev. Lett. 82, 4659 (1999).
- (65) T. Morishita, Phys. Rev. Lett. 87, 105701 (2001).
- (66) I. Saika-Voivod, F. Sciortino, and P. H. Poole, Phys. Rev. E 63, 011202 (2001).
- (67) S. Sastry and C. A. Angell, Nature Materials 2 739 (2003).
- (68) S. Scandolo, Proc. Nat. Acad. Sci. USA 100 3051 (2003).
- (69) G. Stell and P. C. Hemmer, J. Chem. Phys. 56, 4274 (1972).
- (70) F. H. Stillinger and T. Head-Gordon, Phys. Rev. E 47, 2484 (1993).
- (71) K. K. Mon, M. W. Ashcroft, and G. V. Chester, Phys. Rev. B 19, 5103 (1979).
- (72) M. Silbert and W. H. Young, Phys. Lett. A 58, 469 (1976).
- (73) D. Levesque and J. J. Weis, Phys. Lett. A 60, 473 (1977).
- (74) J. M. Kincaid and G. Stell, Phys. Lett. A 65, 131 (1978).
- (75) P. T. Cummings and G. Stell, Mol. Phys. 43, 1267 (1981).
- (76) E. Velasco, L. Mederos, G. Navascués, P. C. Hemmer, and G. Stell, Phys. Rev. Lett. 85 122(2000).
- (77) A. Voronel, I. Paperno, S. Rabinovich, and E. Lapina, Phys. Rev. Lett. 50, 247 (1983).
- (78) M. M. Baksh, M. Jaros, and J. T. Groves, Nature 427 139 (2004).
- (79) T. Head-Gordon and F. H. Stillinger J. Chem. Phys. 98, 3313 (1993).
- (80) E. A. Jagla, Phys. Rev. E 63, 061509 (2001).
- (81) M. R. Sadr-Lahijany, A. Scala, S. V. Buldyrev, and H. E. Stanley, Phys. Rev. Lett. 81, 4895 (1998).
- (82) M. R. Sadr-Lahijany, A. Scala, S. V. Buldyrev, and H. E. Stanley, Phys. Rev. E 60, 6714 (1999).
- (83) A. Scala, M. R. Sadr-Lahijany, N. Giovambattista, S. V. Buldyrev, and H. E. Stanley, Phys. Rev. E 63, 041202 (2001).
- (84) A. Scala, M. R. Sadr-Lahijany, N. Giovambattista, S. V. Buldyrev, and H. E. Stanley, J. Stat. Phys. 100, 97 (2000).
- (85) O. Mishima, Phys. Rev. Lett. 85, 334 (2000).
- (86) G. Franzese, G. Malescio, A. Skibinsky, S. V. Buldyrev, and H. E. Stanley, Phys. Rev. E 66, 051206 (2002).
- (87) G. Franzese, G. Malescio, A. Skibinsky, S.V. Bulderev, and H. E. Stanley, Nature 409, 692 (2001).
- (88) A. Skibinsky, S.V. Buldyrev, G. Franzese, G. Malescio, and H. E. Stanley, Phys. Rev. E 69, 061206 (2004).
- (89) G. Malescio, G. Franzese, A. Skibinsky, S. V. Buldyrev, and H. E. Stanley, Phys. Rev. E 71, 061504 (2005).
- (90) L. D. Baron and G. Wilson, Biochemistry 36, 13147 (1997).
- (91) C. J. Camacho, S. R. Kimura, C. DeLisi, and S. Vajda, Biophys. J. 78, 1094 (2000).
- (92) S. Zou, J. S. Baskin, and A. H. Zewail, Proc. Natl. Acad. Sci. 99, 9625 (2002).
- (93) P. Kumar, G. Franzese, S. V. Buldyrev, and H. E. Stanley, Molecular dynamics study of orientational cooperativity in water. preprint cond-mat/0510646, in print on Phys. Rev. E.
- (94) W. Götze, J. Phys.: Condens. Matter 11, A1 (1999).
- (95) W. Götze, L. Sjogren, Rep. Prog. Phys. 55, 241 (1992).
- (96) F. Sciortino, E. La Nave, and P. Tartaglia, Phys. Rev. Lett. 91, 155701 (2003).
- (97) A. Luzar and D. Chandler, Nature (London) 379, 55 (1996).
- (98) A. Luzar and D. Chandler, Phys. Rev. Lett. 76, 928 (1996).
- (99) I. Brovchenko, A. Geiger, A. Oleinikova, J. Chem. Phys. 118, 9473 (2003).
- (100) S. V. Buldyrev and H. E. Stanley, Physica A 330, 124–129 (2003).
- (101) N. Giovambattista, H. E. Stanley, and F. Sciortino, Phys. Rev. Lett. 94, 107803 (2005).
- (102) J. A. White, Physica A 346, 347 (2004).