(Ga,In)P: A standard alloy in the classification of phonon mode behavior
Abstract
Contrary to a broadly accepted assumption we show that random (Ga,In)P is not an exception with respect to the crude classification of the phonon mode behavior of random mixed crystals in terms of 1-bond1-mode systems or 2-bond1-mode systems, as established from the simple criterion derived by Elliott et al. [R.J. Elliott et al., Rev. Mod. Phys. 46, 465 (1974)]. Consistent understanding of the puzzling Raman/infrared behavior of (Ga,In)P, that has been a subject of controversy, is achieved via a basic version of our 1-bond2-mode model originally developed for (Zn,Be)-chalcogenides, that exhibit a large contrast in the bond properties, and recently extended under a simplified form to the usual (Ga,In)As alloy. The Raman/infrared features from (Ga,In)P are accordingly re-assigned, with considerable change with respect to the previous approaches. In particular the In impurity mode, previously assigned within (390 cm-1) the optical band of the host GaP compound (368–403 cm-1), is re-assigned below it (350 cm-1). Accordingly the Ga–P and In–P transverse optical branches do not overlap, which reconciles (Ga,In)P with the Elliott’s criterion. Besides, we show that the idea of two bond lengths per species in alloys, supported by our 1-bond2-phonon picture, opens an attractive area for the discussion of spontaneous ordering in GaInP2, and in mixed crystals in general. Essentially this is because it allows to play with the related competition effects regarding the minimization of the local strain energy due to the bond length mismatch between the parent compounds. In particular the unsuspected issue of intrinsic limit to spontaneous ordering comes out (0.5 in GaInP2). The whole discussion is supported by detailed re-examination of the (Ga,In)P Raman/infrared data in the literature, full contour modeling of the transverse and longitudinal optical Raman lineshapes via our phenomenological 1-bond2-mode model, and first-principles bond length calculations concerned with the minority bond species close to the impurity limits (Ga 0, 1) and to the Ga–P (Ga 0.19) and In–P (Ga 0.81) bond percolation thresholds. In the latter case we discriminate between connected and isolated bonds, not in the usual terms of next-nearest neighbors.
pacs:
63.50.+x, 78.30.Fs, 64.60.AkI INTRODUCTION
The long wave vibrational properties of (A,B)C semiconductor mixed crystals, where C denotes indifferently the anionic or the cationic species, are well-documented both experimentally and theoretically. This has lead to a crude classification of the phonon mode behavior of random mixed crystals in the Raman or infrared (IR) spectra in two categories.1 Most random mixed crystals exhibit the so-called 1-bond1-mode behavior. This corresponds to well-separated A–C and B–C transverse-longitudinal optical (TO–LO) bands over the whole composition range. These degenerate into distinct AC:B (B0) and BC:A (A0) impurity modes, and have strengths that scale as the corresponding fractions of bonds in the crystal. The remaining random alloys exhibit the so-called 2-bond1-mode behavior, also referred to as the mixed-mode behavior. This corresponds to a single TO–LO band with (A–C, B–C)-mixed character. The frequency range that the band covers shifts continuously from one end member to the other when the alloy composition changes, and the strength remains approximately constant throughout the whole composition range. In mixed-mode mixed crystals the impurity modes are expected to fall within the optical bands of the host lattices, and thereby a common believe is that they should not be observed as distinct and separate modes.2
A rather crude criterion is that for 1-bond1-mode behavior the TO-LO bands of the parent materials must not overlap. As a matter of fact the condition is too strong, but if overlap is large, the 2-bond1-mode behavior is always found. Elliott et al.3 derived a more accurate criterion, even though simple, based on the Coherent Potential Approximation. This is now the standard to decide about the 1-bond1-mode or mixed-mode behavior of the random mixed crystals. Basically for 1-bond1-mode behavior the relative change in the reduced mass of the bond induced by the impurity must be greater than the difference between the limit dielectric constants of the host lattice, normalized to the sum. It is worth to notice that this criterion neglects disorder in the force constants, only mass disorder is taken into account.
There would be only one fascinating exception that does not fit in the above classification of phonon mode behavior, i.e. (Ga,In)P.4 According to the Elliott’s criterion, random (Ga,In)P should exhibit a typical 1-bond1-mode behavior in the Raman/IR spectra. Elliott et al. emphasize that the larger the difference between the average mass of the substituting species on one side, and the mass on the unperturbed site on the other side, the more reliable their criterion. Precisely this is true for (Ga,In)P as both In (4th row in the periodic table) and Ga (3rd row) are much heavier than P (2nd row). As a matter of fact, the TO–LO bands from pure InP (303–345 cm-1) and pure GaP (368–403 cm-1) do not overlap. However, the 1-bond1-mode behavior does not show up in the Raman/IR spectra.
In the following we propose a brief survey of the extended vibrational information available for random (Ga,In)P in the literature, and of the different models, for clear insight upon the puzzling phonon behavior of this alloy. We proceed chronologically, for more clarity.
Lucovsky et al.5 have realized the first vibrational study of (Ga,In)P alloys, by using a combination of far-IR reflectance and Raman scattering on polycrystalline samples. They observed a main TO–LO band that behaved as expected in case of a mixed-mode behavior (refer above). In addition a minor TO-LO band was evidenced within the main TO-LO band. Surprisingly the minor LO mode shows up at lower frequency than the TO counterpart, which discouraged an assignment of the minor TO-LO band in terms of a zone-center signal. This was rather attributed to zone-edge modes. The authors concluded that (Ga,In)P was the first example of a mixed-mode behavior among III–V’s. The impurity modes were tentatively located at 330 cm-1 (GaP:In) and 390 cm-1 (InP:Ga), i.e. within the optical bands of the host lattices.
Beserman et al.6 have reported an exhaustive Raman study of a large amount of polycrystalline (Ga,In)P alloys made of small pieces of single crystals. The whole composition range could be analyzed. Both the TO and LO modes were allowed in their scattering geometries. First, Beserman et al. showed that the minor TO–LO band persists all the way from the intermediate composition range down to both the Ga- and In-dilute limits. In addition the authors could perform proper LO symmetry analysis by using a convenient piece of single crystal with small In content (0.04). Somewhat surprisingly the minor LO mode, localized at 390 cm-1, was found to be highly polarized, just as the main zone-center LO mode. The apparent zone-center 2-modes LO behavior at small In content was attributed to a splitting of the nominal zone-center LO mode due to coupling with two-phonon combinations from the zone-edge. Besides, Beserman et al. derived decisive information in the TO symmetry, which we detail below [refer to point (i)].
Jahne et al.7 discussed the minor TO-LO band as an individual zone-center response, which made it difficult to cover the mixed-mode behavior. For modeling of their IR spectra obtained with polycrystalline (Ga,In)P ingots, Jahne et al. used a version of the cluster model originally developed by Verleur and Barker to account for the complex Raman/IR spectra of Ga(As,P)8 and Cd(S,Se)9, that were attributed to local segregation effects. In this model the entire mixed crystal is built up from five basic units corresponding to the possible first-neighbor arrangements around the unperturbed site. Basically the minor TO–LO band would have its origin in the change of the Ga–P force-constant from one type of basic unit to another. However, a model with potentially four oscillators per bond species in the alloy seems oversized to account for a single additional mode in the Raman/IR spectra.
At this stage further discussion of the phonon mode behavior of (Ga,In)P clearly required deeper insight upon the impurity modes. Careful Raman investigation of (Ga,In)P samples in the Ga- and In-dilute limits was achieved by Jusserand and Slempkes10 (JS) and Kato et al.,11 respectively. For this purpose a new generation of samples with well-defined symmetry was used, i.e. (Ga,In)P samples grown as epitaxial layers or single crystals.
JS did perform Raman measurements with mostly In-rich (Ga,In)P epitaxial layers. They have used a standard backscattering geometry along the [001]-growth axis. With this geometry only the LO modes are allowed, the TO modes are forbidden. JS did observe the progressive emergence of the GaP-like LO line on the high-frequency side of the dominant InP-like LO line from very low Ga incorporation (0.1%). The InP:Ga impurity mode was accordingly identified as a distinct mode at 2 cm-1 above the InP LO mode, contrary to first expectations. Interestingly, JS noted that the In–P and Ga–P lines exhibit similar strengths for as small Ga incorporation as 1.5%. This was attributed to some coupling between the two LO modes, due to their vicinity. However, the discussion remained qualitative only, and the physical mechanism behind was not identified.
With the InP:Ga impurity mode being out of the InP optical band, as for a typical 1-bond1-mode system, and the GaP:In impurity mode being within the GaP optical band, as for a mixed-mode system, a strong overlapping of the Ga-P and In-P bands is expected in the alloy, resulting in a complicated phonon behavior. JS10 proposed that (Ga,In)P is an exceptional alloy in the classification of phonon mode behavior. It would obey the so-called modified 2-mode behavior, with a dominant TO mode at low-frequency that joins the InP (303 cm-1) and GaP (368 cm-1) parent TO modes, and a minor TO mode at high-frequency that connects the InP:Ga (347 cm-1) and GaP:In (390 cm-1) impurity modes.
Kato et al.11 performed a thorough Raman study of (Ga,In)P single crystals and epitaxial layers covering the whole composition range, with special emphasis upon the Ga-rich side. They could confirm the existence of a quasi-degenerate TO-LO mode at 390 cm-1 in the In-dilute limit, which at first sight supported the original assignment in terms of the GaP:In impurity mode, and thereby the phonon picture proposed by JS. Interestingly, we note from their exhaustive data that the TO mode at high-frequency, earlier referred to as the minor TO mode, does not seem so ‘minor’. In particular close to the stoichiometry (In0.5) the low- and high-frequency TO modes have similar strengths (refer to fig. 5 in Ref. 11). This has attracted little attention so far.
In the past decade most of the attention was focused on Ga0.51In0.49P, abbreviated GaInP2 for simplicity, which has become the leader material for the study of spontaneous ordering in semiconductor mixed crystals.4 Precisely to close this brief overview we mention the reference first-principles calculations of the transverse phonon density of states (DOS) in disordered GaInP2, recently performed by Ozolinš and Zunger (OZ).12,13 A theoretical dielectric function was derived for pre-insight upon the TO Raman lineshapes, via . What emerged is that the dominant TO mode around 330 cm-1 involves both Ga–P and In–P vibrations, as expected. Our view is that such behavior is consistent with the mixed-mode description as well as with the modified 2-mode alternative, as proposed by Lucovsky et al. and JS, respectively. Also, OZ derived decisive insight upon the minor TO mode, which is summarized below [refer to point (ii)].
Following JS the consensus so far is that random (Ga,In)P exhibits the modified 2-mode behavior in the Raman/IR spectra, which contradicts the Elliot’s criterion. In addition the modified 2-mode picture fails to explain two key TO features that have attracted little attention so far:
(i) the dominant TO mode exhibits a marked antagonist asymmetry on each side of the stoichiometry (Ga 0.5), as detected by Beserman et al. by using Raman scattering (see Fig. 2 in Ref. 6). This was attributed to a Fano interference with the disorder-induced combination of transverse (TA) and longitudinal (LA) acoustical modes at the zone-edge, that was assumed to be at higher frequency than the zone-center TO mode in pure InP, as opposed to GaP. However, later measurements of the phonon dispersion in InP invalidate this mechanism. Indeed the TA()+LA() acoustical combination was found below the zone-center TO mode in InP (Ref. 14), as in GaP (Ref. 15).
(ii) the minor TO mode in disordered GaInP2 has a GaP-like character, as shown by OZ in their first-principles calculations (see Fig. 3-a in Ref. 12). This, in particular, is challenging for the modified 2-mode picture, as the latter implies a (Ga–P, In–P)-mixed character for both the dominant and the minor TO modes, at any alloy composition.
In this work we investigate whether our 1-bond2-mode picture, earlier referred to as the ‘percolation’ picture, may provide consistent understanding of the puzzling phonon behavior of (Ga,In)P, which is still lacking. This picture was originally developed for the long-wave phonons of (Zn,Be)-chalcogenides,16 that opened the class of mixed crystals with contrast in the bond force constant, and has been extended recently to (Ga,In)As, with much success.17
The key issue when considering the physical properties of random (A,B)C mixed crystals is how to handle the problem of alloy disorder. Certainly the most convenient way is to describe the system in terms of the virtual crystal approximation (VCA). Accordingly each atom C from the unperturbed site is ideally surrounded by four virtual nearest neighbors, each of these consisting of a statistical average of the A and B substituting species depending on the alloy composition. This way perfect order is artificially re-built in the crystal, where it does not exist in reality, so that the approaches finalized at the microscopic scale for the basic understanding of the physical properties of the perfectly ordered parent compounds can be directly extended to the alloys. Regarding vibrational properties, such an approach leads to the idea that each bond in the alloy should bring a single feature in the Raman/IR spectra, as in the corresponding parent compound, but with characteristics (strength, frequency) depending on the alloy composition. This corresponds to a typical 1-bond1-mode behavior in the Raman/IR spectra, as accounted for by the well-admitted modified-random-element-isodisplacement (MREI) model developed by Chang and Mitra,1 based on a VCA description of the mixed crystals. Provided some adjustment is made, this model also accounts for the mixed-mode behavior.2
While the VCA seems actually relevant for the integral physical properties of semiconductors, that operate a natural average on alloy disorder, such as the band gap or the lattice constant, our view is that it should not apply to vibrational properties because these address directly the bond force constant, which is a local physical property. We claim that their basic understanding requires detailed insight upon the local neighborhood of the substituting species, which falls into the scope of the percolation site theory.18 Essentially this is concerned with the statistical properties (population, internal structure, …) of clusters formed by sites occupied at random on a regular lattice. While there is an obvious analogy between the topology of such systems and the topology of the random mixed crystals, we note that the concept of percolation remains basically outside the schemes used for the very basic understanding of the routine physical properties of mixed crystals.
In our 1-bond2-mode picture for the Raman/IR spectra of the random (A,B)C mixed crystals we describe these as true composite media made of two coexisting A-rich and B-rich regions, resulting from natural fluctuations in the alloy composition at the local scale. This way the alloy disorder is explicitly recognized, while it was totally eclipsed with the MREI-VCA description. Separate resolvable phonon modes are envisioned for each bond species, corresponding to the different force constants experienced in each of the A-rich and B-rich regions. In particular our phenomenological model envisages singularities in the bond force constant, and thereby in the phonon behavior, at the bond percolation thresholds. We remind that the bond percolation thresholds are the critical compositions corresponding to the first formations of pseudo-infinite chains of the B–C and A–C bonds in the A1-xBxC crystal. By using computer simulation based on random substitution on the (A,B) cfc sub-lattice, these were estimated by Stauffer as 0.19 and 0.81, respectively.18 By crossing the percolation threshold the host region undergoes a dispersionpseudocontinuum topological transition. As a matter of fact a singularity at the bond percolation threshold was clearly observed in the Raman spectra of the reference (Zn,Be)Se (see Fig. 1 in Ref. 16) and (Zn,Be)Te19 systems. The nature of the singularity is briefly discussed in Sec. II. It was tentatively discussed in terms of the different internal structures of the dispersion and the pseudocontinuum, as predicted by the percolation site theory. Detail is given in Ref. 17. It is worth to notice that a similar singularity at the bond percolation thresholds was also observed by Bellaiche et al.20 in their first-principles calculations dedicated to another local physical property of random mixed crystals, i.e. the bond length. There again the singularity was discussed in terms of a percolation behavior.
The microscopic mechanism for the 1-bond2-mode behavior in the Raman/IR spectra was previously identified as the difference in bond length due to the different local bond distortions according to whether the bonds belong to the randomly formed A-rich or B-rich regions.21 On this basis the larger the contrast between the bond lengths, the more clearly the 1-bond2-mode behavior is expected to show up in the Raman/IR spectra. In fact the contrast is large for (Ga,In)P, as detailed below. At this stage, let us emphasize that our 1-bond2-phonon picture can not be derived from the Elliott’s criterion because the latter considers mass disorder only, not disorder in the force constant.3
Basically we expect two well-separated phonon branches for the Ga-based bond and two tight ones for the In-based bond in (Ga,In)P, as for (Ga,In)As.17 Actually (Ga,In)As can be used as a reference for the study of alloying effects on the phonon properties of (Ga,In)P, because the substituting species are the same, hence a similar contrast in the bond properties and thereby similar local bond distortions in the mixed crystals, with concomitant impact upon the phonon frequencies. While P has a smaller covalent radius (1.06 Å) than As (1.20 Å), so that the P-based bonds are shorter/stiffer than the As-based ones, the contrasts between the bond lengths () and the bond stiffness, best described by the ratio between the bond stretching () and the bond bending () force constants, remain similar in (Ga,In)As (6.3%, 28.1%) and (Ga,In)P (7.1%, 34.3%),22 the Ga-based bond being shorter/stiffer. Besides, we have checked that (Ga,In)As is classified as a 1-bond1-mode system according to the Elliott’s criterion, as (Ga,In)P.
We discuss the TO modes mainly, because these consist of purely mechanical vibrations, i.e. quasi-independent oscillators, and thereby carry reliable strength/frequency information on each oscillator. We have shown in earlier work that proper investigation of the 1-bond2-mode behavior via the raw LO Raman data is basically hopeless due to strong coupling between neighbor individual LO modes via their common long range polarization field .16 Accordingly our LO study here entirely proceeds from the safe TO modes.
The paper is organized as follows. In Sec. II we remind briefly the basis of our phenomenological 1-bond2-mode picture for contour modeling of the (Ga,In)P Raman lineshapes, and we outline the ab initio calculations that we implement to support our corresponding re-assignment of the Raman/IR features. In Sec. III our attention is focused on the phonon behavior of random (Ga,In)P. In Sec. III-A we re-assign the GaP:In impurity mode below the GaP TO–LO optical band from careful re-examination of the Raman/IR data in the literature, and propose on this basis a simple version of our 1-bond2-phonon picture that applies to random (Ga,In)P. In Sec. III-B we perform ab initio calculations of the bond length distribution of the minority bond species in large (Ga,In)P supercells corresponding to alloy compositions close to the dilute limits and to the In–P (In 0.19) and Ga–P (In 0.81) bond percolation thresholds. We discriminate between connected and isolated bonds, not in the usual terms of next-nearest neighbors. The ab initio calculations are used to validate our novel assignment of the GaP:In impurity phonon mode, and to provide qualitative insight upon the magnitude of the phonon splitting within each of the Ga–P and In–P double-branches. In Sec. III-C we show that our model provides consistent understanding of the whole phonon behavior of random (Ga,In)P, as summarized in Sec. I. In Sec. IV we tackle the key issue of spontaneous ordering in GaInP2 on this novel basis. We propose a possible mechanism that accounts for the disconcerting evolution of the Raman/IR lineshapes with increasing ordering. Conclusions are outlined in Sec. V.
II PHENOMENOLOGICAL MODEL AND FIRST-PRINCIPLES CALCULATIONS
First, we outline briefly, for more clarity, the technical aspects of our phenomenological 1-bond2-mode model for long wave phonons in random zincblende A1-xBxC mixed crystals. Extensive detail is given elsewhere.16
We start with the frequency aspect. Schematically, our view is that for each bond species the TO response over the whole composition range consists of two quasi-parallel branches tied up to the corresponding parent and impurity modes at the two ends of the composition range, and separated by a characteristic finite frequency gap in the dilute limits. Somewhat surprisingly, for a given bond species, the bonds are longer (shorter) within the host region that refers to the parent material with the smaller (larger) lattice constant. This was explained in detail elsewhere, based on first-principles bond length calculations in the two host regions.21 Now, the shorter the bond length, the larger the bond force constant, and thereby the phonon frequency. Accordingly within each double-branch the low (high) frequency branch refers to the host region with the parent material corresponding to the smaller (larger) lattice constant.
Now we come to the singularity in the bond force constant at the bond percolation thresholds, as mentioned in Sec. I. Basically, for each individual TO branch the model envisages two different regimes on each side of the bond percolation threshold to which the host region refers: one in which the optical mode of the most dilute substitutional species vibrates with a frequency that is basically independent on its concentration (regime 1), and one in which the frequency of the same mode depends smoothly on the alloy composition according to a traditional but ‘rescaled’ modified-random-element-isodisplacement (MREI) description (regime 2).
We turn next to the strength aspect. A very general trend is that the oscillator strengths and Faust-Henry coefficients from the overall A–C and B–C signals in the Raman/IR spectra do scale as the fraction of the related oscillators in the A1-xBxC alloy, i.e. as and , respectively.1 These are referred to as the global weighting factors. Now, simple symmetry considerations guarantee that in case of random substitution the scattering volumes from the A-rich and B-rich regions scale as and , respectively. These are referred to as the individual weighting factors. They fix the sharing of the available oscillator strength and Faust-Henry coefficient within each double-branch. Eventually the multiplication of the global and individual weighting factors determines the relative strength of the four TO modes (2 AC-like and 2 BC-like) in the Raman/IR spectra.
Once the two double-branches are properly set, full contour modeling of the multi-phonon Raman lineshapes is eventually achieved on the above frequency/strength basis, while using no adjustable parameter, by using the generic equation
| (1) |
The TO modes are obtained from the imaginary part of the second term, while the full expression provides the LO modes. Here, the summation runs over the relevant number of oscillators, that may be smaller than four, depending on the alloy (see Sec. III).
, and are defined on a per-oscillator basis and are, respectively, the Faust-Henry coefficient of the -mode, its TO frequency squared, and its related Lorentzian responses. is defined according to the standard MREI notations;1 it relates to the oscillator strength , and thereby to the (TO-LO)p-splitting. and are normalized to the fraction of -oscillators in the crystal with respect to the corresponding parent values. is the relative dielectric function of the mixed crystal in a form generalized to multi-oscillators, as established according to the standard MREI scheme.
In our model, once the TO phonon double-branches of the Ga–P and In–P bonds are properly set, the Raman/IR lineshapes are entirely determined. Each double-branch is fixed by two parameters only on top of the frequency of the parent TO mode, i.e., the magnitude of the phonon splitting , and the frequency of the impurity mode. For clear insight upon these two key parameters in (Ga,In)P we determine a representative distribution of bond lengths, that we have done in a first-principles supercell calculation. We applied the calculation method and the computer code SIESTA,23,24 and allowed full relaxation (of lattice parameters along with internal coordinates) in a prototype ‘percolation-threshold’ supercell similar to that used in Ref. 21, along with ‘dilute limit’ supercells. We used the local density approximation throughout. If comparing with previous calculations for the (Ga,In)P system, by OZ12,13, we used the same type of norm conserving pseudopotentials (constructed along the Troullier-Martins scheme, see Ref. 25), as OZ, specifically using the following configurations and pseudoization radii (in brackets, in Bohr): Ga 4(2.00) 4(2.00) 3(1.78), In 5(2.19) 5(2.48) 4(1.68), P 3(1.83) 3(1.83) 3(1.83). However, we used a different basis set (localized atom-centered functions, vs. planewaves as by OZ), and larger supercells (of 64 atoms, vs. a maximum of 16 by OZ). Generally, care must be taken that our bond length calculations are strictly valid only at zero temperature, which might generate slight discrepancy with respect to room temperature, of present interest here.
III ONE-BONDTWO-PHONON PICTURE FOR RANDOM (Ga,In)P
According to the general criterion of localization derived by Anderson,26 the condition for clear observation of the 1-bond2-phonon behavior in the Raman/IR spectra of random (Ga,In)P is that the Ga-rich and In-rich environments generate fluctuations in the TO frequency that are typically larger than the reference TO dispersion in the parent material. Precisely the TO mode in GaP is nearly dispersionless, with a difference between the frequencies of the zone-center and zone-edge () TO modes of 1.5 cm-1 (Ref. 15). This brings a much favorable context for the observation of a 1-bond2-phonon behavior in the Ga-P spectral range. In contrast the same frequency difference is rather large in InP, of 20 cm-1 (Ref. 14). Actual phonon localization in the In–P spectral range would require extremely large fluctuations in the TO frequency, and thereby in the In-P bond length. However, by analogy with (Ga,In)As17 this is rather unlikely.
On the above basis we are lead to describe random (Ga,In)P as a three-oscillator [1(In–P), 2(Ga–P)] phonon system, in a first approximation.
III.1 TO picture
We propose the 1-bond2-mode TO picture outlined in Fig. 1 for the random GaxIn1-xP alloy (thick lines), from careful re-examination of the available Raman/IR data in the literature; details are given below. It consists of three quasi-parallel branches: two well-separated Ga–P branches that converge in the dilute limits, above two In–P branches so tight (dashed lines) that they merge into an overall In–P branch. The high and low-frequency Ga-P branches refer to Ga–P vibrations within the In-rich and Ga-rich regions, respectively (refer to Sec. II). The TO modes are accordingly labeled as TOIn-P, TO and TO with increasing frequency, where the superscript refers to the host region. For each individual Ga–P branch the so-called regime 2 (refer to Sec. II) is ideally modeled as a straight line, in the first approximation. We have checked that the proper re-scaled MREI curves exhibit a bowing of merely 1 cm-1. Regarding the strength aspect, the TOIn-P, TO and TO modes scale as the corresponding fractions of bonds in the alloy, i.e. as , and , respectively (refer to Sec. II). The relative strengths of the different TO modes are explicitly indicated in Fig.1, for more clarity. The Ga–P and In–P TO double-branches do not overlap in our description, which reconciles (Ga,In)P with the Elliott’s criterion.
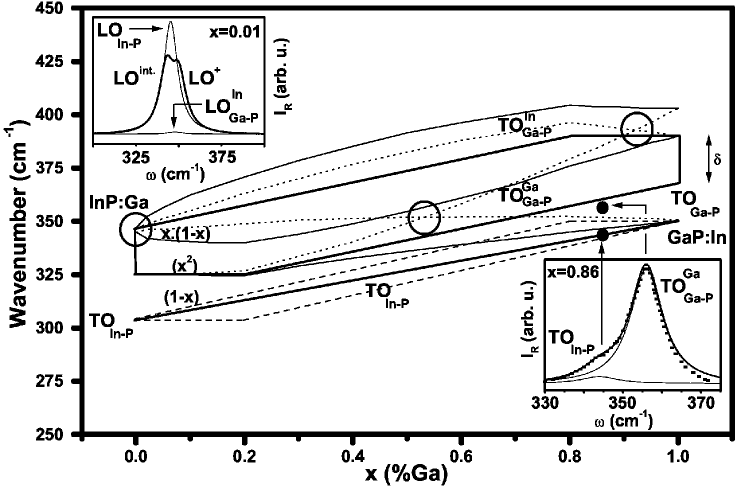
From Fig. 1 we re-assign the s-called minor and dominant TO modes in the Raman/IR spectra as the TO mode and the sum of the nearby TOIn-P and TO modes, respectively. Accordingly the minor TO mode is GaP-like, as predicted by the first-principles calculations of OZ12,13 [refer to point (ii) above]. Also, the strengths of the nearby TOIn-P and TO modes vary in opposite sense versus the Ga-content , which accounts for the antagonist asymmetry of the sum at large and small values as detected by Beserman et al. by using Raman spectroscopy [refer to point (i) above]. More quantitative insight is given in Sec. III-C.
On top of the parent TO–LO bands three empirical parameters were used to build up the entire 1-bond2-mode picture: the frequencies of the GaP:In and InP:Ga impurity modes, as for the more simple 1-bond1-mode MREI picture,1 plus the Ga–P splitting, noted .
We have taken 22 cm-1 corresponding to the frequency gap between the dominant (368 cm-1) and the minor (390 cm-1) TO modes close to the In-dilute limit, as accurately measured by Kato et al. by using Raman spectroscopy.11 This fixes directly the profile of the whole TO branch once the singularity at the In–P bond percolation threshold is taken into account (refer to Sec. II). The TO branch is derived by symmetry, as expected in case of a random Ga substitution to In over the whole composition range.16 On this basis a typical phonon splitting of 33 cm-1 should be observed between the two Ga–P TO modes at the stoichiometry, in remarkable agreement with the value of 35 cm-1 found by OZ via first-principles calculations (refer to Figs. 3 from Refs. 12-13).
The location of the InP:Ga impurity mode at 347 cm-1, as detected by JS10 by using Raman spectroscopy, is not questioned at this stage, owing to the strong experimental support. On the other hand we re-assign the GaP:In mode below the GaP optical band, i.e. at 350 cm-1. This is estimated from linear extrapolation of the TOIn-P frequency from the bulk (303 cm-1) to the In-dilute limit, passing through an intermediary value (dot in Fig. 1) measured close to the In-dilute limit for more accuracy. This is adjusted so as to achieve full contour modeling of the experimental (TOIn-P + TO) Raman signal as obtained by Kato et al. at the In content of 0.14 (refer to the bottom spectrum from Fig. 6 of Ref. 11), the other parameters being otherwise fixed by the 1-bond2-mode model. Technical detail is given in Sec. III-C. The same phonon damping was taken for the two modes. The best fit, obtained for (In–P)=344 cm-1, is superimposed to the experimental curve in the bottom inset of Fig. 1, for comparison.
III.2 Validation via first-principles calculations
Clear theoretical insight upon the phonon behavior of random (Ga,In)P was derived by OZ12,13 at the representative alloy composition corresponding to the stoichiometry, which was much helpful to build up our TO phonon picture displayed in Fig. 1 [refer to point (ii) above]. Additional phonon calculations at other alloy compositions are of little interest for our purpose because the relative positions of the three TO modes is not expected to be much dependent on the alloy composition, as can be inferred from Fig. 1. What we rather need to fully validate Fig. 1 is complementary bond length information close to other critical alloy compositions, i.e. the bond percolation thresholds and the dilute limits, as detailed below. We address two issues.
First, we need direct evidence that the GaP:In impurity mode stays below the GaP optical band, not within (390 cm-1) as is currently admitted. For direct insight we achieve full relaxation of a (Ga,In)P supercell containing one In atom only out of 32 cations (In 3 at.%). The single-site In substitution to Ga shortens the In–P bond length from 2.540 Å in the pure InP crystal to 2.485 Å because the In impurity has to fit into the GaP-like host media characterized by a smaller bond length. The key point is that the local In–P compression is hydrostatic here. Accordingly, while explicit ab initio calculations of the phonons either by the linear response, as was done by OZ,12,13 or by the frozen phonon scheme, as in Ref. 21, are the obliged way to get theoretical phonon insight out of the dilute limits, where the individual bonds undergo complex bond distortions, they are not required here in a first approximation. Instead we simply estimate the expected shift in the square TO frequency due to the local compression via the Grüneisen parameter 1.440.02, as measured from the frequency-dependence of the zone-center TO mode of pure InP under hydrostatic pressure.27 We use the relation28
| (2) |
where is the relative change in the bond length. This yields the estimate of 3300.6 cm-1 for the displaced frequency of the GaP:In impurity mode, i.e. even lower than the measured value (350 cm-1).
We have performed similar bond length calculations by using the same supercell but with Ga and In interchanged. 1.090.03 for pure GaP27 so that the observed lengthening of the Ga–P bonds from 2.360 Å in pure GaP to 2.393 Å, due to outward hydrostatic relaxation of the four P neighbors around the Ga impurity, yields the expected frequency 3500.05 cm-1 for the InP:Ga impurity mode, in very good agreement with the actually measured value (347 cm-1, see Ref. 10). This validates our procedure to estimate the impurity-related phonon frequencies.
As the second issue we need evidence of a 1-bond2-mode bond length distribution, that would mirror the 1-bond2-mode phonon behavior. Basically the bond length distribution must be narrow for the In-P bond, and well-resolved for the Ga-P one. Also, the short (long) bonds must refer to the In-rich (Ga-rich) region, for each species. To address these aspects we consider the minority bond species close to the Ga–P (In0.81) and In–P (In0.19) bond percolation thresholds, where it is easy to figure out the Ga-rich and In-rich regions. We use our prototype (Zn,Be)Se supercell of Ref. 21, with 4 impurity atoms connected in a straight wall-to-wall chain plus 2 isolated impurities. The Ga and In atoms are interchanged for the In-poor and Ga-poor configurations. In the Ga-poor supercell the connected and isolated Ga-P bonds refer to the Ga-rich and In-rich regions, respectively. The situation is reversed for the In-P bonds in the In-poor supercell.
First, we consider the Ga-poor supercell. We obtain an overall bi-modal bond length distribution for the stiff-short Ga-P bond (not shown) that mimics the Be-Se reference in (Zn,Be)Se (refer to Fig. 4 top-left in Ref. 21), as expected. Only, the distributions of the isolated and connected bonds are re-centered close to the bond length of pure GaP, i.e. at 2.383 Å and 2.402 Å, respectively. The bond length difference is 8‰, which has to be related to 22 cm-1 on the phonon side, as detailed above. Remarkably, 0 for the Ga–As bond in (Ga,In)As, while the difference in the Ga–As bond length reaches 1%.17 This is consistent with our present view that for a given local bond distortion increases with the bond stiffness. This statement is based on our earlier observation in the reference (Zn,Be)VI systems that similar changes in the Be–VI (2%) and Zn–VI (1%) bond lengths according to whether the bonds belong to the Be-rich region or the In-rich one generate a much larger phonon shift, i.e. a much larger change in the bond force constant, for the stiff Be–VI bond (8.5% of the TO frequency in pure BeVI) than for the soft Zn–VI one (1% of the TO frequency in pure ZnVI).17 On this basis we anticipate a large value for the Ga-N bond in zincblende (Ga,In)N, with larger contrast in the bond properties as (Ga,In)As and (Ga,In)P, i.e. (9.5%, 41.7%). This is an unexplored issue.
In the In-poor supercell the connected In–P bonds are shorter (2.487 Å) than the isolated (2.493 Å) ones, as expected. Also, the difference in bond length is small, i.e. 2‰, as for the reference In–As bond in (Ga,In)As.17 We expect that the corresponding small phonon splitting is screened by the large TO dispersion in InP (20 cm-1), and/or by the phonon damping. This justifies a posteriori our approximation of an apparent 1-bond1-mode behavior in the Raman response of the In-P bond in Fig. 1.
III.3 Raman lineshapes of random (Ga,In)P
Full contour modeling of the Raman lineshapes of random (Ga,In)P is achieved by using the reduced (TO) and extended (LO) forms of Eq. (1) from the frequency/strength information displayed in Fig. 1. The other input parameters are the Faust-Henry coefficients of GaP (0.53, Ref. 29) and InP (0.46, Ref. 30) and the parent oscillator strengths, as derived according to the traditional MREI scheme from the parent TO-LO optical bands and the values of GaP (8.45, Ref. 2) and InP (9.53, Ref. 30). Now we compare the raw theoretical lineshapes with the Raman data and first-principles phonons calculations available in the literature. We emphasize that no adjustable parameter is used in our phenomenological calculations.
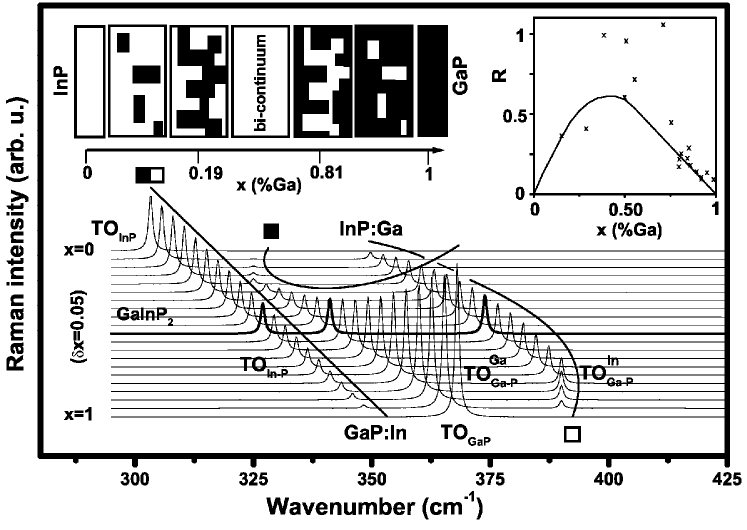
The theoretical TO Raman lineshapes are shown in Fig. 2. A small phonon damping of 1 cm-1 is taken for a clear overview of the whole collection of individual modes. In particular Fig. 2 provides straightforward insight upon the puzzling antagonist asymmetry of the dominant (TOIn-P + TO) mode on each side of the stoichiometry, as detected by Beserman et al. [refer to point (i) above]. Remarkably the nearby TOIn-P and TO modes have similar strengths at the stoichiometry, as ideally expected. The difference is less than 10% to the advantage of the GaP-like mode, in close agreement with the zone-center TO density of states derived by OZ in their first-principles calculations (see Fig. 3-a in Ref. 12). We note that the relative strength of their TO mode at 370 cm-1 is small with respect to our prediction, apparently due to overdamping. Otherwise the variation of our theoretical strength ratio between the TO mode (minor) and the (TOIn-P + TO) mode (dominant) versus the Ga-content fairly reproduces the experimental curve obtained by Kato et al. from their exhaustive Raman data (see Fig. 5 in Ref. 11), as shown in the inset of Fig. 2. In particular the different slopes observed in the dilute limits are rather well-reproduced by our model. To the best of our knowledge this is the first attempt to put a model on these data.
Now we discuss briefly the LO modes. -coupling is explicitly allowed in our phenomenological model by taking a single dielectric function for the three-oscillator system. This tends to generate a single ‘giant’ oscillation that receives most of the available oscillator strength, thereby blue-shifted from the rest of the series.16 Three LO features are obtained but these have (In–P, Ga–P)-mixed character, which results in a strong distortion of the overall LO signal with respect to the reference uncoupled LO lines. Examples are given in sec. IV. The mixed LO features are simply labeled as LO-, LOint. and LO+ with increasing frequency, where superscript ‘int.’ stands for ‘intermediary’. The uncoupled LO lines are calculated via Eq. (1) also, but by taking separate dielectric functions for each oscillator, i.e. by treating each oscillator independently. They are referred to as LOIn-P, LO and LO hereafter, by analogy with the TO counterparts. The variations of the frequencies of the coupled and uncoupled LO modes versus the Ga-content x are displayed as thin and dotted lines in Fig. 1, respectively.
In particular the LO- mode is systematically weak, and remains confined between the TOIn-P and TO phonon branches when the alloy composition changes. In analyzing the LO-allowed Raman spectra obtained with the traditional backscattering geometry along the [001]-growth axis of the now available (Ga,In)P epitaxial layers, we suspect that this mode was previously mistaken as the parasitical activation of the dominant TO mode (theoretically forbidden), the result of breaking in the Raman selection rules induced by the alloy disorder.
Also, we identify the minor optical band detected by Lucovsky et al. in their pioneer IR measurements (refer to Sec. I), as the LOint. – TO band. The key point here is that the TO and LO features do not refer to the same vibration, which suppresses the enigma of the apparent LO-TO inversion.
Three regimes corresponding to strong -coupling, i.e. quasi-resonance for some of the uncoupled LO modes, are identified by circles in Fig. 1. In each case typical coupling-induced anti-crossing behaviors are observed (compare the thin lines that cross each other, and the dotted lines that do not cross in Fig. 1). In particular, strong -coupling occurs close to the stoichiometry, which prevents the discussion of any of the LO features in the Raman/IR spectra in this very sensitive composition range (refer to Sec. IV) as due to any specific bond vibration. Strong -coupling occurs also in the Ga-dilute limit, which we identify as the mechanism behind the spectacular emergence of the InP:Ga mode in the LO Raman spectra, as predicted by JS.10 A priori this strong distortion with respect to the uncoupled LO features (refer to the thin lines in the top inset of Fig. 1) might have generated misleading phonon shifts, with concomitant impact on the reliability of the frequency of the InP:Ga impurity mode as determined from the raw LO Raman spectra. As a matter of fact the exact location of the InP:Ga mode was debated at a certain time. To be quite sure we have calculated the LO Raman lineshape for a typical Ga content of 1% for the two proposed locations of the InP:Ga impurity mode, i.e. 2 cm-1 above10 and below7 the LO mode of pure InP (345 cm-1). The two theoretical LO Raman lineshapes exhibit antagonist asymmetries (not shown), which indicates that the overall LO signal is extremely sensitive to the location of the InP:Ga impurity mode. As a matter of fact only the assignment proposed by JS fairly reproduces the low-temperature LO Raman spectrum that these authors obtained, after the latter spectrum was slightly red-shifted to simulate ambient conditions (see spectrum c in Fig. 2 of Ref. 10).
IV SPONTANEOUS ORDERING IN GaInP2
Since the pioneer extended X-ray absorption fine structure (EXAFS) obtained by Mikkelsen and Boyce with the representative (Ga,In)As system,31 it is rather well-admitted that while the lattice constant exhibits a quasi-linear variation from one end member to the other when the alloy composition varies, each bond species tends more or less to keep its natural bond length in the alloy, as determined in the pure crystal. Transferred to lattice dynamics this simple picture would support the standard 1-bond1-mode behavior, as envisaged by the MREI model.1 However, such a simple bond length description offers little flexibility for the discussion of spontaneous ordering in mixed crystals. As a matter of fact the mechanism behind spontaneous ordering still remains a debated issue.4
Generally our 1-bond2-mode picture for the phonon behavior in the Raman/IR spectra of mixed crystals opens an attractive area for the discussion of spontaneous ordering, because it brings the idea of two bond lengths per species in the alloy. This allows to play with the related competition effects regarding the minimization of the local strain energy due to the bond length mismatch between the end compounds.
As a matter of fact our recent atomistic calculations of the bond length distribution in large (Ga,In)As supercells that mimic real random alloys clearly confirm the bi-modal character of the bond length distribution related to the short Ga-based bond, corresponding to a clear bi-modal behavior in the Raman/IR spectra.17 The configurations were analyzed to distinguish between bonds from the same species that are either inter-connected or isolated, not in the usual terms of next-nearest neighbors. The analogy is straightforward with (Ga,In)P. There again the short Ga–P bond exhibits a clear bi-modal behavior in the Raman/IR spectra (refer to Fig. 1), corresponding to a bi-modal bond length distribution that discriminates between the ‘short’ and ‘long’ Ga–P bonds from the In-rich and Ga-rich regions, respectively (refer to Sec. III-B). As the phonon splitting between the two Ga–P TO modes remains basically unchanged throughout the whole composition range (33 cm-1, refer to Fig. 1), we expect the same for the corresponding difference in the Ga–P bond lengths. This should remain close to the value found at the Ga–P bond percolation threshold, i.e. 8‰ (refer to Sec. III-B).
Now we focus our attention on GaInP2. At this critical composition the Ga–P and In–P bond species are in similar proportion in the alloy, and also the two series of Ga–P bonds (corresponding to the two Ga–P TO modes in the Raman/IR spectra, refer to Sec. II), which enhances the local strain energy. Now, the two series of Ga–P bonds undergo a local tensile strain, due to the longer In–P bonds. Our view is that spontaneous ordering occurs so as to favor a single Ga–P bond length in the alloy, i.e. the larger one so as to minimize the local strain energy. Basically with increasing order we expect that the topology of the (Ga,In) substituting species becomes more like that in the Ga-rich region, and thus that the TO mode reinforces at the cost of the TO mode.
As a matter of fact we note that the minor TO resonance (TO) is deep in the IR transmission spectra obtained by Alsina et al.32 with nominally random GaInP2, while it is shallow for strongly ordered GaInP2 (compare Figs. 1 and 2 in Ref. 32), suggesting that the minor TO mode weakens with increasing order. OZ13 arrive at the same conclusion via first-principles calculations. Besides Mestres et al.33 observe by using Raman scattering that the dominant TO mode (TOIn-P + TO) strengthens and sharpens with increasing order, as can be expected from reinforcement of the GaP-like character.
We denote as (01) the fraction of ‘short’ Ga-P bonds that has turned ‘long’ due to spontaneous ordering. Now we calculate the TO and LO Raman lineshapes while increasing progressively until we obtain fair agreement with the extended data in the literature related to the now available GaInP2 films. Care must be taken that all of these exhibit spontaneous ordering to some extent, as characterized by values of the order parameter in the range 0.1–0.5.34 We remind that measures the average deviation with respect to equal representation of the substituting species in the (111) cationic planes, corresponding to the formation of a (Ga1+ηIn1-ηP2)/(Ga1-ηIn1+ηP2) [111] superlattice. =0 corresponds to the perfectly random situation, while =1 corresponds to the perfectly ordered CuPt-type GaInP2, i.e. a succession of full-Ga and full-In cationic planes along the [111] direction.
For direct comparison with the data we take a realistic phonon damping of 10 cm-1, and a reduced splitting of 4 cm-1 between the TOIn-P and TO modes as given by the ab initio calculations of OZ (see Fig. 3 in Ref. 12), i.e. roughly half our prediction. The central frequency remains the same. Incidentally this discrepancy of a few cm-1 at the stoichiometry between the ab initio calculations and our phenomenological model is rather small when considering that the latter model is entirely built up from a reduced set of three input parameters taken in the dilute limits (the value for the Ga-P phonon splitting, and the frequencies of the GaP:In and InP:Ga impurity modes).
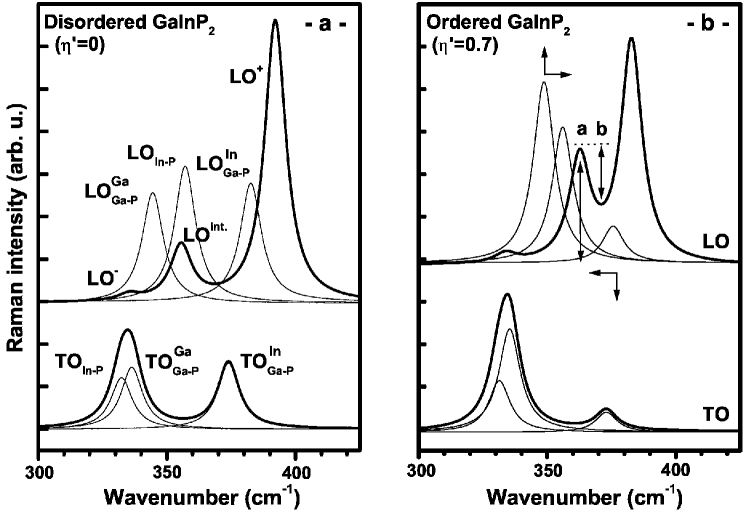
The (TO,LO) situation for random GaInP2 () is shown in Fig. 3-a, for reference purpose. The best agreement between the model and the data in the literature is obtained for 0.7, typically. This corresponds to a dominant TO mode at 332 cm-1, a weak TO mode at 372 cm-1, and three clear LO signals at 333, 362 and 381 cm-1. The curves are shown in Fig. 3-b. We note that as increases the LOint. and LO+ modes converge while the LOint./LO+ strength ratio enlarges. Basically this is enough to explain the puzzling reduction of the so-called valley-to-depth ratio b/a, as schematically indicated in Fig. 3-b, with increasing order.4
At last, we expect an intrinsic limit to spontaneous ordering in mixed crystals. In GaInP2 this should be reached when all the Ga-P bonds are eventually ‘long’ in the crystal (1). At this limit the TO mode, that represents the ‘short’ Ga-P bonds in the crystal, should be hardly detectable in the Raman/IR spectra. Experimentally, this corresponds to 0.5 (see Fig. 2 in Ref. 35). In fact we are not aware that spontaneously ordered GaInP2 films could be grown with an order parameter greater than 0.5.
V CONCLUSION
The consensus so far was that random (Ga,In)P is the only alloy that exhibits the so-called modified 2-mode behavior in the Raman/IR spectra, with a dominant TO mode at low frequency that joins the parent TO modes and a minor TO mode at high frequency that connects the impurity modes. Here we show that (Ga,In)P is not an exception in the crude classification of phonon mode behavior as established by Elliott et al., to distinguish between 1-bond1-mode and 2-bond1-mode systems. Consistent understanding of the phonon mode behavior of (Ga,In)P is achieved via a basic version of our 1-bond2-mode phenomenological model (earlier referred to as the percolation model), supported by detailed re-examination of the Raman/IR data available in the literature, phenomenological full contour modeling of the TO and LO Raman lineshapes while using no adjustable parameter, and first-principles bond length calculations in the impurity limits and close to the bond percolation thresholds. In the latter case it is essential that we discriminate between isolated and connected bonds, not in the usual terms of next-nearest neighbors.
The TO and LO modes in the Raman/IR spectra are re-assigned, with notable difference from previous attributions. In particular the GaP:In impurity mode, earlier identified within the GaP optical band, i.e. at 390 cm-1, is re-assigned at a frequency significantly below the TO mode (368 cm-1), i.e. at 350 cm-1. Accordingly the two impurity modes stay out of the TO–LO bands of the host compounds, so that the In–P and Ga–P TO phonon branches do not overlap. This is enough to reconcile (Ga,In)P with the Elliott’s criterion.
In the TO symmetry the final picture consists of two well-separated Ga–P phonon branches just above two In–P branches so tight that they merge into a single overall In–P branch. On this basis the dominant TO mode in the Raman/IR spectra is re-assigned as a (In–P, Ga–P)-mixed mode resulting from the sum of the overall In–P mode and the near-by low-frequency Ga–P mode. Besides, the minor TO mode is re-assigned as the remaining high-frequency Ga–P mode. Regarding the LO symmetry we show that strong coupling occurs between the individual LO modes, via their long range longitudinal polarization field. The resulting LO signal is strongly distorted with respect to the individual uncoupled LO lines, which makes it not relevant to attribute any LO feature in the Raman/IR spectra to any specific bond vibration, at any alloy composition.
Basically our simple 1-bond2-phonon phenomenological model appears to provide consistent understanding of the long wave (TO, LO) phonon properties of random (Ga,In)P, which was still lacking.
Moreover, we propose a mechanism for spontaneous ordering in GaInP2, based on our observation of a bi-modal phonon behavior for the short Ga–P bond in random (Ga,In)P. Our view is that spontaneous ordering tends to favor those local atomic arrangements around the Ga sites that eventually result in longer Ga-P bond length. This way the local strain energy in the crystal due to the bond length mismatch between the parent compounds is minimized. In particular this simple mechanism accounts for two puzzling behaviors in the Raman/IR spectra when ordering increases: the reinforcement of the dominant mode to the cost of the minor mode in the TO symmetry, and the reduction of the so-called valley-to-depth ratio in the LO symmetry. Besides, as an unprewied issue, we predict an intrinsic limit to spontaneous ordering in mixed crystals. In GaInP2 this should be reached when the minor TO mode completely disappears from the Raman/IR spectra. Experimentally this corresponds to 0.5. It is worth to mention that the attempts to understand why spontaneous ordering failed to generate values greater than 0.5 had attracted little attention so far, whereas higher degrees or spontaneous ordering were currently under expectation.
Generally this work illustrates that detailed understanding of the phonon mode behavior in mixed crystals requires to take into account the disorder in the force constant on top of the mass disorder. As a matter of fact generalization of the Coherent Potential Approximation to include the disorder in the force constant as a full theory was recently achieved by Ghosh et al.36 and Alam and Mookerjee,37 for example, but we are not aware of any application to optical properties.
This work has been supported by the Indo-French Center for the Promotion of Advanced Research (IFCPAR project No 3204-1).
References
I.F. Chang and S.S. Mitra, Adv. Phys. 20, 359 (1971).
I.F. Chang and S.S. Mitra, Phys. Rev. 172 924. (1968).
R.J. Elliott, J.A. Krumhansl and P.L. Leath, Rev. Mod. Phys.
46, 465 (1974).
A. Mascarenhas, H.M. Cheong, M.J. Seong and F. Alsina,
in Spontaneous Ordering in Semiconductor alloys,
edited by A. Mascarenhas (Springer Physics, 2002), p. 391.
G. Lucovsky, M.H. Brodsky, M.F. Chen, R.J. Chicotka and A.T. Ward,
Phys. Rev. B 4, 1945 (1971).
R. Beserman, C. Hirlimann and M. Balkanski, Solid State Commun.
20, 485 (1976).
E. Jahne, W. Pilz, M. Giehler and L. Hildisch,
Phys. Stat. Sol. (b) 91, 155 (1979).
H.W. Verleur and A.S.Jr. Barker, Phys. Rev. 149, 715 (1966).
H.W. Verleur and A.S.Jr. Barker, Phys. Rev. 155, 750 (1967).
10 B. Jusserand and S. Slempkes, Solid State Commun. 49,
95 (1984).
11 T. Kato, T. Matsumoto and T. Ishida,
Jpn. J. Appl. Phys. 27, 983 (1988).
12 V. Ozolinš and A. Zunger, Phys. Rev. B 57, R9404 (1998).
13 V. Ozolinš and A. Zunger, Phys. Rev. B 63, 87202 (2001).
14 P.H. Borcherds, G.F. Alfrey, D.H. Saunderson, and A.D.B. Woods,
J. Phys. C: Sol. State Phys. 8, 2022 (1975).
15 P.H. Borcherds, K. Kunc, G.F. Alfrey and R.L. Hall,
J. Phys. C: Solid State Phys. 12, 4699 (1979).
16 O. Pagès, M. Ajjoun, T. Tite, D. Bormann, E. Tournié
and K.C. Rustagi, Phys. Rev. B 70, 155319 (2004),
and references therein.
17 O. Pagès, T. Tite, K. Kim, P.A. Graf, O. Maksimov and
M.C. Tamargo, J. Phys.: Condens. Matter 18, 577 (2006).
18 D. Stauffer, Introduction to Percolation Theory (Taylor
and Francis, London, 1985).
19 O. Pagès, T. Tite, A. Chafi, D. Bormann, O. Maksimov and
M.C. Tamargo, J. Appl. Phys., to be published.
20 L. Bellaiche, S.-H Wei and A. Zunger, Phys. Rev. B 54,
17568 (1996).
21 A.V. Postnikov, O. Pagès and J. Hugel, Phys. Rev. B 71,
115206 (2005).
22 R.M. Martin, Phys. Rev. B 1, 4005 (1970).
23 P. Ordejón, E. Artacho and J.M. Soler, Phys. Rev. B 53,
R10441 (1996).
24 J.M. Soler, E. Artacho, J.D. Gale, A. García, J. Junquera,
P. Ordejón and D. Sánchez-Portal,
J. Phys.: Condens. Matter 14, 2745 (2002).
25 N. Troullier and J.L. Martins, Phys. Rev. B 43, 1993
(1991).
26 M. Cardona, P. Etchegoin, H.D. Fuchs and P. Molinàs-Mata,
J. Phys.: Condens. Matter 5, A61 (1993).
27 R. Trommer, H. Müller and M. Cardona, Phys. Rev. B 21,
4869 (1980).
28 R. Carles, G. Landa and J.B. Renucci, Solid State Commun. 53,
179 (1985).
29 W.L. Faust, and C.H. Henry,
Phys. Rev. Lett. 17, 1265 (1966).
30 J.F. Young, and K. Wan, Phys. Rev. B 35, 2544 (1987).
31 J.C. Mikkelsen and J.B. Boyce, Phys. Rev. B 28, 7130 (1983).
32 F. Alsina, J.D. Webb, A. Mascarenhas, J.F. Geisz, J.M. Olson
and A. Duda, Phys. Rev. B 60, 1484 (1999).
33 N. Mestres, F. Alsina, J. Pascual, J.M. Bluet, J. Camassel,
C. Geng and F. Scholz, Phys. Rev. B 54, 17754 (1996).
34 A.M. Mintairov, J.L. Merz and A.S. Vlasov, Phys. Rev. B 67,
2052 (2003).
35 H.M. Cheong, F. Alsina, A. Mascarenhas, J.F. Geisz and J.M. Olson,
Phys. Rev. B 56, 1888 (1997).
36 S. Ghosh P.L. Leath and M.H. Cohen, Phys. Rev. B 66,
214206 (2002).
37 A. Alam and A. Mookerjee, Phys. Rev. B 71, 94210 (2005).