Institut für Theoretische Physik and Center for Computational Materials Science - TU Wien, Wiedner Hauptstraße 8-10, A-1040 Wien, Austria
Department of Physics, University of Bath, Bath BA2 4LP, United Kingdom
First pacs description Second pacs description Third pacs description
Phase behaviour of a symmetrical binary fluid mixture in a field
Abstract
Integral equation theory calculations within the mean spherical approximation (MSA) and grand canonical Monte Carlo (MC) simulations are employed to study the phase behaviour of a symmetrical binary fluid mixture in the presence of a field arising from unequal chemical potentials of the two particle species. Attention is focused on the case for which, in the absence of a field, the phase diagram exhibits a first order liquid-liquid transition in addition to the liquid-vapor transition. We find that in the presence of a field, two possible subtypes of phase behaviour can occur, these being distinguished by the relationship between the critical lines in the full phase diagram of temperature, density, and concentration. We present the detailed form of the respective phase diagrams as calculated from MSA and compare with results from the MC simulations, finding good overall agreement.
pacs:
05.70.jkpacs:
64.70.Fxpacs:
64.70.Ja1 Introduction
The phase behaviour of binary symmetrical liquid mixtures has attracted considerable interest over many years [1, 2, 3, 4, 5, 6, 7, 8, 9, 10, 11, 12, 13, 14, 15]. In such a system the interaction between particles of the same species (labeled ‘1’ and ‘2’) is equal, i.e., , but that between unlike species is modified by a factor , so that . This model serves as a starting point for studying the phase behaviour of more realistic binary fluids. Furthermore it maps onto an Ising spin fluid and therefore represents a prototype one-component fluid in which the particles carry an internal degree of freedom.
The topology of the phase diagram is governed by the parameter . We shall only consider the case of , for which there is a demixing transition. In the equimolar case (i.e., when both species have equal concentrations), one finds four different topologies of phase diagram [7, 15]. These are distinguished by the relationship between a critical line of demixing transitions and a first order liquid-vapour (LV) transition. Interestingly it transpires that the same four archetypes of phase diagram occur in considerably more complex and realistic models such as Heisenberg and Stockmayer fluids (see [17, 18, 19] and references therein). Thus the simple symmetrical mixture provides a useful test bed for elucidating the generic aspects of phase behaviour without the need to tackle these more complicated systems explicitly.
Depending on how the critical line of the demixing transition (the so-called -line) intersects the LV coexistence line in the density-temperature plane, the four types of phase diagram can briefly be described as follows (in order of decreasing ): in the first type, the -line intersects the LV coexistence line from the liquid side at temperatures well below the LV critical temperature, forming a critical end point (CEP); in the second type, the -line approaches LV coexistence (from the liquid side) slightly below the LV critical temperature, terminating in a separate tricritical point, which itself marks the end of a first order transition between mixed and demixed liquid phases; in the third type the -line intersects the LV critical point directly, the two combining to form a tricritical point. Finally in the fourth type the -line intersects the low density branch of the LV coexistence curve, forming a CEP. We point out that these topologies are special cases of the more general classification scheme for the phase behaviour of binary fluid mixtures proposed by van Koynenburg and Scott [16]; the correspondence with the latter has been described in ref. [15].
These four types of phase diagram have been studied in detail for several symmetrical systems in the case of equimolar concentrations of the two species. This corresponds to a vanishing chemical potential difference field, i.e. . We shall refer to this scenario as the field-free case. For we are aware of only two studies [12, 8] for continuum models. This is probably related to the fact that the numerical solution of the coexistence equations is cumbersome and that the topology of the full phase diagram becomes rather intricate in the absence of the equimolar symmetry.
It is, in particular, the remarkable study of Pini et al. [12] that has provided a first impression of the unexpected richness of the full phase diagram of a binary symmetrical mixture. Focusing on the topology of phase diagram in which, for , a first order liquid-liquid transition occurs in addition to a LV transition, the authors report for the case the occurrence of double critical and tricritical points, and observe a region of a homogeneous, mixed fluid. This investigation was based on both a simple mean-field (MF) approach and Hierarchical Reference Theory (HRT) calculations, the latter being a highly sophisticated liquid state theory that remains accurate even near critical points (see [12] and references therein). However, as a consequence of the high numerical costs of such calculations, a complete elucidation of the phase behaviour was out of reach; the study instead being limited to a few isothermal cuts at selected values.
In the present work we have re-considered exactly the same system as in [12], namely a binary symmetrical mixture whose particles interact via a hard-core Yukawa (HCY) potential in an external field. However, for reasons of computational efficiency we have studied its phase behavior by means of the mean spherical approximation (MSA), taking advantage of the availability of the analytical solution of the MSA for HCY mixtures [20, 21, 22, 23]. Doing so allows us to explore the full phase diagram for in a systematic fashion, something which would be far more arduous using HRT. We complement our MSA study by grand-canonical Monte Carlo (MC) simulations. Both the theory and the simulations confirm the existence of the two subtypes of phase behaviour in the presence of a field, which we label and , and are distinguished by the trajectories of the critical lines in the phase diagram. In the classification scheme of phase diagrams of binary mixtures [16] subtype corresponds to type ‘sym. III-A⋆’, and subtype to type ‘sym. II-A⋆’. We present these phase diagrams in the three dimensional (3d) space of temperature , number density , and concentration , thus permitting a deeper insight into the respective topologies than has hitherto been possible. The new perspectives thus gained, allow further elucidation of the nature of the initial findings presented in [12] and a deeper appreciation of their wider context. Additionally, we uncover new phenomena in this context (such as triple lines) that have not, to date, been reported. Our comparison of theory with the results of computer simulations shows that the latter are competitive with theoretical approaches in describing even complex phase phenomena on a quantitative level.
2 System and methodology
We consider a binary symmetrical mixture where the particles interact via the HCY potential
| (1) |
Here are the contact values of the potentials, is the hard-core diameter, and is the inverse screening length, assigned the value in this work. Standard reduced units will be used throughout the paper.
The solution of the Ornstein-Zernike equations [28] along with the MSA closure relation, i.e.,
| (2) |
can be carried out for this particular system to a large extent analytically [20, 21]. Here and are the direct correlation functions and the pair distribution functions respectively, while is the inverse temperature. We have used the formalism presented by Arrieta et al. [22, 23] for the MSA solution for multi-component HCY systems. These papers contain expressions for thermodynamic properties, notably the pressure and the chemical potentials which are required to determine phase coexistence, as well as details of the numerical solution of the set of coupled, non-linear equations that fix the unknown parameters of the correlation functions. All our MSA calculations have been carried out using MATHEMATICA™[24].
Grand canonical MC simulations were performed in a manner similar to that employed for a previous study [7] of the zero field case . Simulations were conducted at constant , , and and measured the joint distribution of the number density, the concentration, and the internal energy, which was accumulated in the form of a list. Phase boundaries were traced in the space of these variables by applying the equal peak weight criterion to the order parameter distribution [25]. This procedure was aided by multicanonical preweighting and multiple histogram reweighting [26, 27]. Critical points were located using a crude version of the finite-size scaling techniques described in ref. [29]. This involves matching the order parameter distribution function to a known universal scaling form appropriate to the finite-size limit.
Further details concerning all methods used will appear in a forthcoming report [30].
3 Results
We first present MSA results for the two subtypes of phase diagrams ( and ) in -space and their projections onto the -plane in Fig. 1. These provide an overview of the principal features of the respective topologies. Because of the symmetry of the underlying model, all phase diagrams are symmetric with respect to the plane .
The subtype is displayed in Fig. 1(a) where, motivated by the results of Pini et al. [12], we have chosen . We observe four distinct coexistence surfaces separated by triple lines (to be discussed below) and each exhibiting a critical line. The first one, , is symmetrical with respect to the ()-plane and represents the demixing transition which is well-known from the field-free case; its critical line is the -line. On this surface two symmetrical high-density phases (), specified by and , are in coexistence. Next, two further (symmetrically related) coexistence surfaces, and , are encountered for low and intermediate densities ; they describe neither pure demixing transitions, nor pure LV transitions, hence the respective order parameter is a linear combination of the density and concentration differences of the two coexisting phases. Coming from high temperatures the -line bifurcates at the tricritical point into two critical lines (belonging to and ) which pass through minima and head toward the critical points of the pure phases. The fourth coexistence surface, , which is located in between and , is predominantly LV-like in character and contains a critical line of LV transitions which passes through the LV critical point of the field-free mixture. The surface as a whole is delimited by the intermediate-density branches of a triple line which form a lens-shaped ‘loop’. Tie-lines starting at this enclosing triple line connect a vapour and a liquid phase of approximately equal concentrations with a liquid phase of higher density. The latter states form the high-density branch of the triple line located in the ‘valley(s)’ formed by (or ) and . In Fig. 1(a) selected tie lines are shown. In the field-free phase diagram four phases coexist, two of which, being located on the high density surface, are symmetrically related. The other two, at intermediate densities, are the end points of the lens-shaped ‘loop’ mentioned above. As the critical line of approaches the bounding triple line, the coexisting vapour and liquid phases become critical. Since these are simultaneously in equilibrium with a non-critical phase (the so-called spectator phase) located at the end point of the high-density branch of the triple line, this point is a CEP. Finally, we point out that in agreement with [12] we also observe a region of a homogeneous, mixed fluid at intermediate densities which is bounded by the four coexistence surfaces.
In subtype , which we have found to occur at , we observe an entirely different topology of phase diagram, as is evident in Fig. 1(b). Again, four coexistence surfaces with accompanying critical lines can be identified. At high densities we find a symmetric demixing surface , associated with the -line. As the temperature is decreased, the -line bifurcates at the tricritical point into two critical lines which traverse the (symmetrically related) surfaces and . These critical lines pass through minima and terminate in CEPs located at the high density branch of a triple line being the intersection of and with a further coexistence surface . At these CEPs two high-density phases become critical while they coexist with the spectator phase, located at the end point of the low-density branch of the triple line. A fourth critical line on connects the critical points of the respective pure components; it passes through the equimolar LV critical point and is now completely detached from the -line. The triple lines also show a distinctively different behaviour than their equivalents in subtype : now one low-density phase (with ) is connected via tie lines to two high-density phases; representative tie lines are shown in Fig. 1(b). From each of the four points in the field-free phase diagram which coexist at the triple point, a pair of triple lines eminates on application of an external field. In contrast to type , the high and the intermediate triple lines merge to form two symmetrically related ‘loops’, while the low density branches terminate as the spectator phase of the CEP. Again, for a region of a homogeneous, mixed fluid is encountered, which is enclosed by the three coexistence surfaces (see also [12]).
Of course it is of particular interest how the transition from one subtype to the other takes place. We start from subtype and increase the parameter . Then gradually the high- and the intermediate-density branches of the triple line lengthen; they merge when the CEP located on the intermediate-density branch meets the end point of the high-density branch, thereby forming a tricritical point. Within the MSA this occurs for . Upon further increase of , a high-density branch (with a CEP) and a low-density branch of the triple line detach, thus resulting in the topology of the -subtype. Concommitant with this metamorphosis of the triple lines, we observe a related development in the short section of the critical line that passes through the LV critical point in subtype : with increasing , this line lengthens in both directions until it meets (at the crossover between the subtypes) the critical lines of the surfaces and . The critical lines together form a loop as is nicely depicted in Fig. 1(c) of [12] where, in the MF scenario, the transition occurs at . As is further increased, a new critical line forms connecting the critical points of the pure phases, passing through the equimolar LV critical point so that the CEPs remain with the newly formed triple lines at higher densities.
With this picture in mind, we can now return to the study presented in [12] and re-consider their results in a broader context. Several interesting features were discovered in that contribution and depicted via isothermal cuts through the phase diagram. However, we feel that a more comprehensive picture only emerges once the phase behaviour is depicted in the full -representation of the phase diagram as presented here. In particular we point out the following: (i) from our 3d representation we obtain clear confirmation of the existence of two distinctly different subtypes; (ii) we find previously unreported triple lines; (iii) our 3d plots explicitly show how the reported ‘double critical points’ in ref. [12] are related to local minima in critical lines.
Turning now to the results of our grand canonical MC simulations, these involved tackling interesting features not previously considered in the simulation literature, such as critical points for which the order parameter is neither purely the density nor purely the concentration, but a linear combination of the two. In a manner similar to [7] we accumulated the field-free () phase diagram in the ()-plane. By means of histogram reweighting we then extrapolated to small but finite , thus obtaining an estimate of the corresponding phase diagram. Guided by this prediction, a new set of simulations were then performed at near coexistence state points for this value of , the results of which were extrapolated to yet larger . In this manner we were able to track the phase behaviour as a function of , thereby permitting the study of a large range of concentrations. By accumulating separately contributions to the energy from like and unlike particle interactions, we were also able to perform histogram extrapolation with respect to . This was useful in helping to find the regions of relevant to the two subtypes.
Owing to the high dimensionality of the off-plane phase behaviour we were not able to obtain the statistics necessary to construct the entire 3d phase diagram in the same detail as done for MSA. Nevertheless projections onto the -plane, as shown in Fig. 2, clearly confirm the general picture seen in the corresponding projections of the MSA data (Fig. 1) and outlined above. Specifically, for , the critical line eminating from the field-free LV critical point terminates at CEPs. The critical lines eminating from the tricritical point link up with that coming from the LV critical points of the pure phases. In contrast, for , the LV critical point of the pure phases join smoothly to that of the equimolar mixture, while the critical line starting from the tricritical point terminate at CEPs. As regards the range of in which the two subtypes of phase behaviour are visible, the simulation results are in semi-quantitative agreement with the MSA calculations, the value of separating the two subtypes differs from that found in MSA by just .
Further details of the MC and MSA results will be presented in a forthcoming contribution[30].
4 Conclusions
Although the model system we have studied is a rather simple model of a binary fluid, it nevertheless captures all the relevant features of the phase behaviour of more complicated systems whose particles are endowed with an internal degree of freedom, such as spin fluids. It can therefore be viewed as a prototype model, the elucidation of which represents the first step in a progression to other, more realistic systems.
In this work we have shown that MSA provides a complete picture of the two subtypes of phase behaviour for symmetrical mixtures in a chemical potential difference field. The phase behaviour is considerably richer in both variety and character than one would have expected on the basis of the field-free case. Our results are in good agreement with the less comprehensive MF and HRT study of these two subtypes in ref. [12]. Although in principle more accurate than MSA, HRT is very laborious to implement and computationally expensive, and still does not produce results in fully quantitative agreement with simulation, as has been observed in studies of the field-free case [9].
Our results are confirmed by MC simulations, showing that the MSA provides a qualitatively correct description of this system. Indeed our study has demonstrated that computer simulations are competitive with theory in providing (within a reasonable amount of time) information on intricate phase diagrams exhibiting complex topologies of critical lines. Given that the various commonly used theoretical approaches (HRT, MSA,) do not always agree, MC thus provides an invaluable benchmark with which to compare. Comparison with simulation is thus generally desirable.
Acknowledgements.
JK and GK acknowledge financial support by the Österreichische Forschungsfond (FWF) under Project Nos. P15758-N08 and P17823-N08, the Hochschuljubiläumsstiftung der Stadt Wien under Project No. 1080/2002, and the Außeninstitut der TU Wien. Additional financial support was provided by the Anglo-Austrian ARC Programme of the British Council. The authors would like to thank Davide Pini (Milan) for useful discussions.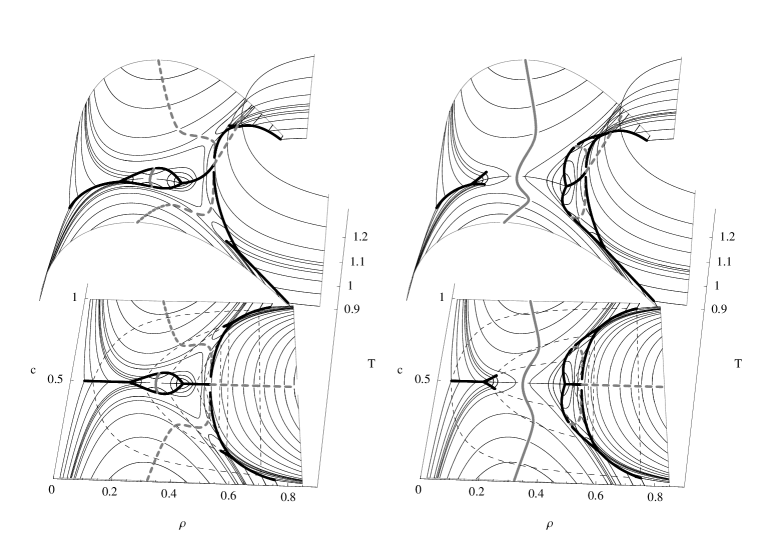


References
- [1] \NamePanagiotopoulos A.Z., Quirke N., Stapleton M., Tildesley D.J. \ReviewMol. Phys. \Vol63 \Year1988 \Page527
- [2] \NameRecht J.R. Panagiotopoulos A.Z. \ReviewMol. Phys. \Vol80 \Year1993 \Page843
- [3] \NameGreen D.G., Jackson G., de Miguel E., Rull L.F. \ReviewJ. Chem. Phys. \Vol101 \Year1994 \Page3190
- [4] \Namede Miguel E., del Río E.M., Telo da Gama M.M. \ReviewJ. Chem. Phys. \Vol103 \Year1995 \Page6188
- [5] \NameWilding N.B. \ReviewPhys. Rev. E \Vol55 \Year1997 \Page6624
- [6] \NameCaccamo C., Costa D., Pellicane G. \ReviewJ. Chem. Phys. \Vol109 \Year1998 \Page4498
- [7] \NameWilding N.B., Schmid F., Nielaba P. \ReviewPhys. Rev. E \Vol58 \Year1998 \Page2201
- [8] \NameAntonevych O., Forstmann F., Diaz-Herrera E. \ReviewPhys. Rev. E \Vol65 \Year2002 \Page061504
- [9] \NameWilding N.B. \ReviewPhys. Rev. E \Vol67 \Year2003 \Page052503-1
- [10] \NameWoywod D Schoen M \ReviewPhys. Rev. E \Vol67 \Year2003 \Page026122
- [11] \NameSchöll-Paschinger E. Kahl G. \ReviewJ. Chem. Phys. \Vol118 \Year2003 \Page7414
- [12] \NamePini D., Tau M., Parola A., Reatto L. \ReviewPhys. Rev. E \Vol67 \Year2003 \Page046116-1
- [13] \NameSchöll-Paschinger E., Gutlederer E., Kahl G. \ReviewJ. Molec. Liquids \Vol112 \Year2004 \Page5
- [14] \NameSchöll-Paschinger E., Levesque D., Weis J.-J., Kahl G. \ReviewJ. Chem. Phys. \Vol122 \Year2005 \Page024507-1
- [15] \NameSchöll-Paschinger E. Kahl G. \ReviewJ. Chem. Phys. \Vol123 \Year2005 \Page134508-1
- [16] \Namevan Konynenburg P. H. Scott R. L. \ReviewPhilos. Trans. R. Soc. London \Vol298 \Year1980 \Page495
- [17] \NameTavares J.M., Telo da Gama M.M., Teixeira P.I.C., Weis J.-J., Nijmeijer M.J.P. \ReviewPhys. Rev. E \Vol52 \Year1995 \Page1915
- [18] \NameWeis J.-J., Nijmeijer M.J.P., Tavares J.M., Telo da Gama M.M. \ReviewPhys. Rev. E \Vol55 \Year1997 \Page436
- [19] \NameGroh B. Dietrich S. \ReviewPhys. Rev. Lett. \Vol72 \Year1997 \Page2422
- [20] \NameHøye J.S. Blum L. \ReviewJ. Stat. Phys. \Vol16 \Year1977 \Page399
- [21] \NameHøye J.S. Blum L. \ReviewJ. Stat. Phys. \Vol19 \Year1977 \Page317
- [22] \NameArrieta E., Jedrzejek C., Marsh K.N. \ReviewJ. Chem. Phys. \Vol86 \Year1987 \Page3607
- [23] \NameArrieta E., Jedrzejek C., Marsh K.N. \ReviewJ. Chem. Phys. \Vol95 \Year1991 \Page6806
- [24] \BookWolfram Research Inc., http://www.wolfram.com
- [25] \NameBorgs C. Kotecky R. \ReviewPhys. Rev. Lett \Vol68 \Year1992 \Page1734
- [26] \NameBerg B.A. Neuhaus T. \ReviewPhys. Rev. Lett. \Vol68 \Year1992 \Page9
- [27] \NameFerrenberg A.M. Swendson R.H. \ReviewPhys. Rev. Lett. \Vol63 \Year1989 \Page1195
- [28] \NameHansen J.-P. McDonald I.R. \BookTheory of Simple Liquids \PublAcademic Press (London) \Year1986
- [29] \NameWilding N.B. \ReviewPhys. Rev. E \Vol52 \Year1995 \Page602
- [30] Köfinger et al. to be published