Dielectric relaxation of DNA aqueous solutions
Abstract
We report on a detailed characterization of complex dielectric response of Na-DNA aqueous solutions by means of low-frequency dielectric spectroscopy (40 Hz - 110 MHz). Results reveal two broad relaxation modes of strength and , centered at 0.5 kHz70 kHz and 0.1 MHz15 MHz. The characteristic length scale of the LF process, nm, scales with DNA concentration as and is independent of the ionic strength in the low added salt regime. Conversely, the measured length scale of the LF process does not vary with DNA concentration but depends on the ionic strength of the added salt as in the high added salt regime. On the other hand, the characteristic length scale of the HF process, nm, varyes with DNA concentration as for intermediate and large DNA concentrations. At low DNA concentrations and in the low added salt limit the characteristic length scale of the HF process scales as . We put these results in perspective regarding the integrity of the double stranded form of DNA at low salt conditions as well as regarding the role of different types of counterions in different regimes of dielectric dispersion. We argue that the free DNA counterions are primarily active in the HF relaxation, while the condensed counterions play a role only in the LF relaxation. We also suggest theoretical interpretations for all these length scales in the whole regime of DNA and salt concentrations and discuss their ramifications and limitations.
pacs:
82.39.Pj 87.15.He 77.22.GmI Introduction
Semiflexible polyelectrolytes are ubiquitous in biological context ranging from charged biopolymers such as DNA or filamentous actin, and then all the way to molecular aggregates such as bacterial viruses or the tobacco mosaic virus. They are an essential and fundamental component of the cellular environment and make their mark in its every structural and functional aspect Daune03 . Their role is not confined solely to various (macro) molecular assemblies in the biological milieu but are equally prevalent in colloidal systems and soft matter in general Osawa71 ; Schmitz93 . It is their connectivity, stiffness and strong electrostatic interactions, that allow polyelectrolytes to show a wide range of complex behaviors, depending on their concentration, their overall length and the concentration and valency of the added salt ions and intrinsic counterions Dobrynin .
In the simplest case of monovalent counterions, polyelectrolytes are usually stretched due to electrostatic repulsions and therefore statistically assume a rod-like configuration Netz03 . Polyvalent counterions on the other hand can turn electrostatic repulsion into attraction Boroudjerdi05 . This s.c. correlation effect is one of the most important features of the polyvalent counterions and has fundamental repercussions for all charged soft matter. Correlation attraction can strongly reduce the rigidity of charged polymers which then collapse into highly compact states Hansen99 .
Deoxyribonucleic acid (DNA) is in many respects a paradigm of a stiff, highly charged polymer. The structural origin of the charge is due to negatively charged phosphate groups positioned along the DNA backbone Grosberg02 . The nominal charge density of double stranded DNA amounts to one negative elementary charge per 1.7 Å or two elementary charges per base pair. When dealing with electrostatic interactions and their consequences in DNA one can usually ignore the internal chemical structure of DNA except as it transpires through the bare value of the persistence length (see below).
Electrostatic interactions in stiff polyelectrolytes with monovalent counterions and added salt in aqueous solutions are standardly approached via the Poisson - Boltzmann (PB) theory that combines electrostatics with statistical mechanics on a simplified mean-field level Schmitz93 . On the PB level the outcome of the competition between entropy of mobile charges and their electrostatic interaction energy leads grosso modo to two types of effects.
The first one is connected with electrostatic interaction of counterions and fixed charges on the polyelectrolyte. Positively charged counterions are attracted to the surface of the negatively charged DNA where they tend to accumulate in a layer of condensed counterions. This accumulation can be understood within the framework of the Manning-Oosawa (MO) counterion condensation theory Schmitz93 as well as on the level of the solutions of the PB equation Hansen01 . Within this theory the counterions accumulate in the condensed layer around the cylindrical DNA surface only if the charge density parameter . Here , where is the valency of the counterion, is the linear charge spacing and is the Bjerrum length, defined as
| (1) |
Here is elementary charge, is permeability of vacuum, is thermal energy scale and is the dielectric constant of the solvent. Bjerrum length is obviously defined as the separation between charges at which their electrostatic interaction energy equals their thermal energy. In aqueous solutions Å. The charge density parameter thus measures the relative strength of electrostatic interactions vs. thermal motion and is strongly dependent on the valency of the counterions. In the MO theory the counterions accumulate in the condensed layer exactly to such an extent that the effective charge density parameter is reduced to 1 Bloomfield00 , i.e. the effective separation between charges is increased from to . The condensed counterions in the MO theory are still assumed to be perfectly mobile. Because of counterion condensation the effective charge of DNA is reduced by a factor . It is important to note here that the concept of counterion condensation is intrinsically nonlinear and is a fundamental property of highly charged polymers. This includes DNA in both its double stranded ( Å, ) as well as single stranded ( Å, ) forms. Counterion condensation for monovalent DNA salts is experimentally observed directly by small-angle X-ray scattering measurements Das03 . For double stranded DNA and monovalent counterions, counterion condensation occurs with . In the MO counterion condensation theory the condensation occurs only if the salt concentration is low enough to satisfy , where is the polymer radius and is the Debye screening length (see below) Bloomfield00 . Furthermore the counterion condensation strictly occurs only in the limit of vanishingly small concentration of DNA Hansen01 . For finite DNA concentrations a more complicated model of counterion condensation has to be invoked Hansen01 that is based on the solution of the PB equation in the cell model geometry.
The second effect of competition between entropy of mobile charges and their electrostatic interaction energy is due to the interaction of mobile ions in solution between themselves and their redistribution in the field of fixed polyelectrolyte charges. This redistribution leads to screening of electrostatic interactions between fixed charges. For small enough, fixed, charge density the screening is accurately described by the Debye-Hückel equation, which is just a linearized form of the PB equation Schmitz93 . On the Debye-Hückel level the screening is quantified by a screening or Debye length defined as
| (2) |
where again is the Bjerrum length and n is the density of added salt. For monovalent salts the Debye length in Å is given numerically as , where is the ionic strength in M. Indeed for monovalent salts both effects, ionic screening as well as counterion condensation, coexist. In general, however, one can not invoke screening effects in polyvalent salt solutions since in that case the whole PB conceptual framework breaks down and correlation, not screening, effects Boroudjerdi05 become the salient feature of the behavior of the system. The ionic screening in monovalent salt solutions, augmented by the effect of thermal DNA undulations, has been shown to quantitatively describe the measured osmotic pressure of DNA solutions in a fairly wide range of concentrations Strey99 ; Podgornik89 ; Podgornik94 .
Apart from being a charged polymer, DNA is also molecularly rather stiff. The flexibility of polymers is usually described via the persistence length . Persistence length is nothing but the correlation length for orientational correlations along the molecular axis of the polymer Daune03 . For DNA the usually accepted value is about 500 Å Bloomfield00 . Persistence length separates two regimes of behavior: rigid chain regime for contour lengths smaller than and flexible chain regime for contour lengths much larger then . The persistence length depends on long range electrostatic interactions along the polyelectrolyte chain. The influence of electrostatic interactions on the persistence length was first considered by Odijk Odijk77 and independently by Skolnick and Fixman Skolnick77 . According to the Odijk-Skolnick-Fixman (OSF) theory, the total persistence length can be decomposed into a structural () and electrostatic () contribution as
| (3) |
where is again the separation between charges. Assuming the MO condensation, i.e. , one gets in Å. As is clear from the OSF theory, counterion condensation reduces the electrostatic contribution to the persistence length due to an increase in the effective separation between charges from to . The OSF result, though it can be nominally applied only at restrictive conditions, appears to work well when compared to experiments Baumann97 as well as computer simulations Ullner03 . On the other hand, in the regime of no added salt and thus weak electrostatic screening due to other chains and counterions, a semiflexible charged chain in a semidilute polyelectrolyte solution behaves like a random walk of correlation blobs (see below) with chain size Dobrynin . Coming back to the electrostatic persistence length, it is worth mentioning that strongly depends on the valency of the counterions and in general on the details of the electrostatic interaction potential. For monovalent counterions is usually positive indicating an effective repulsion between monomers.
It is evident that starting assumptions of the MO theory (infinitely thin polymers or highly dilute polyelectrolyte solutions) and of the OSF theory (monovalent salt with low enough screening) enforce their limited validity. It is not clear at all whether one can apply these theories in the limit where added salt concentration is smaller than the DNA concentration, viz. the concentration of intrinsic counterions. This fact raises further questions, even in the simplest case of DNA in monovalent salt solutions, of the general applicability of these models to predict the amount of counterion condensation, as well as to describe properties like fundamental length scales of DNA in solution.
Due to the intrinsic length of native DNA, the concentration of polyelectrolyte solutions that we are dealing with in this contribution is always higher than the chain overlap concentration * Dobrynin . This means that we are effectively always in the semidilute regime, where it has been known for a long time Dobrynin ; Odijk79 , that a new length scale emerges describing the density correlations in the polyelectrolyte solution. This length scale is equal to the correlation length or the mesh size, describing the correlation volume in semidilute polyelectrolyte solutions, and is given by the de Gennes-Pfeuty-Dobrynin (dGPD) correlation length Dobrynin ; deGennes76 ; Pfeuty78 that scales universally with the concentration of the polyelectrolyte, , as
| (4) |
It is interesting that this form of scaling, first derived for uncharged polymer solutions, is preserved also in the case of polyelectrolytes with some theoretically possible adjustments only in the case of added salt effects, and is expected to be proportional to the screening length due to both free DNA counterions and added salt ions Dobrynin . For polyelectrolyte solutions the interpretation of this scaling result is that for volumes smaller than the polyelectrolyte chain is stiffened by electrostatic interactions Schmidt89 , whereas for scales larger than , it behaves as a free flight chain.
In an attempt to clarify several of the above issues, we have undertaken an investigation of dielectric relaxation properties of DNA solutions that covers a broad range of DNA concentrations, as well as added salt concentrations. We have used low-frequency dielectric spectroscopy technique, widely established as a direct and non-destructive tool to probe charged entities and their structure in various bio-macromolecular systems Pethig79 ; Nandi00 ; Colby . Our aim was not only to verify the predictions of the various theories in the well defined conditions, but also to investigate the behavior of DNA at extreme conditions like very low and very high added salt limit. A brief report of this investigation has been published in Ref. TomicPRL06 .
Interpretation of our results depends on the nature of the conformation of DNA in low salt or even pure water solutions, more specifically on whether DNA is in a single stranded (ss-) or double stranded (ds-) conformation. We have considered this question very carefully in what follows. Different preparation protocols for DNA solutions were adopted in order to study the issue of ds-DNA stability in pure water (see the Materials and Methods section) solutions. Denaturation of DNA was in particular investigated for pure water DNA solutions. These studies indicate that indeed for semidilute conditions the DNA double-helix was never denatured into two spatially distinguishable and well separated single strands. DNA solutions were additionally characterized by UV spectrophotometry, electrophoresis and atomic emmission spectroscopy.
Our results demonstrate that DNA counterions, free as well as condensed in variable proportions, contribute to the oscillating polarization in the applied electric field and thus together determine the dielectric response of the DNA solution. The characteristic size of the relaxation volume for the dielectric response of a semidilute DNA solution is given by one of the three fundamental length scales: the dGPD mesh size of the whole polyelectrolyte solution, the OSF salt-dependent persistence length of a single polyelectrolyte chain and the average size of the chain in the salt-free polyelectrolyte solution. The OSF prediction for the persistence length as a function of added salt ionic strength is verified in the high added salt limit giving very good agreement. Our results indicate that by going from the high to the low salt limit and all the way down to the nominally pure water solutions, the characteristic length goes from the persistence length of the DNA in solution to a value that corresponds to the average size of the Gaussian chain composed of correlation blobs which scales as . Moreover, an exact condition is established that separates the high from the low added salt regime, which reads , where is the concentration of DNA counterions, These two regimes differ in whether the added salt ions provide the screening or DNA acts as its own salt. Finally, our results confirm the theoretical prediction describing the concentration dependence of the mesh size of DNA solutions as . In the limit of low DNA concentrations and low added salt, the semidilute solution correlation length deviates from the classical polyelectrolyte behavior and follows the scaling . Possible interpretations of this behavior are discussed and the appearance of locally fluctuating regions with exposed hydrophobic cores is suggested as the mechanism for this anomalous scaling.
II Materials and methods
Salmon testes and calf thymus lyophilized Na-DNA threads were obtained from Sigma and Rockland, respectively. Low protein content was declared and verified by our UV spectrophotometry measurements, for the former and for the latter . Inductively coupled plasma - atomic emmission spectroscopy (ICP-AES) elemental analysis was performed on the Na-DNA threads dissolved in pure water purewater . The results have shown that the phosphorus and sodium contents were the same, implying that only intrinsic sodium atoms are present. Taking into account that for double stranded DNA, monomers correspond to base pairs of molecular weight 660 g/mol, this result implies 7% by weight of Na+ ions in DNA. This means that the concentration of intrinsic DNA counterions and the DNA concentration are related by 3 mol/mg. Electrophoresis measurements were performed on DNA dissolved in pure water and in NaCl electrolyte with different ionic strengths. The obtained results have shown consistently the existence of polydisperse DNA fragments, most of them in the range 2 - 20 kbp. Since the scale of 3.4 Å corresponds to one base pair, we estimate the range of contour lengths of DNA fragments to be 0.7 - 7 m.
DNA solutions with different DNA concentrations and different added salt ionic strengths were prepared according to two protocols, which we describe below:
-
I
Pure water DNA solutions: Dry DNA threads were dissolved in pure water for 48 hours at 4oC so that the solutions within concentration range mg/mL were obtained. The ionic strength of pure water mM was estimated from the measured conductivity S/cm of the pure water sample in the chamber for dielectric spectroscopy, using molar conductivity of the highly diluted NaCl (126.5 Scm2/mol). An increased conductivity value of pure water, as compared to the declared one purewater , is due to manipulation in the laboratory environment.
-
II
DNA solutions with added salt:
-
II
NaCl was added to DNA water solution with a chosen (prepared according to I), so that the added salt ionic strength was achieved in the range 0.01 mM mM.
-
II
DNA solutions with the same as in II and with the added salt ionic strength in the range 1 mM mM were prepared starting from stock DNA solutions in which DNA was dissolved in 10 mM NaCl for 48 hours at 4oC. One of the stock solutions was dialyzed against 10mM NaCl during 24 hours at 4oC (II), while the other was not (II).
-
II
DNA solutions with concentrations in the range mg/mL and with the added salt ionic strength 1 mM were prepared starting from a stock DNA solution in which DNA was dissolved in 10 mM NaCl for 48 hours at 4oC. Stock solution was dialyzed against 1 mM NaCl during 24 hours at 4oC.
-
II
The stock solutions were stored at 4oC and were diluted just before dielectric spectroscopy measurements, which were completed in a few days. UV spectrophotometry and electrophoresis measurements were performed within next two weeks. For longer periods the stock solutions were stored at -80oC. pH of all solutions were found to be around 7. Similar pH values were measured for DNA solutions prepared from 10 mM Tris-EDTA buffer (TE), which adjusts pH to 7.6 (not discussed in this article).
The results of ICP-AES elemental analysis indicated that solutions of Na-DNA dissolved in pure water did not contain any additional ions except declared sodium ones. This was further confirmed by dielectric spectroscopy measurements, which gave identical results for DNA solutions with same DNA concentration and added salt ionic strength prepared according to the protocol II and II.
Spectrophotometry measurements at 260 nm were performed to verify nominal DNA concentrations. The concentration was determined assuming an extinction coefficient at 260 nm for 1 mg/mL, meaning that the measured absorption corresponds to 0.05 mg/mL Steiner67 ; Beers67 . Throughout this article we will refer to nominal concentrations, which we have found to be in a good agreement with the measured ones. In particular, the measured concentrations for DNA solutions II and II, performed on 10 aliquots, were consistently smaller by about 20% than the nominal ones. We interpret this difference to be due to water content, not taken into account by the spectrophotometry approach. Indeed, lyophilized DNA if kept at 110oC for 30 min loses about 20% in weight.
Dielectric spectroscopy measurements Colby were performed at room temperature (25oC) using a set-up which consists of a home-made parallel platinum plate capacitive chamber and temperature control unit, in conjunction with the Agilent 4294A precision impedance analyzer operating in Hz - 110 MHz frequency range. The capacitive chamber enables reliable complex admittance measurements with reproducibility of 1.5% of samples in solution with small volume of 100 L and with conductivities in the range of 1.5 - 2000 S/cm. Low ac amplitudes of 50 mV were employed in order to probe the DNA response in the linear regime, once we verified that for ac signal levels in the range between 20 mV and 500 mV the result was essentially the same. Lowest ac amplitudes were not used in order to avoid extensive averaging. Admittance was sampled at 201 frequencies at 27 points per frequency decade. At each frequency, admittance was sampled 10 times and averaged. In addition, three consecutive frequency sweeps were taken in order to average out the temperature variations. Total time for described measurement amounts to 60 sec. Measurement functions are the real part of the admittance and the capacitance , where .
In addition to DNA samples, the reference samples were also measured in order to minimize stray impedances, including the free ion contribution and electrode polarization effects, and extract the response due to DNA only Saif91 ; Colby . Reference samples were chosen as NaCl solutions of different molarities, adjusted to have the real part of admittances at 100 kHz the same as DNA solutions. In comparison to these solutions, independent adjustment of capacitance at 1 kHz demanded the reference NaCl concentrations that differ at most by 20%. Since the difference in capacitance between reference NaCl solutions of similar molarities is approximately constant at frequencies above the influence of the electrode polarization, adjusting solely the real part of admittance effectively also adjusts the capacitance up to an additive term. As a result, the subtraction of the reference response successfully eliminated influence of spurious effects down to a low frequency limit in the range 0.5 - 30 kHz, depending on the solution molarity, and up to a high frequency limit of 30 MHz. Generally speaking, electrode polarization effects are larger for higher DNA and added salt concentrations, so that the low frequency bound is shifted to higher frequencies. Assuming that the conductivity contribution of each entity in the solution is additive Osawa71 , the DNA response is given by and , where , is the reference samples response. Finally, the real and imaginary parts of dieletric function are extracted using relations
| (5) | |||||
| (6) |
cm-1 is the chamber constant, where cm2 is the effective electrode cross-section corresponding to the sample of 100 L and cm is the distance between the electrodes. The chamber constant was determined by measuring the real part of admittance at 100 kHz of a 0.01 M and 0.0005 M KCl standard solutions (Mettler-Toledo). It was also corroborated by the difference in capacitance of the chamber when empty and with 100 L of the pure water. In the latter case, the dielectric constant of pure water was used as a standard.
Detailed analysis of the DNA response was made in terms of the complex dielectric function given by a generalization of the Debye expression known as the phenomenological Havriliak-Negami (HN) function Havriliak66
| (7) |
where is the strength of the relaxation process, is the static dielectric constant () and is the high frequency dielectric constant (). is the mean relaxation time, while and are the shape parameters which describe the symmetric broadening of the relaxation time distribution function and skewness, respectively. We worked with since this simplified HN formulation (also known as the Cole-Cole function) has been widely and successfully used to describe relaxation processes in disordered systems.
Measured data were analyzed by using the least squares method in the complex plane Pinteric01 ; Hinrichs97 . Such an approach, which takes into consideration both the real and the imaginary part of the dielectric function at the same time, strongly improves the resolution if compared with the method in which the real and imaginary parts are treated separately. The complex plane method proved itself to be a powerful tool to resolve reliably two close modes in frequency even if the strength of one or both modes does not exceed , provided that the ratio of their dielectric strengths is smaller than the ratio of their positions in frequency.
III Results
We now present results of the dielectric response study performed on DNA solutions prepared according to protocols described in Section II. The obtained dielectric relaxation results for salmon testes and calf thymus DNA samples were essentially the same. For the sake of simplicity, in the remainder of this article we will speak of DNA samples only.
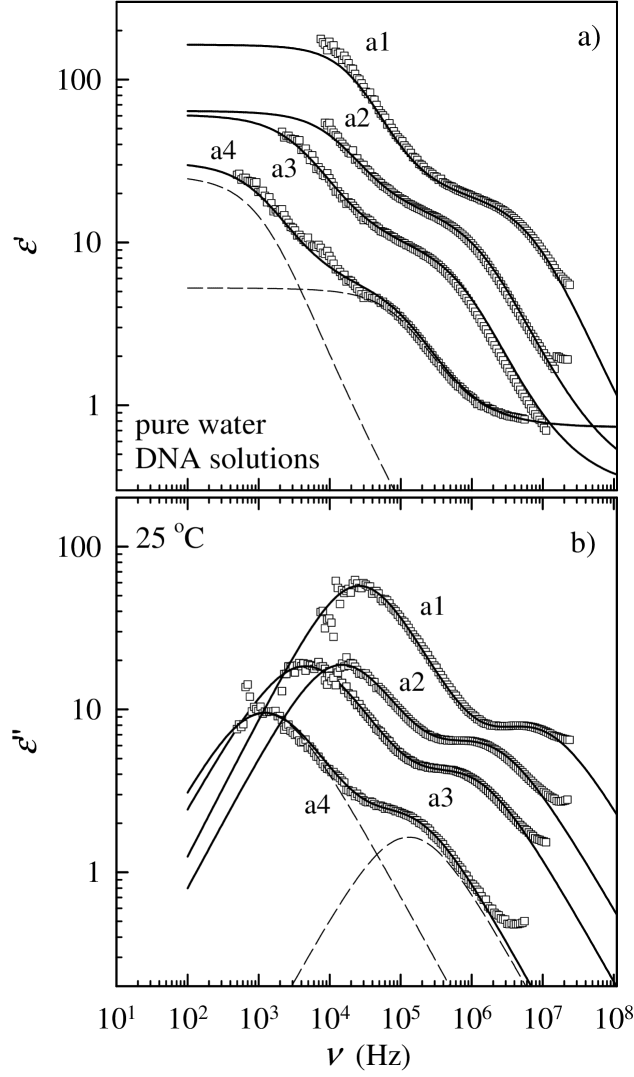
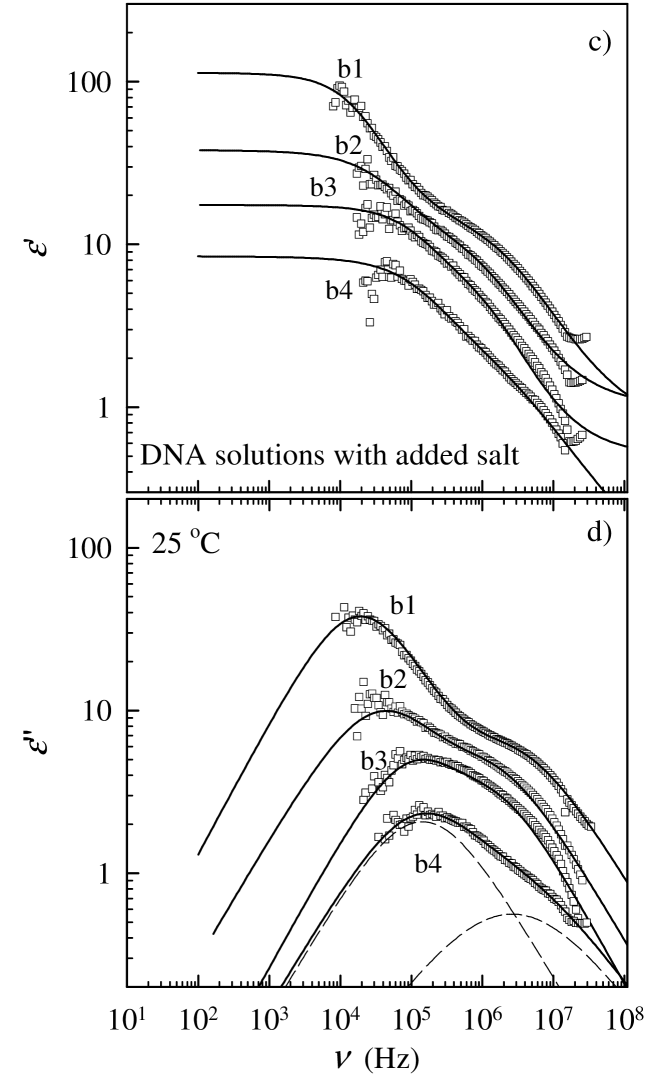
Fig. 1 shows the frequency dependent real and imaginary part of the dielectric function for selected DNA concentrations of DNA solutions. The results for pure water DNA solutions (protocol I, concentrations a1=2.5 mg/mL, a2=0.4 mg/mL, a3=0.1 mg/mL and a4=0.0125 mg/mL) are shown in panel a) and b), while the results for DNA solutions with added salt of ionic strength mM (protocol II, concentrations b1=0.83 mg/mL, b2=0.5 mg/mL, b3=0.31 mg/mL and b4=0.125 mg/mL) are shown in panel c) and d). The observed dielectric response is complex and the data were only successfully fitted to a formula representing the sum of two HN functions. The full lines in Fig. 1 correspond to these fits, while the dashed lines represent single HN forms. The main features of this response, for pure water DNA solutions, as well as for DNA solutions with added salt, are two broad modes, whose amplitude and position in frequency depend on the DNA concentration. The parameter , which describes the symmetrical broadening of the relaxation time distribution function, is concentration independent and similar for both modes . The mode centered at higher frequencies (0.1 MHz15 MHz) is characterized by smaller dielectric strength () than the mode () centered at lower frequencies (0.5 kHz70 kHz). In the remainder of this article, we will refer to these modes as the high-frequency (HF) and low-frequency (LF) mode, respectively.
In what follows, we discuss possible assignments for these relaxation modes inside the framework of existing theoretical approaches for polarization response of charged biopolymers in solution Colby ; Mandel77 ; Mandel84 ; Dukhin80 ; OBrian86 . An applied ac field generates an oscillating flow of net charge associated with DNA counterions counterions and induces polarization. Since the counterion displacement is controlled by diffusion, the dielectric response is basically characterized by the mean relaxation time , where is the associated length scale, and is the diffusion constant of counterions which is sufficiently well approximated by the diffusion constant of bulk ions Colby ; Wong . Since we deal with Na-DNA solutions, we take the diffusion constant of Na+ ions ms. Note that the equation is a scaling relationship and the proportionality constant is of order one (see Discussion, part B).
Several length scales are theoretically expected to be associated with dielectric relaxations of polyelectrolytes in solution: the contour length, the Debye screening length, the polymer chain statistical segment length and the polymer solution mesh size.
The mean relaxation time for pure water DNA solutions, as well as for DNA solutions with added salt, is found in the range s for the HF mode and s for the LF mode. The corresponding characteristic length for the HF mode spans the range from 3 nm to 50 nm, while the characteristic length for the LF mode varies between 50 nm and 750 nm. Both of them are thus not within the range of the contour length distribution in our samples. On the other hand, the Debye screening length, the polymer solution mesh size and the polymer statistical segment length appear as plausible candidates. Moreover, it is noteworthy that specifically the values of the characteristic length for the LF mode are close to the values expected for the DNA persistence length.
III.1 HF mode
First, we address the HF mode. In the case of pure water DNA solutions the characteristic length shows the scaling with respect to the DNA concentration, all the way down to a crossover concentration mg/mL. At that point the scaling form is then changed to (Fig. 2a). The observed behavior at high DNA concetrations conforms exactly to the de Gennes-Pfeuty-Dobrynin (dGPD) Dobrynin ; deGennes76 ; Pfeuty78 scaling form valid for salt-free polyelectrolyte solutions Dobrynin ; Colby . At low DNA concetrations, in the regime below , displays an unusual behavior generally not observed in semidilute solutions. It appears as though at low DNA concentrations local conformational fluctuations partially expose the hydrophobic core of DNA so that the correlation length scales as , as is the case of charged chains with partially exposed hydrophobic cores Dobrynin . In dilute solutions, but only in dilute solutions, this scaling form would be typical for the average separation between chains Dobrynin . The observed crossover might be thought to reflect the border between dilute and semidilute solutions Ito ; Colby corresponding to the crossover concentration deGennes76 . For the shortest fragments of 2 kbp in our DNA solutions, we get of the order of 0.006 mg/mL, while the lowest concentration of DNA solutions is 0.01 mg/mL. In this manner, the interpretation of mg/mL as the dilute-semidilute crossover concentration is ruled out.
With added 1 mM salt, the dGPD behavior of remains unchanged, thus , as long as the concentration of intrinsic counterions (proportional to ) is larger than the concentration of added salt ions (Fig. 2a). When the concentration of intrinsic counterions becomes smaller than the added salt concentrations, the apparently shows a leveling off , with a limiting value close to the Debye length appropriate for this salt concentration. One should be cautious here since the data become much less reliable exactly at low DNA concentrations (see error bars in Fig. 2a). Three sets of additional data (Fig. 2b) for three representative DNA concentrations with varying added salt also seem to reveal that does not vary with in most of the measured range of added salt, while the corresponding Debye screening length in the same range of added salt values decreases substantially. Unfortunately the accuracy of the data again becomes much less reliable due to the progressive merging of the HF and LF modes when one approaches the regime, where the characteristic length scale becomes apparently larger than the nominal Debye length at that salt concentration.
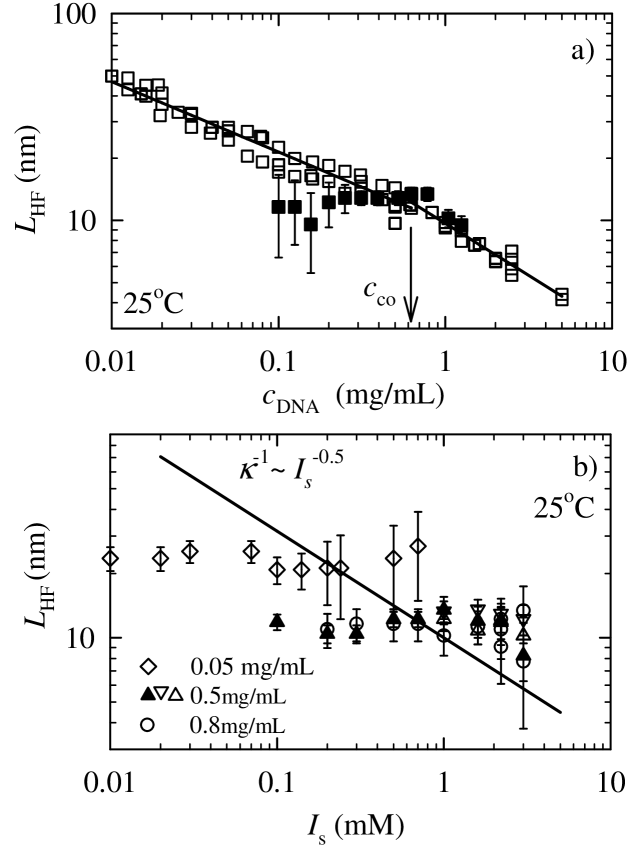
Next we consider the behavior of dielectric strength defined as , where is the fraction of counterions participating in the HF process, 3 mol/mg (as explained in Section II) and is the corresponding polarizability. The polarizability is given by the scaling form , Ito ; Colby . Therefore, the fraction of counterions participating in the HF process is proportional to . In Fig. 3 we show the dependence of on DNA concentration (panel a)) and on the ionic strength of added salt ions (panel b)).
The data for pure water DNA solution displayed in panel a) indicate that the fraction of counterions participating in this relaxation process does not depend on the concentration of DNA. Since the HF relaxation happens at the length scale which describes the density correlations between DNA chains, this result indicates that it is the free counterions as opposed to condensed counterions, that can hop from chain to chain in the volume , that are the relaxation entities participating in the HF process. It is noteworthy that a similar interpretation was previously proposed by Ito et al. Ito for the relaxation in synthetic polyelectrolytes observed in the same frequency range Colby .
The data displayed in Fig.3 b) suggest that the fraction of intrinsic counterions active in the HF mode remains constant when salt is added to the DNA solution as long as is substantially larger than . However, as soon as the concentration of added salt ions prevails over the concentration of intrinsic counterions, starts to decrease. This is also discernible in the behavior of the data for mM added salt solution shown in panel a). A plausible suggestion would be that the salt renormalization of is a consequence of screening due to added salt ions that seem to diminish the effective number of counterions that can participate in the chain - chain hopping process.
III.2 LF mode
Second, we address the LF mode. For pure water DNA solutions (protocol I), the characteristic length increases with decreasing DNA concentration in almost three decades wide concentration range (open inverse triangles in Fig. 4a)) following the power law . The exponent suggests that in this regime is proportional to the average size of the polyelectrolyte chain that behaves as a random walk of correlation blobs and scales as Dobrynin . For DNA solutions with added salt mM (protocol II, full inverse triangles in Fig. 4a)), coincides with the one found for pure water solutions with high DNA concentrations. As soon as the concentration of intrinsic counterions (proportional to ) becomes smaller than the concentration of bulk ions from added salt , starts to deviate from the behavior and decreases to attain value of about 500 Å at which it saturates.
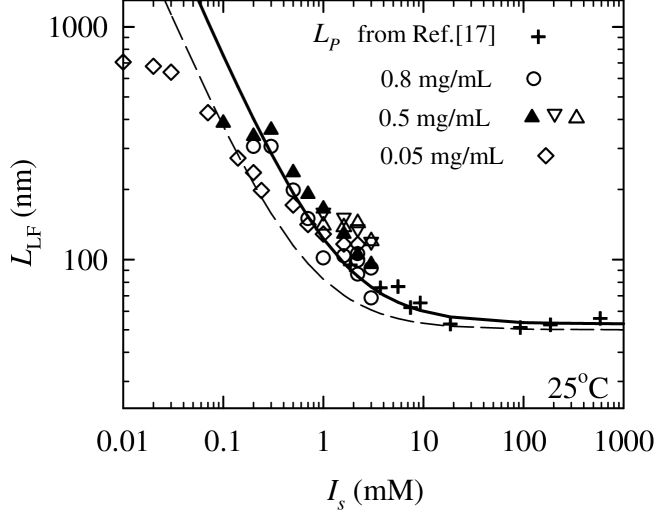
The dependence of on the added salt ionic strength is shown in Fig. 4b) for three DNA concentrations. The observed data can be nicely fit to the OSF behavior Odijk77 ; Skolnick77 of the form: . We get Å for the structural persistence length and ÅM. While the value of close to 500 Å is in accordance with standard expectations for DNA Bloomfield00 , the value of the coefficient is somewhat smaller than expected by the OSF theory ÅM. It is noteworthy that the OSF model applies as long as the ionic strength of added salt is larger than the concentration of the intrinsic counterions. The data for , 0.5 and 0.8 mg/mL deviate from the OSF behavior for mM, mM and mM, respectively. The value of in this low salt limit attains the same value as in pure water DNA solutions (see Fig. 4a).

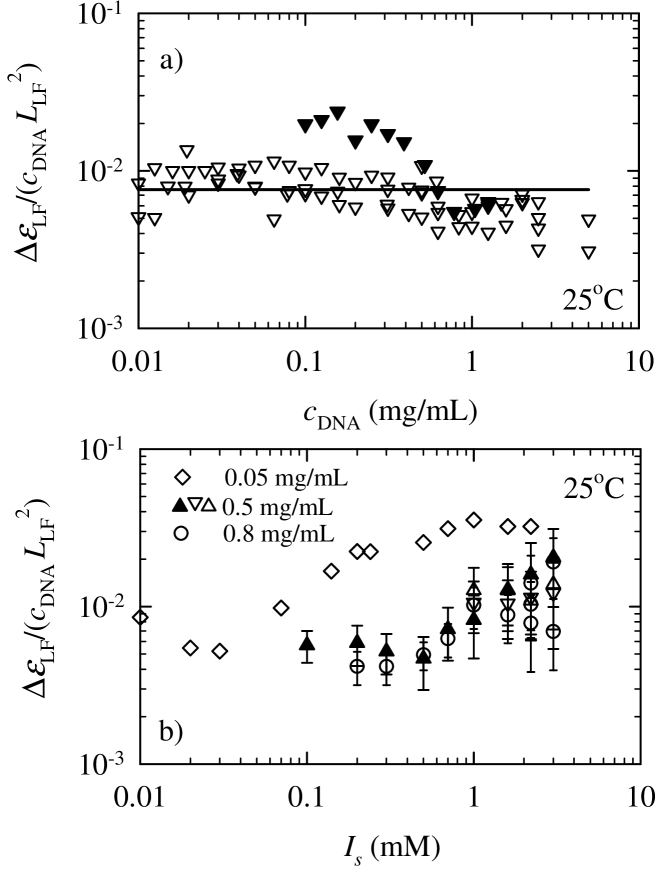
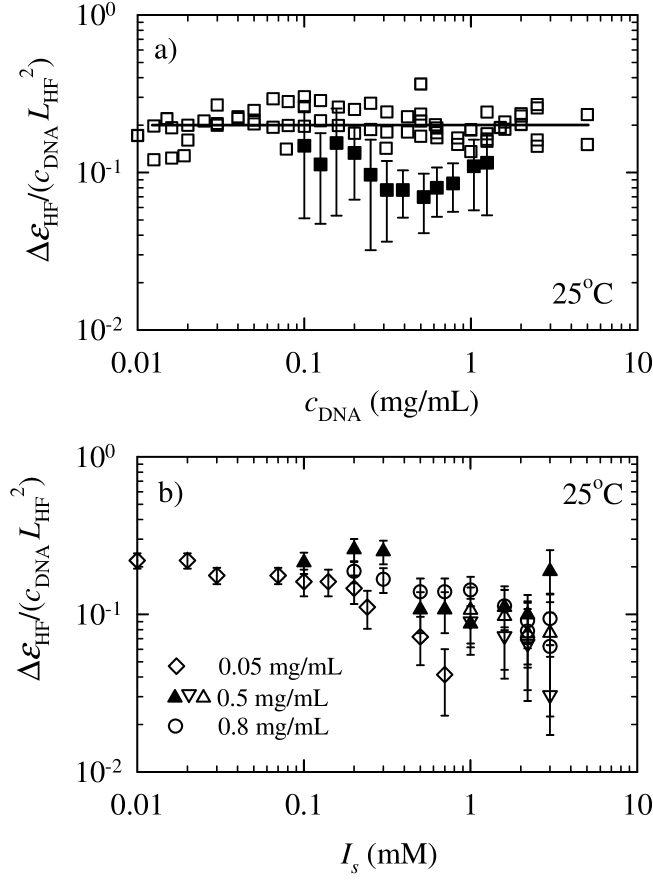
In Fig. 5a) we show dependence of on the DNA concentration assuming again that the polarizability varies as the characteristic length squared. The data show that the fraction of counterions active in the LF mode is roughly speaking independent of the DNA concentration. This is valid for the pure water DNA solution, as well as in the case of mM added salt solution. In our view this result together with the fact that the LF relaxation happens at the length scale of the average size of the polyelectrolyte chain suggests that the LF relaxation engages mostly condensed counterions along and in close vicinity of the chain.
However, the data displayed in panel b), as well as the data for mM in panel a) suggest that the fraction of counterions participating in the LF process becomes larger in the case of added salt solutions, compared to the pure water case, if the concentration of added salt ions becomes larger than . This means that at least some of the free counterions join the relaxation of the condensed counterions along the segments of the same chain. It is thus impossible to completely separate condensed counterions from free counterions in their contribution to the LF relaxation mode. This conclusion bears crucially on the assumption that the scale of polarizability is given by . It is noteworthy that for the HF and LF modes the addition of salt changes the effective number of participating counterions in the opposite way. This might be attributed to the increased screening for the interchain HF relaxation, and to the intrinsic counterion atmospheres squeezed closer to the chains due to reduced Debye length for the LF relaxation along the chain.
As a final remark, we point out that our results showing that the HF relaxation can be attributed to the semidilute mesh size , in the polyelectrolyte semidilute solution in which single chain persistence length associated with the LF relaxation is always larger than , confirm the prediction of Odijk Odijk79 that the same scaling law should also be valid for semiflexible DNA polymers.
IV Discussion
First, let us summarize the results of dielectric spectroscopy measurements. In the linear ac field regime, two broad relaxation modes are observed corresponding to three different time and length scales. The HF mode is centered in the frequency range between 0.1 MHz and 15 MHz, depending solely on the DNA concentration as long as the DNA concentration remains larger than the added salt concentration. In this regime, the characteristic length scale is identified with the mesh size, and varies as . Our data also seem to indicate that once the added salt becomes larger than the concentration of DNA intrinsic counterions, the high frequency characteristic length, rather than scaling as the semidilute solution correlation length, levels off at a value close to the corresponding Debye length. More systematic experiments are needed to asses the possible added salt dependence in this regime of salt concentrations. In the limit of low DNA concentrations and low added salt, the semidilute solution correlation length smoothly crosses over to a less rapid scaling as probably reflecting the appearance of locally fluctuating regions with exposed hydrophobic cores.
The LF mode is centered in the frequency range between 0.5 kHz70 kHz. In DNA solutions with added salt, the characteristic length scale of this mode corresponds to the persistence length, which varies experimentally as . In the limit of low added salt, the characteristic length scale smoothly merges with the average size of the Gaussian chain composed of correlation blobs, which varies with DNA concentration as .
The dielectric data also seem to indicate that the free DNA counterions are mostly responsible for the high frequency relaxational mode, whereas the low frequency mode appears to be more complicated and the decoupling of MO condensed and free DNA counterions seems to be difficult with any degree of confidence.
Investigation of dielectric properties of DNA goes back to early ’60s and since then a reasonable number of papers have been published Nandi00 ; Colby ; Saif91 ; Mandel77 ; Sakamoto76 ; Molinari ; Takashima84 ; Bone95 ; Lee98 . In these studies, two dispersion modes associated with the counterion fluctuations were found, one at very low frequencies, which depended on molecular weight (i.e. degree of polymerization, ) and another one in the intermediate frequency region, which showed no dependence, but did show a pronounced concentration dependence. For the sake of completeness we also mention the third relaxation in the GHz frequency range, which is due to solvent (water) relaxation and therefore not directly a concern of this paper.
The low frequency mode was consistently associated with the DNA contour length, while the intermediate frequency one was often associated with the DNA statistical segment length. These interpretations were based on the theoretical models of the Mandel group Mandel77 ; Mandel84 ; derTouw74 developed for the case of a single polyelectrolyte (limit of very dilute solutions). Another interpretation of the intermediate frequency relaxation, proposed and verified until now only for synthetic monodisperse polyelectrolytes, was that it was due to the counterion fluctuation along the correlation length Colby ; Ito ; Bordy02 . It is worth noting the suggestion of Odijk Odijk79 that the mesh size gives a physical meaning to the statistically independent chain segment length, which also scales as Mandel77 . The segment length was postulated to be due to the potential barriers along the chain, whose origin might be in the correlation length that measures the mean distance between contact points of the overlaping chains deGennes76 .
Our work reveals the existence of two, rather than one, distinct relaxation modes in the s.c. intermediate frequency range due to either a correlated response of counterions in the mesh of DNA chains in the solution, what we call the HF mode, or due to a response of the counterions along a single DNA chain, what we refer to as the LF mode.
No previous experimental work was able to distinguish these two concentration dependent dispersions. The reason probably lies in the fact that the data analysis performed in the reported DNA dielectric spectroscopy studies was not powerful enough to reveal and characterize two modes so close in frequency, where in addition one of them is small in amplitude. Indeed, work by Lee and Bone Lee98 hinted at two overlapping dispersions, but the authors were not able to characterize the smaller one properly. Another reason lies in the fact that none of these investigations covered so wide a range of DNA concentrations and added salt ionic strengths, as we did in this work.
IV.1 Conformation of DNA in low salt solutions
In this work we have paid special attention to the issue of the stability of ds-DNA helix, i.e. to the denaturation phase diagram Bloomfield00 . The issue of DNA conformation in pure water solutions is of paramount importance for proper understanding of our experiments. The question here is whether DNA at very low salt conditions is in the double stranded or single stranded form. Dielectric spectroscopy results strongly indicate that the double stranded form of DNA is stable in all pure water purewater solutions studied. Of course, a precise and definitive information on the polyelectrolyte intrachain conformation of DNA solutions would demand the small-angle neutron scattering and/or X-ray scattering experiments performed at the same conditions.
First evidence for the stability of the ds-DNA form comes from the fact that the results of the dielectric spectroscopy measurements obtained in DNA solutions with added salt prepared from water (protocol II) coincide with the results obtained on DNA solutions prepared from 10 mM NaCl (protocols II, II) (see Fig. 2b), 3b), 4b) and 5b)). Second, we mention that Mandel Mandel77 already reported that dielectric behavior in pure water DNA solutions was not found to differ markedly from that at low salt concentrations. Also the measured osmotic coefficient in nominally pure water conditions Auer69 confirms the assumption of an intact double stranded DNA form. Since the Manning charge density parameters for ss- and ds-DNA are so different this difference should be apparent also in the measured osmotic coefficient. None is detected however.
In an attempt to clarify more this issue, we have measured dielectric properties of pure water DNA solutions for the DNA concentration range between mg/mL and mg/mL, prepared according to protocol I, before and after the controlled denaturation protocol. Denaturation was accomplished by the heating of solutions for 20 min at temperature of 97oC, followed by quenching to 4oC. Dielectric measurements were subsequently made at 25oC. The observed results were similar for all studied DNA solutions. The dielectric strength and the relaxation time of the LF mode decreased substantially after the heating, while the change observed for the HF mode was much smaller (Fig. 6). For mg/mL, the LF mode was not observed at all after the denaturation, implying the dielectric strength (see Fig. 6b)). Notice that of the LF mode for this DNA concentration is about 10.
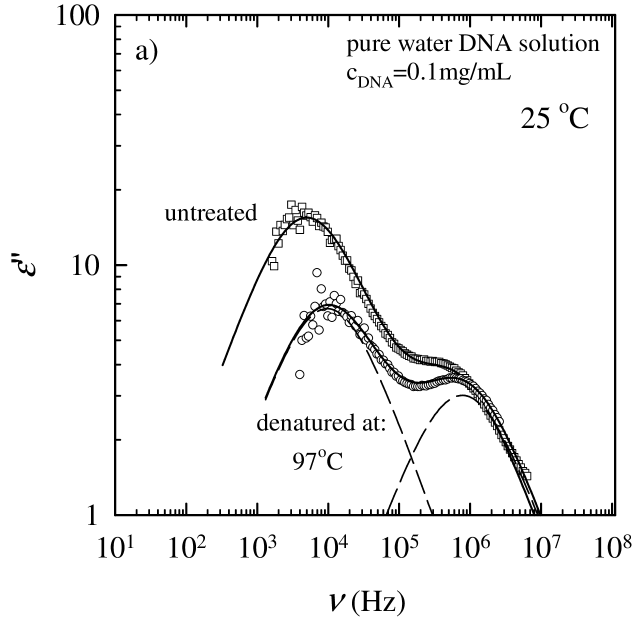
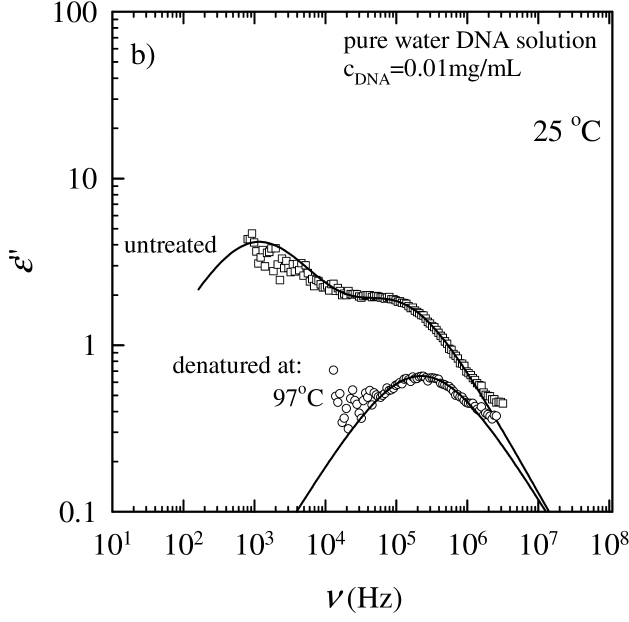
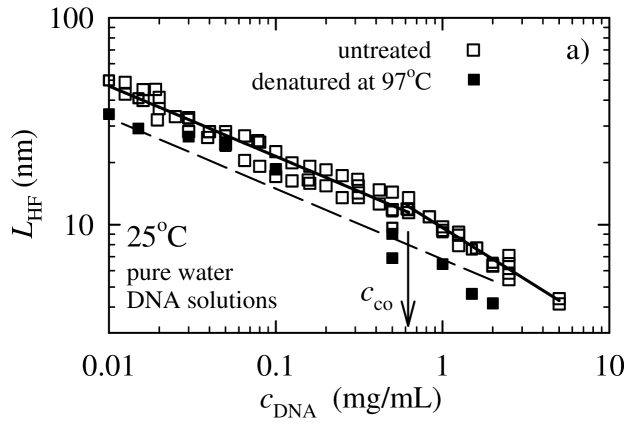
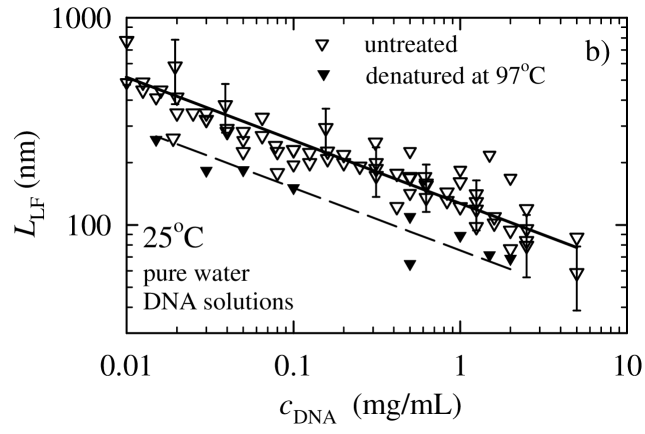
We note that , which measures the average size of the DNA chain, decreased after the heating, but showed the same power law behavior as for the untreated DNA solution (Fig. 7b)). The observed change indicates that denatured ss-DNA, which is in the form of coil, is shorter and has smaller average size of the chain. Furthermore, which measures the correlation length of the DNA solution, decreased after the heating and showed the power law behavior in the whole DNA concentration range (Fig. 7a)). A smaller value of is expected for the denatured DNA solution, since such a solution should contain twice the number chains. The power law behavior with the exponent -0.33, observed now also for the larger DNA concentrations, indicates that the hydrophobic core of DNA is fully exposed once the heating protocol was applied.
All these results confirm that although untreated DNA at low salt and semidilute conditions might show locally exposed hydrophobic cores in a dynamic sense, a real/complete unzipping and separation of the strands might be accomplished only after the denaturation/heating protocol is applied. These observations therefore suggest that DNA in pure water solutions is not denatured into two spatially well separated single strands, but is rather in the double stranded form, locally interspersed with exposed hydrophobic cores in the limit of low DNA concentrations.
Furthermore, even after denaturation the two DNA strands appear to remain in relatively close proximity rather than becoming completely dissociated, an observation well substantiated also by the correlation length measurements by SANS at semidilute DNA conditions Hammouda06A . In these measurements the correlation length measures the characteristic distance between the hydrogen-containing (sugar-amine base) groups. Hammouda and Worcester Hammouda06A have recently determined that on melting of DNA in DNA/d-ethylene-glycol mixtures the correlation length increases from about 8 Å to about 12-15Å, which implies that even after melting the two strands of the ds-DNA remain in very close proximity. This appears to be due to the presence of other chains in the semidilute solution that spatially constrain the separate strands even after melting and prevent complete dissocation Hammouda06B .
The question furthermore arises if the renaturation process is fast enough to occur partially during dielectric measurements which are performed at 25oC. In order to check this, we have repeatedly measured the response of pure water DNA solution, after the heating protocol to 97 oC was applied. The time span was 100 min, the first measurement was taken 3 minutes after the sample was heated from 4oC to 25 oC. The observed response after 3 min and after 100 min was the same (inside the error bar of 1.5%) indicating very long time constant characterizing the renaturation process. This result confirmed that the observed dielectric properties are the ones of ss-DNA.
Osmotic pressure results of Raspaud et al. Raspaud00 on short nucleosomal fragments of DNA also indicate that at high enough concentration, intrinsic DNA counterions prevent destabilization of ds-DNA helix in pure water solutions. These experiments show that the role of added salt () in the ds-DNA stabilization becomes negligible in the high DNA concentration range i.e. in the limit . Osmotic pressure of intrinsic DNA counterions can thus be high enough to prevent denaturation of ds-DNA helix in pure water solutions.
UV spectrophotometry experiments performed previously by Record Record75 on T4 and T7 phage DNA have also shown that ds-DNA denaturation depends not only on added salt concentration , but also on the concentration of intrinsic DNA counterions, 3 mol/mg (see Section II). Moreover, ds-DNA was found to be stable at 25oC dissolved in nominally pure water (no added salt, ) for the concentration of intrinsic counterions larger than 0.2 mM. This again is consistent with our experiments on dielectric relaxation of DNA solutions.
Another meaningful question would be, what is the smallest which can still keep DNA in the double stranded form. The UV absorbance results indicated that no added salt is needed to stabilize ds-DNA in the case when the intrinsic counterion concentration, , is larger than 0.2 mM, while dielectric spectroscopy results suggest it can be one order of magnitude smaller, mM. Notice that in the latter case is still larger than the estimated ion concentration of pure water ( mM), i.e. . The osmotic pressure data indicate Raspaud00 that intrinsic counterions themselves can stabilize ds-DNA for larger than 30 mM and 150 mM for two different added salt concentrations mM and 20 mM, respectively. All these results suggest that the concentrations of intrinsic counterions and added salt themselves are less important, rather it is their ratio that defines which limit prevails. Thus absorbance and osmotic pressure data both suggest that for intrinsic counterions prevail in stabilizing ds-DNA helix, while dielectric results suggest that this ratio might be shifted to . Nevertheless, the unusual scaling exponent -0.33 of the semidilute correlation length found for the DNA pure water solutions with DNA concentrations smaller than mg/mL seem to suggest the existence of local conformational fluctuations which partially expose the hydrophobic core of DNA. In order to verify this proposal a further comparative study, including UV spectrophotometry and dielectric spectroscopy, is planned to study in depth the conformation of DNA in pure water solutions. We are however convinced that in all our investigations DNA did not exist as two separated single coils, rather DNA was effectively always in its double stranded form.
IV.2 Ionic screening: added salt versus intrinsic DNA counterions
Next we address the issue of the respective roles in ionic screening of intrinsic DNA counterions and ions from the added salt. First, we examine conditions under which the OSF expression for the persistence length is valid. Dielectric data show that the influence of the added salt on the persistence length is important as long as the ionic strength is sufficiently larger than the concentration of intrinsic counterions. Plot in Fig. 8 reveals that this condition reads . In this limit where the OSF theory applies, the coefficient should be equal 0.324 ÅM (assuming MO counterion condensation). However, experimentally, different values are found. Measurements of DNA elastic properties as a function of ionic strength also yielded the coefficient in the OSF expression, ÅM Baumann97 , which is different from the one expected from the MO counterion condensation theory. On the other hand, a magnetic birefringence study by Maret and Weill Maret83 suggested the values of between 0.25 and 0.45, therefore indeed close to 0.324. However, the authors fitted their data to the instead to the OSF dependence. The first term represents the influence of free DNA counterions. It is rather obvious that the OSF fit would not yield the MO value of the coefficient . Why thus is there a difference between the MO value and the measured value of the coefficient in the OSF dependence of the persistence length on the ionic strength of the added salt?
In an attempt to reconcile these various values, we have rescaled the persistence length from dielectric measurements as in order to collapse the behavior from dielectric and elastic experiments onto a single curve (Fig. 9). Rescaling is justified since the expression connecting from dielectric properties with the measured mean relaxation time is only valid as a scaling relationship. Numerical factors are less straightforward and are essentially unknown. An exact expression together with an appropriate numerical coefficient, known as the Einstein-Smoluchowski formula, is only known in the dc limit, where .
The fit of this new rescaled version of the to the OSF expression with two free parameters now gave Å and ÅM. The difference between this value of and the one expected from the MO counterion condensation theory signals a different effective linear charge density than the one stemming from the MO counterion condensation theory. This difference in the measured and theoretically expected value of a coefficient of the OSF fitting form for the persistence length would be consistent also with other experiments that provide a value for the effective charge density Podgornik94 .

Finally, let us examine the low salt limit () in which we expect that the intrinsic counterions become dominant. The characteristic length of the LF mode varies with DNA concentration as , or equivalently as . This value of the exponent would allow us to identify with the average size of the Gaussian chain composed of correlation blobs scaling as , where electrostatic interactions are screened by other chains and counterions, and thus DNA acts as its own salt.
V Summary
All these results make it quite clear that for the dielectric properties studied in this contribution the role of free and condensed intrinsic DNA counterions can not always be separated. For the HF relaxation we are reasonably sure that it is mostly the free counterions that act as the relaxation entities in a type of hopping process between the correlated DNA chains in a semidilute polyelectrolyte solution. On the contrary, for the LF relaxation process it seems to be mostly the condensed counterions that relax along or in close proximity to an individual chain in the polyelectrolyte solution, except at large enough salt concentrations where at least some of the free counterions seem to carry on this role.
For the HF relaxation, the experimentally found spatial correlation providing the characteristic size of the relaxation process is given universally by the polyelectrolyte semidilute solution correlation length. The LF relaxation can be characterized by two different correlation scales. At low salt concentration this correlation length can be identified with the average size of the polyelectrolyte chain, where electrostatic interactions are screened by other chains and counterions, thus where DNA acts as its own salt. At higher salt concentrations, the spatial correlations are provided by the single chain orientational correlation length, i.e. the persistence length, that depends on the salt concentration via the OSF mechanism. Both the correlation lengths for the LF relaxation seem to be telling us, that it is the single chain that is responsible for the relaxation process, in which counterions either fluctuate orientationally on the length scale of the persistence length, or they fluctuate between two ends of the average size of the chain in the solution.
In conclusion, our results demonstrate that there are three fundamental length scales that determine the dielectric response of a semidilute DNA solution: the average size of the polyelectrolyte chain in the regime in which DNA acts as its own salt, the OSF salt-dependent persistence length of a single polyelectrolyte chain and the dGPD semidilute solution correlation length or the mesh size of the polyelectrolyte solution. While the free DNA counterions can be identified reasonably well as the relaxation entities of the HF relaxation mode, the LF relaxation mode does not allow for such a clearcut separation between MO condensed and free counterions as relaxation entities. Our data suggest that in fact both of them contribute to various extent in different salt and DNA concentration regimes. Finally, our results confirm that although double-stranded DNA at low salt concentrations shows locally exposed hydrophobic cores in a dynamic sense, unzipping of the strands is accomplished only after the denaturation/heating protocol is applied. But even then this unzipping of the two DNA strands is probably at most local and complete separation of the strands at semidilute solutions is never really accomplished. This issue will be addressed in our further studies.
Acknowledgments
ICP-AES was performed by M. Ujević at the Croatian National Institute of Public Health. We thank T. Ivek, D. Vurnek and R. Žaja for help in the data analysis and electrophoresis measurements. Discussions with D. Baigl, F. Livolant and E. Raspaud are greatly acknowledged. This work was supported by the Croatian Ministry of Science, Education and Sports. Rudi Podgornik would like to acknowledge the financial support of the Agency for Research and Development of Slovenia under grant P1-0055(C).
References
- (1) [
- (2) M. Daune, Molecular Biophysics (Oxford University Press, New York, 2003).
- (3) F. Oosawa, Polyelectrolytes, (Marcel Dekker, New York, 1971).
- (4) K. S. Schmitz, Macroions in Solution and Colloidal Suspension (VCH New York, 1993).
- (5) A. V. Dobrynin and M. Rubinstein, Prog. Polym. Sci. 30, 1049 (2005); A. V. Dobrynin, R. H. Colby and M. Rubinstein, Macromolecules 28, 1859 (1995).
- (6) R. R. Netz and D. Andelman, Phys. Rep. 380, 1 (2003).
- (7) H. Boroudjerdi, Y. -W. Kim, A. Naji, R. R. Netz, X. Schlagberger and A. Serr, Phys. Rep. 416, 129 (2005).
- (8) P. L. Hansen, D. Svensek, V. A. Parsegian and R. Podgornik, Phys. Rev. E 60, 1956 (1999).
- (9) A. Y. Grosberg, T. T. Nguyen and B. I. Shklovskii, Rev. Mod. Phys. 74, 329 (2002).
- (10) P. L. Hansen, R. Podgornik and V. A. Parsegian, Phys. Rev. E 64, 021907 (2001).
- (11) V. A. Bloomfield, D. M. Crothers and I. Tinocco, Jr., Nucleic Acids (University Science Books, Sausalito, 2000).
- (12) R. Das, T. T. Mills, L. W. Kwok, G. S. Maskel, I. S. Millett, S. Doniach, K. D. Finkelstein, D. Herschlag and L. Pollack, Phys. Rev. Lett. 90, 188103 (2003).
- (13) H. H. Strey, V. A. Parsegian and R. Podgornik, Phys. Rev. E 59, 999 (1999).
- (14) R. Podgornik, D. C. Rau and V. A. Parsegian, Macromolecules 22, 1780 (1989).
- (15) R. Podgornik, D. C. Rau and V. A. Parsegian, Biophys. J. 66, 962 (1994).
- (16) T. Odijk, J. Polym. Sci.: Polym. Phys. 15, 477 (1977).
- (17) J. Skolnick and M. Fixman, Macromolecules 10, 944 (1977).
- (18) C. G. Baumann, S. B. Smith, V. A. Bloomfield and C. Bustamante, Proc. Natl. Acad. Sci. USA 94, 6185 (1997).
- (19) M. Ullner, J. Phys. Chem. B 107, 8097 (2003).
- (20) T. Odijk, Macromolecules 12, 688 (1979)
- (21) P. G. de Gennes, P. Pincus, R. M. Velasco and F. Brochard, J. Phys. (Paris) 37, 1461 (1976).
- (22) P. Pfeuty, J. Phys. (Paris) 39, C2-149 (1978).
- (23) C. F. Schmidt, M. Bärmann, G. Isenberg and E. Sackmann, Macromolecules 22, 3638 (1989).
- (24) R. Pethig, Dielectric and Electronic Properties of Biological Materials (J. Wiley, New York, 1979).
- (25) N. Nandi, K. Bhattacharyya and B. Bagchi, Chem. Rev. 100, 2013 (2000).
- (26) F. Bordi, C. Cametti and R. H. Colby, J. Phys.: Condens. Matter 16, R1423 (2004).
- (27) S. Tomić, T. Vuletić, S. Dolanski Babić, S. Krča, D. Ivanković, L. Griparić and R. Podgornik, Phys. Rev. Lett. 97, 098303 (2006).
- (28) Throughout this article by pure water we mean ultrapure MilliQ water with declared conductivity 0.056 S/cm; http://www. millipore. com/markets/bioscience. nsf/home.
- (29) R. F. Steiner and R. F. Beers, Polynucleotides (American Elsevier, New York, 1961).
- (30) W. Beers, A. Cerami, and E. Reich, Proc. Natl. Acad. Sci. USA 58, 1624 (1967).
- (31) B. Saif, R. K. Mohr, C. J. Montrose and T. A. Litovitz, Biopolymers 31, 1171 (1991).
- (32) S. Havriliak and S. Negami, J. Polym. Sci. C 14, 99 (1966).
- (33) M. Pinterić, T. Vuletić, S. Tomić and J. U. von Schütz, Eur. Phys. J. B 22, 335 (2001).
- (34) R. Hinrichs and J. A. H. da Jornada, Rev. Sci. Instrum. 68, 193 (1997).
- (35) W. E. Sonnen, G. E. Wesemberg and W. E. Vaughan, Biophys. Chem. 32, 283 (1988).
- (36) M. Mandel, Ann. NY Acad. Sci. 303, 74 (1977).
- (37) M. Mandel and T. Odijk, Ann. Rev. Phys. Chem. 35, 75 (1984).
- (38) S. S. Dukhin and V. N. Shilov, Adv. Coll. Interface Sci. 13, 153 (1980).
- (39) R. W. O’Brian, J. Coll. Interface Sci. 113, 81 (1986).
- (40) In the literature intrinsic DNA counterions are classified into two groups bearing different names. The first is commonly named as condensed or bound and the second as diffuse or free. Throughout this article we will refer to these two groups as condensed and free counterions.
- (41) T. E. Angelini, R. Golestanian, R. H. Coridan, J. C. Butler , A. Beraud, M. Krisch, H. Sinn, K. S. Schweizer and G. C. L. Wong, Proc. Natl. Acad. Sci. USA 103, 7962 (2006).
- (42) K. Ito, A. Yagi, N. Ookubo and R. Hayakawa, Macromolecules 23, 857 (1990).
- (43) F. Bordi, C. Cametti, T. Gili and R. H. Colby, Langmuir 18, 6404 (2002).
- (44) M. Sakamoto, H. Kanda, R. Hayakawa and Y. Wada, Biopolymers15, 879 (1976).
- (45) R. J. Molinari, R. H. Cole and J. H. Gibbs, Biopolymers 20, 977 (1981).
- (46) S. Takashima, C. Gabriel, R. J. Sheppard and E. H. Grant, Biophysical J. 46, 29 (1984).
- (47) S. Bone and C. A. Small, Biochim. Biophys. Acta 1260, 85 (1995).
- (48) R. Lee and S. Bone, Biochim. Biophys. Acta 1397, 316 (1998).
- (49) F. Van der Touw and M. Mandel, Biophys. Chem. 2, 218 (1974).
- (50) H. E. Auer and Z. Alexandrowicz, Biopolymers 8, 1 (1969).
- (51) B. Hammouda and D. Worcester, Biophys. J. 91, 2237 (2006).
- (52) B. Hammouda, personal communication (2006).
- (53) E. Raspaud, M. da Concei ao and F. Livolant, Phys. Rev. Lett. 84, 2533 (2000).
- (54) M. T. Record, Jr., Biopolymers 14, 2137 (1975).
- (55) G. Maret and G. Weill, Biopolymers 22, 2727 (1983).
- (56) M. N. Spiteri, F. Boué, A. Lapp and J. P. Cotton, Phys. Rev. Lett. 77, 5218 (1996).
- (57) M. Muthukumar, J. Chem. Phys. 105, 5183 (1996).