Far infrared absorption by acoustic phonons in titanium dioxide nanopowders
Abstract
We report spectral features of far infrared electromagnetic radiation absorption in anatase TiO2 nanopowders which we attribute to absorption by acoustic phonon modes of nanoparticles. The frequency of peak excess absorption above the background level corresponds to the predicted frequency of the dipolar acoustic phonon from continuum elastic theory. The intensity of the absorption cannot be accounted for in a continuum elastic dielectric description of the nanoparticle material. Quantum mechanical scale dependent effects must be considered. The absorption cross section is estimated from a simple mechanical phenomenological model. The results are in plausible agreement with the absorption being due to a sparse layer of charge on the nanoparticle surface.
pacs:
36.40.Vz 78.30.-j 63.22.+mI Introduction
The optical properties of nanoparticles (NP) provide avenues for material characterization and for the creation of nanocomposites for customized photonics applications. In particular, the mechanical vibrations (i.e. acoustic phonons) of NP can be observed through low frequency Raman scattering (LFR) and also through ultrafast laser pump-probe experiments (UFLPP). However, the THz frequency range of these acoustic phonons raises the question of whether they can absorb electromagnetic radiation in the far infrared (FIR). This has not been seen before now.
Anomalous FIR absorption of small metal NP has long been predicted due to the discretization of electron energy levels which would otherwise be in a continuum in bulk metal.gorkov65 ; halperin86 This has been experimentally investigated in NP of Cu, Al, Sn and Pb,tanner75 Al,granqvist76 and Ag.devaty84 ; lee85 ; devaty90
There is significant interest in FIR absorption of NP molecules (small groups of NPs) in a strong magnetic field, related to the electronic states.helle05b ; marlo03 ; marlohelle05
However, the FIR properties of insulating NP have been ignored up to now. It is the aim of the present paper to explore FIR absorption of insulating NP with emphasis on the role of acoustic phonons having frequencies in the FIR. It is necessary to proceed with a simultaneous experimental and theoretical investigation. Measurements on the FIR absorption of titanium dioxide NP are presented here, and they indicate the overall absorption cross section per NP. Theoretical estimates are given below of the expected order of magnitude of the portion of FIR absorption cross section per NP due to acoustic phonons.
II FIR absorption
Here we review the basic features of FIR absorption. The general setup of a FIR absorption experiment is that a FIR source is arranged in relation to a FIR detector, with the sample in between. The detector records the transmitted intensity () over a range of frequency, , which went from 15 cm-1 to 200 cm-1 in our case. The transmitted intensity with the sample temporarily removed is (). The transmitted intensity ratio attributed to the effect of the sample is . Let be the thickness of the sample in . The absorption coefficient is obtained by where is the natural logarithm.
When the sample consists of individual NP that each have absorption cross section (in square meters) the total absorbing area is . If is the area of the aperture in which the sample is placed then
| (1) |
There are two distinct reasons why the incident FIR radiation does not reach the detector: (1) scattering and (2) absorption. For samples of NP, absorption strongly dominates. The intensity of Rayleigh scattering from a single NP scales as the diameter to the sixth power, and scales as frequency to the fourth power.tanner75
III FIR absorption of metal NP
Although the focus of this paper is on FIR absorption of insulating NP, it is instructive to review the mechanisms of FIR absorption in metal NP. As noted above, effects of scattering are negligible.
When the diameters of a NP is much smaller than the wavelength of the incident radiation, the NP can be considered to be a dielectric sphere in a static uniform electric field. The dielectric response of a metal NP is related to its conductivity. The motion of polarization charge corresponds to current flow in the NP, and ohmic losses lead to energy absorption. This is the electric dipole mechanism. There is a magnetic dipole mechanism which starts to become dominant over the electric dipole mechanism when the NP is larger. This latter mechanism is also more important when the conductivity is greater.tanner75
The great interest in the subject of FIR absorption of metal NP is in part due to the fact that the observed FIR absorption is orders of magnitude greater than that predicted by the above two mechanisms.tanner75 ; granqvist76 This has led to a great deal of theoretical investigations into mechanisms by which the amount of FIR absorption could be significantly increased.
FIR absorption can be greatly increased by the presence of an oxide surface layer.simanek77 This would have lower conductivity than the metal interior and provide a mechanism for increased energy dissipation. Non-spherical shape of the NP also increases FIR absorption.ruppin79 ; sen82 Clustering of the NP could be modelled in terms of percolationcurtin85 ; noh88 which means that long conducting paths form. The electromagnetic response of NP pairs and chains has also been considered.fu95 Clustering effects can be analyzed in terms of an effective medium either using the Maxwell-Garnet theory or other formulas.marquardt89 Quantum mechanical effects have been considered using the random phase approximationwood82 and density functional theorykurkina96 and other approaches.dasgupta81 ; monreal85 There may be an enveloping electron cloud in a classical description.plyukhin99
Another mechanism is energy dissipation through the excitation of phonons. The excitation of ultrasound phonons through an electromagnetic wave hitting bulk metal has long been known.chimenti74 This possibility was pointed out for FIR radiation striking metal NP.glick78 ; sheng85 ; hua85
IV Confined Acoustic Phonons
The focus of this paper is mechanisms of FIR absorption through coupling of the incident electromagnetic radiation to the mechanical vibrational modes of the NP. This section provides background information on these acoustic phonons.
Approximations about a NP are made as follows: It is an isolated sphere of radius . (Our samples had = 4.5 nm and 7.5 nm.) It is a homogeneous isotropic elastic continuum. It has density and longitudinal and transverse speeds of sound and . For polycrystalline TiO2, = 4097 kg/m3, = 8610 m/s and = 5160 m/s.minnear77 These values are for polycrystalline rutile phase TiO2. The NP in the sample are crystalline and in the anatase phase, whose elastic properties are expected to be somewhat different. We do not consider the distribution of NP sizes within the actual samples or deviations from spherical shape.
Points (material coordinates) within the NP are denoted by . Spatial position is denoted by . If the NP is at rest, then at all points within the NP. Otherwise, vibrations of the NP are described in terms of the displacement field . is a function of material coordinate and time, .
In general, since it is a vector field, is the sum of a zero curl vector field and a zero divergence vector field. The zero curl vector field is expressible as the gradient of a scalar field . The zero divergence field is expressible as the curl of a vector field .
| (2) |
In turn, may be expressed in terms of two scalar fields and .
| (3) |
For a normal mode of frequency , the elastic equations of motion of the NP turn into three independent scalar differential equations:
| (4) | |||||
| (5) | |||||
| (6) |
In spherical material coordinates , and , the above equations have solutions of the following general form (the factors being omitted):
| (7) | |||||
| (8) | |||||
| (9) |
where are spherical Bessel functions of the first kind (nonsingular at the origin) of order and the spherical harmonics. is the angular momentum index and is the z-component of angular momentum, so that .
The boundary condition at is that the , and components of the stress tensor are all zero.
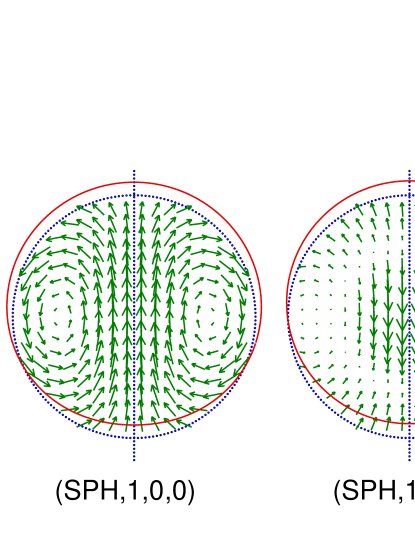
There are two classes of solution.lamb1882 In the first class (torsional modes, TOR) only is nonzero and the displacement field has zero divergence. In the second class (spheroidal modes, SPH) both and are nonzero. There is a special case when where the motion is purely radial. Otherwise, spheroidal motions have both nonzero curl and divergence.
Modes are also indexed in order of increasing frequency by integer . Let denote TOR or SPH. Then we indicate a given mode by (,,,). Its frequency is denoted as , noting that frequencies are independent of . The frequencies of selected modes of a sphere of TiO2 are given in Tab. 1.
| 0 | 3.357 | 40.87 | 24.52 |
|---|---|---|---|
| 1 | 6.555 | 79.79 | 47.87 |
| 2 | 7.660 | 93.25 | 55.95 |
Figure 1 shows the displacement field for the (SPH,1,0,0) and (SPH,1,0,1) modes.
V Selection Rules
Group theoretical argumentsduval92 may be applied to the situation of a NP which is (1) spherically symmetric (2) isolated (3) much smaller than the wavelength of incident radiation (4) isotropic in its dielectric and elastic response. In this case, only the SPH modes can absorb FIR to first order in the incident intensity. Note that this result does not apply to higher order processes in which the scattered intensity is non-linear in the incident intensity.
VI elastic dielectric continuum
The point of this section is that there is no first order absorption of FIR by acoustic phonons in a NP modelled as an elastic dielectric continuum. What is needed is consideration of quantum size effects, treated phenomenologically in a later section.
A continuum description of bulk matter ignores fluctuations of physical quantities on the distance scale of the crystal lattice. Quantities such as density, electric field, charge density, stress and strain are defined as averages over regions which are small and yet large compared to the atomic length scale.
In particular, neutral bulk matter (with no external field) has zero charge density in this macroscopic description, even though there are large microscopic fluctuations of the distribution of charge, more positive where nuclei are located and more negative elsewhere.
Consequently, a weak electric field does not exert force on neutral matter, in this description. If an electric field is externally applied to a NP, there will be a polarization field within the NP, leading to bound surface charge density at the NP surface. is the unit surface normal vector. Since is proportional to the applied field, and since the force on a given point within the NP is the product of the electric field and the charge density, therefore the force on the NP is proportional to the square of the applied field. Finally, the absorbed power would scale as the applied field to the fourth power. Since incident energy flux goes as field to the second power, there is zero absorption cross section at lowest order in the incident electric field.
Direct energy absorption by phonons requires a nonlocal relation between electron current and field, and also that the electron mean free path be longer than the penetration depth of the field, so that the screening is incomplete.glick78
VII Dipolar Phonon
In this section, we consider absorption by the (SPH,=1,,) modes. As mentioned above, group theoretical symmetry arguments show that the selection rules allow FIR absorption by these modes.
The mechanism for (SPH,=1,,) modes to absorb FIR radiation requires a description of the NP that recognizes the different role played by positive and negative charges within the NP. It is well known from density functional theoretical calculations of metal NP that the electrons in a NP tend to move outwards relative to the positive nuclei, leading to a shell of negative charge surrounding the NP, and with its interior slightly positive.
The simplifying assumption that we employ here is that the NP has such an outer shell of negative charge, with total charge . The interior of the NP is positively charged, so that the NP as a whole is neutral.
VIII mass spring model
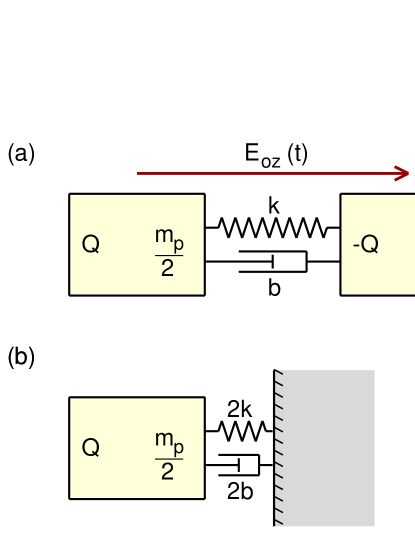
We present here a very simplified phenomenological model of FIR absorption due to the internal vibration of a NP. Let the acoustic phonon (we are thinking of the (SPH,1,0,) mode for some ) be represented by dividing the NP into two pieces, each of mass , as shown in Fig. 2(a). The two parts are connected by a spring with force constant . With only this spring, this system has natural frequency . Furthermore, the system is damped by means of a dashpot connecting the two masses. A dashpot (or shock absorber) exerts a resistance force where is the speed. The physical origin of the damping is not important, but transfer of mechanical energy through physical contact with neighbouring NP in the nanopowder would be one important mechanism.
By symmetry, Fig. 2(a) can be simplified to Fig. 2(b). However, when finding the total power absorption in the NP, the final answer will need to be doubled.
First, considering free damped vibrations of this system, let denote the displacement of the block in Fig. 2(b). The equation of motion is
| (10) |
Assuming
| (11) |
Solving this quadratic, the frequency of free oscillations is a complex number with imaginary part
| (12) |
Next, considering steady state driven vibrations of this system, let the applied electric field (the incident FIR radiation) be . The equation of motion of the system is
| (13) |
The displacement of the block in Fig. 2(b) is where the amplitude is to be determined below. The equation of motion becomes
| (14) |
so that
| (15) |
At resonance, the real part of the denominator vanishes, so that
| (16) |
The velocity of the block is
| (17) |
The instantaneous dissipated power is the applied force on the block, , times the velocity . This is integrated over one full cycle to yield the average dissipated power. Finally, the result is multiplied by 2 to regain the situation of Fig. 2(a).
| (18) |
From considering the non-driven but damped oscillations, we saw in Eq. (12) that , where is the imaginary part of the frequency of damped oscillations.
| (19) |
The incident power flux is given by = where is the peak amplitude of the incident electric field. is the speed of light in vacuum and is the permittivity of free space. For simplicity, the dielectric constant of the matrix in which the NP is supported is assumed to be . The excess absorption cross section for a single NP is found from , yielding
| (20) |
We call this the excess since there are other absorption mechanisms for FIR not related to acoustic phonons.
IX Samples
Anatase TiO2 nanopowders have been prepared by hydrothermal synthesis in subcritical water. Synthesis conditions have already been described elsewhere.MillotJECS05 ; PighiniJNR06 Two powders with different average NP size have been used in this work. They were characterized by X-ray diffraction, surface area measurements, high-resolution electron microscopy and Raman spectroscopy, including LFR, in a previous workPighiniJNR06 where they are labelled HT-3 and HT-7. These techniques were used to determine the crystalline structure and the size of the NP. The average NP diameter, as estimated from LFR, is roughly 4.5 nm for HT-3 and 7.5 nm for HT-7, slightly different values being obtained depending on the technique. LFR revealed well-resolved peaks contrary to previous works on similar nanopowders. This is the sign of a relatively narrow size distribution which is necessary to study size-dependent properties.
X Infrared Measurement
The nanopowder samples were adhered to adhesive tape. FIR absorption measurements were made in a vacuum chamber. The room-temperature transmittance measurements were performed using a Bruker IFS 66v Fourier transform infrared spectrometer for the 15 - 200 cm-1 frequency range with a 4.2 K silicon bolometer. The transmittance ratio of the nanopowders with tape to the tape alone was obtained.
The circular aperture through which the IR passes is about 5 mm in diameter so that the aperture area is = 2.010-5 m2.
We did not do any heat treatments of the TiO2 powder before the IR measurements. Adsorption measurements have shown that the surfaces of the individual NP in these powders is covered by adsorbed water. Applying a vacuum without heating results in a weight loss of approximately 10%. Subsequent heating up to 250oC results in an additional loss of 3%. Condensed water has a weak absorption in the low-frequency range which has been assigned to the “librational modes of structural aggregates of clustered molecules”.HastedCPL85 ; VijCPL89 ; DuvalJCP90 No such signal is expected in the present experimental results because the small amount of water is adsorbed on a large surface ( 300 m2/g) so no such aggregates are possible.
We have tried using high density polyethylene (HDPE) as the substrate, as an alternative to the adhesive tape. HDPE is known to be nearly transparent in the FIR region. We found that HDPE shows somewhat higher transmitted intensity than that of the adhesive tape. However, it is difficult to affix the TiO2 powders on the HDPE surface.
The properties of the two samples are shown in Tab. 2. The mass of one NP, , is found from .
| sample designation | HT-3 | HT-7 | |
| diameter from LFR (nm) | 4.5 | 7.5 | |
| mass of a single NP (kg) | 1.95 | 9.0 | |
| mass of NP on tape (mg) | 5.6 | 4.2 | |
| number of NP on tape () | 29 | 4.6 |
XI Transmittance Spectra
FIR transmission spectra are separately collected for (1) adhesive tape only () and (2) adhesive tape with TiO2 nanopowder adhering (). Necessarily, . Figure 3 shows the transmittance intensity ratio spectra () of the two samples. By definition, the transmittance intensity ratio cannot exceed 1.
Using Eq. (1) it is possible to determine the experimental absorption cross section per NP. As in the case of FIR absorption by metal NP, is generally of the form where is a constant. Let the excess absorption cross section, be defined by
| (21) |
where is the optimum value of the constant to remove the quadratic behavior. is the portion of the absorption cross section due to mechanisms that only apply at special frequencies.

In Fig. 4 and Fig. 5 a quadratic background of the form has been subtracted from the absorption cross section per NP. This reveals peaks. For each sample, there is a peak at approximately 40 cm-1. It should be noted that while the fit of the quadratic background is straightforward for the HT-3 sample, it does not work so well at higher frequencies for the HT-7 sample. However, the resulting peak position in is not sensitive to this uncertainty in fitting the background.


XII Discussion
As Fig. 4 and Fig. 5 illustrate, there are peaks in the absorption cross section once a quadratic background is subtracted. The two peaks at approximately 40 cm-1 can be identified with the 40.87 cm-1 (SPH,1,0,0) mode for the 4.5 nm diameter sample and with the 47.87 cm-1 (SPH,1,0,1) mode for the 7.5 nm diameter sample. From these two figures, the corresponding peak value of , the excess absorption cross section per NP, is given in Tab. 3.
| HT-3 | HT-7 | ||
|---|---|---|---|
| m2 | 710-23 | 1.910-21 | |
| Coulombs | |||
| TiO2 | groups | 1460 | 6770 |
| nm2 | 64 | 180 | |
| H2O | adsorbed | 190 | 540 |
In a realistic environment such as a nanopowder, the NP acoustic phonon modes would be damped by mechanisms such as contact with neighbouring NPs. In this case, the frequency of the damped acoustic phonon can be treated as a complex frequency , where the imaginary part corresponds to damping of the vibration amplitude with time of the form . The value of can be bounded above based on LFR peak linewidths.PighiniJNR06 However, LFR linewidths are due to two phenomena: (1) NP size variation in the sample and (2) acoustic phonon damping. In other words, it is conceivable that the acoustic phonons are very lightly damped and that the observed LFR peak width is due to NP size variation alone. A rough estimate for the bound is that .
Using Eq. (20), may be bounded above:
| (22) |
The values of resulting from this relation are shown in Tab. 3. Since and = , this is equivalent to
| (23) |
The molecular weight of TiO2 is 79.9 g/mol, so that a single “molecule” of TiO2 has mass = 1.3310-25 kg. The number of TiO2 groups for NP in each sample is shown in Tab. 3.
The volume occupied by each TiO2 group is . Assuming that each TiO2 group contributes one electron, the volume of the corresponding region is . Dividing this by yields the thickness of a surface layer on the NP in which the required charge is found. Since is bounded above, this is an upper bound on the layer thickness. For the 4.5 nm and 7.5 nm samples, respectively, the maximum required charge layer thicknesses are 2.110-11 m and 6.410-11 m. These layer thicknesses are on the order of the charge screening length inside bulk material.
Alternatively, we note that the remaining adsorbed water molecules on the NP surface have a density roughly estimated as 3 molecules per square nanometer. Table 3 shows the number of H2O molecules for each sample. It is conceivable that the charge on these strongly polar adsorbed molecules might play a role in the coupling of the (SPH,=1,,) modes to FIR.
XIII Conclusion
This study presents the first direct evidence of absorption of FIR electromagnetic radiation by acoustic phonon modes of NP. The remarkably close agreement between the observed positions of the peaks (in Fig. 4 and Fig. 5) and the theoretical estimates of the frequencies of the (SPH,=1,,) acoustic phonon modes provides evidence for the correctness of this interpretation. In addition, the excess absorption cross section (above the smooth quadratic background) per NP is in plausible agreement with a simple theoretical model.
Additional studies will be needed to verify the agreement in observed and predicted peak position over a wider range of NP dimensions and materials. needs to be measured for nanopowder samples with varying , NP material, and conditions affecting adsorbed surface materials. This could provide an experimental test for any proposed improvements to the simple theoretical model of NP FIR absorption that we have proposed.
Once more extensively studied, FIR absorption by NP acoustic phonons has the potential to become an important diagnostic probe of nanopowder properties, such as particle size distribution, complementing existing techniques such as LFR and UFLPP. In particular, FIR absorption is sensitive to the (SPH,=1,,) modes while LFR is primarily sensitive to the (SPH,=2,,0) modes and UFLPP is sensitive only to the (SPH,0,0,) modes. Comparison of frequencies for these three kinds of modes could be a useful test of the accuracy of the elastic continuum model of NP vibrations.
XIV Acknowledgements
D. B. M. acknowledges support from the Natural Sciences and Engineering Research Council of Canada. H. L. L. acknowledges support from the National Science Council of the Republic of China under grants NSC 94-2112-M-003-002 and 94-2120-M-007-013, and from National Taiwan Normal University under Grant No. ORD93-B. M. Blades and A. Plyukhin are thanked for their assistance.
References
- (1) L. P. Gorkov and G. M. Eliashberg Sov. Phys.-JETP 21 (1965) 940.
- (2) W. P. Halperin Rev. Mod. Phys. 58 (1986) 533.
- (3) D. B. Tanner, A. J. Sievers, and R. A. Burhman Phys. Rev. B 11 (1975) 1330.
- (4) C. G. Granqvist, R. A. Buhrman, J. Wyns, and A. J. Sievers Phys. Rev. Lett. 37 (1976) 625.
- (5) R. P. Devaty and A. J. Sievers Phys. Rev. Lett. 52 (1984) 1344.
- (6) S. I. Lee, T. W. Noh, K. Cummings, and J. Gaines Phys. Rev. Lett. 55 (1985) 1626.
- (7) R. P. Devaty and A. J. Sievers Phys. Rev. B 41 (1990) 7421.
- (8) M. Helle, A. Harju, and R. M. Nieminen Phys. Rev. B 72 (2005) 205329.
- (9) M. Marlo, A. Harju, and R. M. Nieminen Phys. Rev. Lett. 91 (2003) 187401.
- (10) M. Marlo-Helle, A. Harju, and R. M. Nieminen Physica E 26 (2005) 286.
- (11) E. Simánek Phys. Rev. Lett. 38 (1977) 1161.
- (12) R. Ruppin Phys. Rev. B 19 (1979) 1318.
- (13) P. N. Sen and D. B. Tanner Phys. Rev. B 26 (1982) 3582.
- (14) N. W. Curtin and N. W. Ashcroft Phys. Rev. B 31 (1985) 3287.
- (15) T. W. Noh, S. I. Lee, Y. Song, and J. R. Gaines J. Phys. C: Solid State Physics 21 (1988) 1849.
- (16) L. Fu and L. Resca Phys. Rev. B 52 (1995) 10815.
- (17) P. Marquardt and G. Nimtz Phys. Rev. B 40 (1989) 7996.
- (18) D. M. Wood and N. W. Ashcroft Phys. Rev. B 25 (1982) 6255.
- (19) L. I. Kurkina and O. V. Farberovich Phys. Rev. B 54 (1996) 14791.
- (20) B. B. Dasgupta Phys. Rev. B 24 (1981) 554.
- (21) R. Monreal, P. de Andrés, and F. Flores J. Phys. C: Solid State Phys. 18 (1985) 4951.
- (22) A. V. Plyukhin, A. K. Sarychev, and A. M. Dykhne Phys. Rev. B 59 (1999) 1685.
- (23) D. E. Chimenti Phys. Rev. B 10 (1974) 3228.
- (24) A. J. Glick and E. D. Yorke Phys. Rev. B 18 (1978) 2490.
- (25) P. Sheng Phys. Rev. B 31 (1985) 4906.
- (26) X. M. Hua and J. I. Gersten Phys. Rev. B 31 (1985) 855.
- (27) W. P. Minnear and R. C. Bradt, “Elastic properties of polycrystalline TiO2-x,” J. Am. Ceramic Soc. 60 (1977) 458–459.
- (28) H. Lamb Proc. London Math. Soc. 13 (1881-1882) 189–212.
- (29) E. Duval Phys. Rev. B 46 (1992) R5795–R5797.
- (30) N. Millot, B. Xin, C. Pighini, and D. Aymes, “Hydrothermal synthesis of nanostructured inorganic powders by a continuous process under supercritical conditions,” J. Europ. Ceram. Soc. 25 (2005) 2013.
- (31) C. Pighini, D. Aymes, N. Millot, and L. Saviot, “Low-frequency Raman characterization of size-controlled anatase TiO2 nanopowders grown by continuous hydrothermal synthesis,” J. Nanoparticle Research. accepted.
- (32) J. B. Hasted, S. K. Husain, F. A. M. Frescura, and J. R. Birch, “Far-infrared absorption in liquid water,” Chem. Phys. Lett. 118 (1985) 622–625.
- (33) J. K. Vij, “Millimeter and submillimeter laser spectroscopy of water,” Chem. Phys. Lett. 155 (1989) 153–156.
- (34) J. L. Rousset, E. Duval, and A. Boukenter, “Dynamical structure of water: Low-frequency Raman scattering from a disordered network and aggregates,” J. Chem. Phys. 92 (1990) 2150–2154.