Healing Length and Bubble Formation in DNA
Abstract
We have recently suggested that the probability for the formation of thermally activated DNA bubbles is, to a very good approximation, proportional to the number of soft AT pairs over a length that depend on the size of the bubble and on the temperature of the DNA. Here we clarify the physical interpretation of this length by relating it to the (healing) length that is required for the effect of a base-pair defect to become neligible. This provides a simple criteria to calculate for bubbles of arbitrary size and for any temperature of the DNA. We verify our findings by exact calculations of the equilibrium statistical properties of the Peyrard-Bishop-Dauxois model. Our method permits calculations of equilibrium thermal openings with several order of magnitude less numerical expense as compared with direct evaluations.
I Introduction.
Local separation of double-stranded DNA into single-stranded DNA is fundamental to transcription and other important intra-cellular processes in living organisms. In equilibrium, DNA will locally denaturate when the free energy of the separated single-stranded DNA is less than that of the double-stranded DNA. Because of the larger entropy of the flexible single-strand, the more rigid double-strand can be thermally destabilized locally to form temporary “bubbles” in the molecule already at physiological temperatures stjaalet . Considering this entropic effect together with the inherent energetic heterogeneity – GC base pairs are 25 % more strongly bound than the AT bases – of a DNA sequence, it is plausible that certain regions (subsequences) are more prone to such thermal destabilization than others. In fact recent work donald demonstrates not only that such a phenomena exists but more importantly that the location of these large bubble openings in a variety of DNA sequences coincide with sites active during transcription events. This discovery represent a significant advance in the understanding of the relationship between local conformation and function in bio-molecules. While there is no guarantee that this mechanism applies to all transcription initiation events, the present agreement is very encouraging. Similarly, other large bubbles identified may well have a relationship to other biological functions. The agreement is based on the Peyrard-Bishop-Dauxois (PBD) model, dpb , which evidently contains some essential basic ingredients –local constraints (nonlinearity), base-pair sequence (colored disorder) and entropy (temperature). The equilibrium thermodynamic properties of the model were numerically calculated from the partition function using the transfer integral operator method (TIO). (A complementary direct numerical evaluation of the partition function has been reported in Ref. peynew ). This allows the precise evaluation of probabilities of bubbles as a function of temperature, location in a given base-pair sequence, and bubble size. In recent work euro , we reported that the probabilities of finding bubbles extending over sites do not depend on a specific DNA subsequences. Rather, such probabilities depend on the density of soft A/T base pairs within a region of length . Here we suggest that this characteristic length is simply related to the characteristic distance away from an AT base pair – considered as a defect placed in a homogeneous GC-sequence– where the probability values of the base pairs return to the GC bulk-value. Lastly, based on this concept of effective density approximation, we examine five different human promoter sequences, and demonstrate the striking agreement in the predictions from the two methods.
II The PBD model and the TIO method.
The potential energy of the PBD model is
| (1) | |||
| . | (2) |
Here , represents the nonlinear hydrogen bonds between the bases; is the nearest-neighbor coupling that represents the (nonlinear) stacking interaction between adjacent base pairs: it is comprised of a harmonic coupling with a state-dependent coupling constant effectively modeling the change in stiffness as the double strand is opened (i.e. entropic effects). The sum in Eq.(2) is over all base-pairs of the molecule and denotes the relative displacement from equilibrium bases at the base pair. The importance of the heterogeneity of the sequence is incorporated by assigning different values to the parameters of the Morse potential, depending on the the base-pair type. The parameter values we have used are those in Refs. campa ; para chosen to reproduce a variety of experimentally observed thermodynamic properties.
The equilibrium thermodynamic properties of the PBD model can be calculated from the partition function
| (3) | |||||
| (4) |
where we have introduced the notation
and is the Boltzmann factor. In order to evaluate the partition function (3) using the TIO method, we first symmetrize by introducing dp
Here the second equality holds only when and correspond to base-pairs of the same kind. Using Eq. (3) the expression for is rewritten as
| (7) | |||||
where open boundary conditions at , and have been used. To proceed, a Fredholm integral equations with a real symmetric kernel
| (8) |
must be solved separately for the A/T and for the G/C base-pairs.
Since the eigenvalues are orthonormal and the eigenfunctions form a complete basis, Eq.(8) can be used sequentially to replace all integrals by matrix multiplications in Eq. (7). Unlike in Ref. zhang where the kernels were expanded in terms of orthonormal bases, here we choose to use Eq. (8) iteratively. In this way we reduce the number of integral equations that need to be solved from 4 to 2, and at the same time the matrices that need to be multiplied are lower dimensional. Whenever the sequence heterogeneity results in a non-symmetric , Eq.(8) cannot be used and we resort to a symmetrization technique, based on successive introduction of auxiliary integration variables, as explained in Ref. thesis .
We evaluate the probabilities , for a base-pair opening spanning k base-pairs (our operational definition of a bubble of size ), starting at base-pair as
| (9) |
where is the separation (which we have here taken as 1.5 Å) of the double strand above which we define the strand to be melted.
III Lengthscales and effective density approximation.
In Ref.euro we suggested that the probabilities of finding bubbles extending over sites localized around a given bp, is, to a very good approximation, proportional to the density of soft A/T base pairs within a region of length centered around the same bp, an approach we term here as effective density approximation (EDA). The lengths were obtained from numerical transfer integral calculations of the bubble probabilities of several simple (but experimentally realizable) sequences. The A/T density profiles were therefore compared with the exact probabilities for thermal activation of bubbles of sizes and of a wild and a mutant version of the AAV P5 promoter. The agreement was excellent. However, no physical explanation for the origin of these characteristic lengths was provided nor were they connected to any intrinsic length of the PBD model. But, since they appear prominently in the formation of DNA bubbles, it is important to investigate both of these questions.
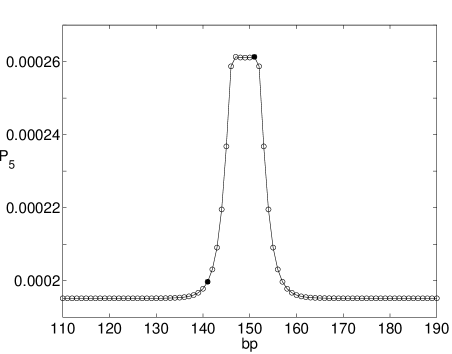
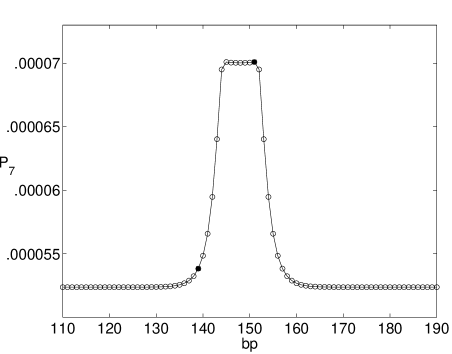
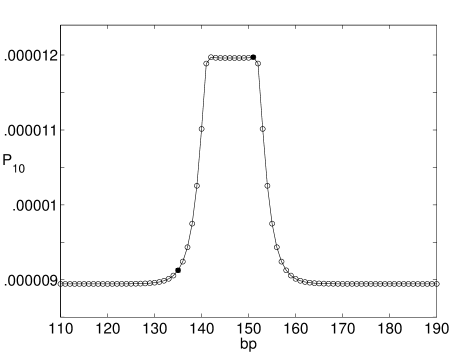
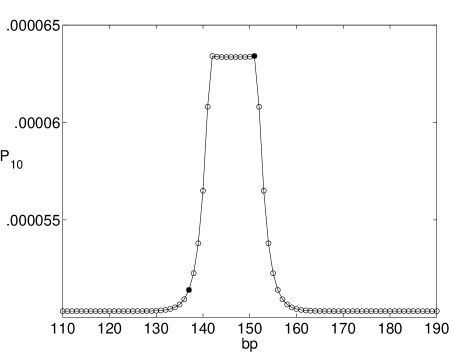
In Figs.1-3 we consider a sequence composed of G/C A/T G/C. In other words, we place a defect (A/T instead of G/C) at the site . This defect is bp away from the two ends of the sequence in order to eliminate boundary effects.
A/T base pairs have a smaller bonding energy than GC bps. Therefore, the A/T defect softens a number of GC-bps around it and increases the opening probability. Clearly, sufficiently away from the defect the opening probability regains the bulk value of a homogeneous G/C-sequence at the given temperature, given threshold and given bubble size. Our claim is that the characteristic length is the distance necessary to be away from the defect so that the G/C bps there are no longer affected. This can be quantified by calculating the relative fluctuation
| (10) |
where is the bp site obtained counting downstream from the defect site, see Figs.1-3, and at site we assume that the bulk value has been regained. The remarkable finding is that with the choice of considered in our previous work euro , obtained independently by merely fitting the full numerical TIO calculations of the bubble formation probabilities of different simple sequences, we obtain from Eq.(10) , independently from the size of the bubble and the temperature of the DNA sequence. This can be seen in Figs.1-3: the circle at is the A/T defect, while the circles at are the positions of the bp at . We can therefore reverse the perspective and define the characteristic length as the one given by Eq.(10), with . This is important for pratical applications, since it gives a simple criterion to estimate bubbles probabilities for arbitrary bubble sizes and DNA temperatures (and arbitrary PBD inter base-pairs interaction parameters), but it also immediately suggests a simple physical explanation for .
We parametrize the decay of the probability values as a function of the downstream distance from the A/T defect according to
| (11) |
where is the probability for finding a bubble of size located at the site , is the bulk value of the homogeneous G/C sequence and is the value of the probability at the site , which is the same as the probability value of the defect site . is the healing length of the system, namely the characteristic length for the perturbation to die out, which, quite generally, depends on the size of the bubble, temperature of the DNA and the parameters of the PBD model. Replacing Eq.(11) in Eq.(10), we obtain the relation , where . We emphasize that both and are independent of the size of the bubble. It follows that there is a simple linear relation between the healing and characteristic lengths:
| (12) |
This is a very important result of this report. The healing length can be easily calculated as a function of the bubble size and temperature with an homogeneous G/C sequence plus a single defect, as shown above. From this, we can calculate the value of and, therefore, estimate the probability for the creation of bubbles for arbitrary DNA sequences at any temperature. For instance, for bubbles of size , we obtain , while for bubbles of size we have at and PBD parameters as in para .
In order to examine how the values of the parameters of the PBD model affect those of , we set and repeat the calculation of . Since, when decreases, so does the ”cooperativity” of the base base pairs, one would expect to observe a drop in the value. This is indeed the case: , while for the value as 16.
We will show in the next Section how this approach compares with exact transfer integral operator calculations of the statistical properties of the PBD model.
We conclude this Section by noting that the Figs. 1-3 exhibit symmetry, but not with respect to the defect. While the defect is always at , the symmetry is with respect to bp 149 in the case, 148 in the case, and the axis that separates bps 146-147 in the case. Another feature is the existence of a second local maximum with the same value as , and a slight drop in the probability values in the middle of the peak. We notice that the two maxima are located at sites and . This suggests that a bubble with a defect at its boundary has a higher probability to form: in the case the defect is at the end of the bubble, while in the case it is at the begining of the bubble. Also, the probability drops in the middle of the peak because the bubble there contains a defect that is trapped within G/C bps, and it turns out that the probability of formation of a bubble of this kind is smaller.
IV Comparison of the EDA and TIO Method.
We now compare the probability profiles obtained from the effective density approach with the characteristic length calculated as in the previous Section, with exact results obtained with the TIO method. We consider five different human genome subsequences, and compare the calculations for the probability of formation of bubbles of sizes and .
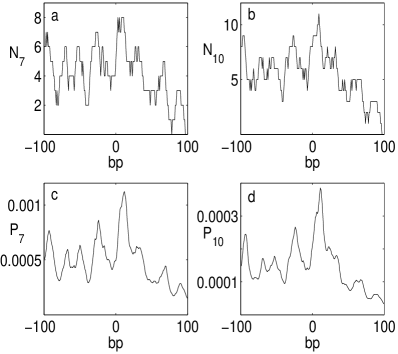
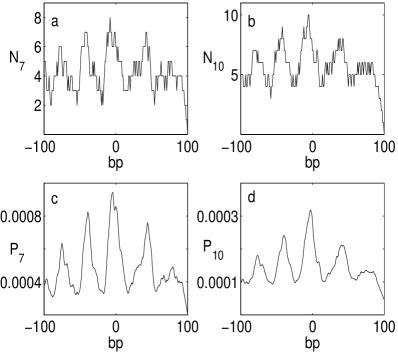
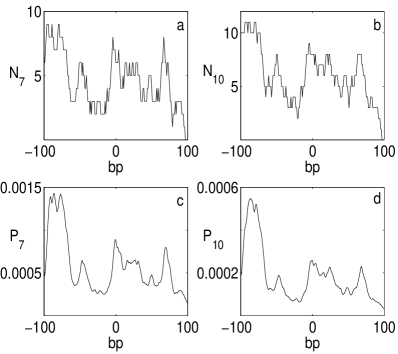
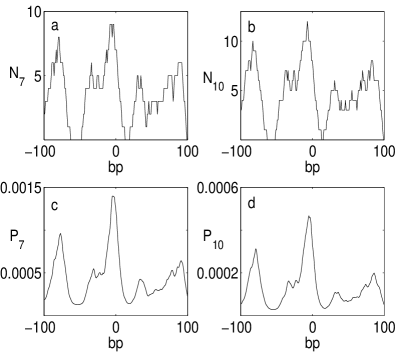
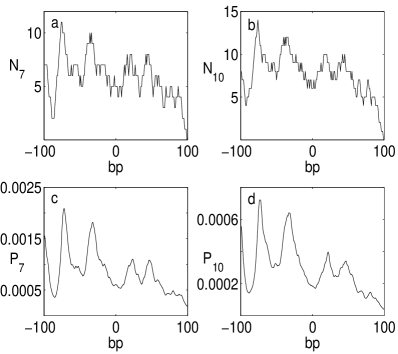
In the panels of Figs.5-9 we plot (as a function of the bp site) the number and of A/T bps calculated over a distance (panel a) and (panel b). These A/T density profiles can be compared with the probability for the thermal creation of bubbles of seven, , and ten, , sites, panels . In all cases (and in several other not reported here) the resemblance in the main features of the respective profiles is striking. In particular, EDA correctly predicts the locations and relative weights of the probability peaks. The crucial point is that, while the profiles obtained with the EDA requires few seconds to be calculated, the full TIO methods is very time consuming (of the order of several hours in the cases presented here). To fully appreciate this advantage, we note that with the EDA the entire human genome can be sequenced for bubble formation probabilities in few minutes, while a statistical approach based on the calculation of the partition function is clearly impossible.
V Conclusions.
It has been suggested that the DNA transcription initiation sites can coincide with the location of large bubble openings. A thorough investigation of this hypothesis requires the statistical analysis of many DNA promoters within the PBD model. Such a task becomes quickly prohibitive when studying bubble-promoter correlations in a significantly large number of cases (namely, for large sequences). This problem has motivated the development of an alternative simplified approach to calculate the bubble formation probabilities. We have found that this probabilities are proportional to the density of soft A/T base-pairs calculated over an effective length which depends on the size of the bubble and the temperature of the DNA. We have clarified the physical origin of such a length and suggested a simple procedure for its caluclations. The results of our effective density approach are in extremely good agreement with full exact calculations, but with a numerical effort reduced by several order of magnitudes. In this way, the full human genome can be analyzed, opening a unique possibility to understand the existence and nature of the correlations between thermally activated bubbles and promoters.
VI Acknowledgments
Work at Los Alamos National Laboratory is supported by the US Department of Energy under contract contract No. W-7405-ENG-36.
References
- (1) M. Gueron, M. Kochoyan, and J.L. Leroy Nature 328, 89 (1987); M. Frank-Kamenetskii Nature 328 17 (1987).
- (2) C.H. Choi, G. Kalosakas, K.Ø. Rasmussen, M. Hiromura, A. R. Bishop and A. Usheva, Nucleic Acids Res. 32, 1584, (2004).
- (3) M. Peyrard and A. R. Bishop, Phys. Rev. Lett, 62, 2755, (1989); T. Dauxois, M. Peyrard and A. R. Bishop, Phys. Rev. E 47 R44 (1993).
- (4) Z. Rapti, A. Smerzi, K.Ø. Rasmussen, A.R Bishop, C.H. Choi and A. Usheva, cond-mat/0511128
- (5) T. S. van Erp, S. Cuesta-Lopez, J.-G. Hagmann, and M. Peyrard Phys. Rev. Lett. 95, 218104 (2005).
- (6) A. Campa and A. Giansanti, Phys. Rev. E, 58, 3585, (1998).
- (7) T. Dauxois and M. Peyrard, Phys. Rev. E 51 4027 (1995).
- (8) Y. Zhang, W.-M. Zheng, J.-X. Liu, and Y. Z. Chen, Phys. Rev. E, 56, 7100, (1997).
- (9) The parameters were chosen in Ref. campa to fit thermodynamic properties of DNA: , , for the inter-site coupling; for the Morse potential , for a G-C bp, , for the A-T bp.
- (10) M. B. Fogel, Nonlinear Order Parameter Fields: I. Soliton Dynamics, II. Thermodynamics of a Model Impure System, Ph.D. Thesis, Cornel University, (1977).