Failure process of a bundle of plastic fibers
Abstract
We present an extension of fiber bundle models considering that failed fibers still carry a fraction of their failure load. The value of interpolates between the perfectly brittle failure and perfectly plastic behavior of fibers. We show that the finite load bearing capacity of broken fibers has a substantial effect on the failure process of the bundle. In the case of global load sharing it is found that for the macroscopic response of the bundle becomes perfectly plastic with a yield stress equal to the average fiber strength. On the microlevel, the size distribution of avalanches has a crossover from a power law of exponent to a faster exponential decay. For localized load sharing, computer simulations revealed a sharp transition at a well defined value from a phase where macroscopic failure occurs due to localization as a consequence of local stress enhancements, to another one where the disordered fiber strength dominates the damage process. Analysing the microstructure of damage, the transition proved to be analogous to percolation. At the critical point , the spanning cluster of damage is found to be compact with a fractal boundary. The distribution of bursts of fiber breakings shows a power law behaviour with a universal exponent equal to the mean field exponent of fiber bundles of critical strength distributions. The model can be relevant to understand the shear failure of glued interfaces where failed regions can still transmit load by remaining in contact.
pacs:
46.50.+a,62.20.Mk,64.60.-iI Introduction
The failure of heterogeneous materials under various types of external loading conditions has attracted continuous scientific and technological interest during the past decade Herrmann and Roux (1990); Chakrabarti and Benguigui (1997). Both the macroscopic strength and the process of damaging of loaded specimens strongly depend on the disordered microscopic properties of the material. Hence, most of the theoretical studies are based on discrete models which can account for the disordered material properties and their interaction with the inhomogeneous stress field naturally arising in a damaged specimen. Fiber bundle models (FBM) are one of the most important theoretical approaches in this field Daniels (1945), which also served as the basis for the development of more complicated micromechanical models of fracture Harlow and Phoenix (1978); Curtin (1998); Kun and Herrmann (2000). In spite of their simplicity, FBMs capture the most important ingredients of the failure process and make it also possible to obtain several characteristic quantities of high interest in closed analytic form. Based on FBMs important results have been obtained for the macroscopic response of the loaded specimen Pradhan and Chakrabarti (2003), and for the temporal Kloster et al. (1997); Pradhan et al. (2005); Pradhan and Hansen (2005); Hidalgo et al. (2001) and spatial structure of damage on the microlevel. In the framework of FBM the analogy of fracture and critical phenomena Andersen et al. (1997); Moreno et al. (2000); Kun et al. (2003); Bhattacharyya et al. (2003) has also been addressed, which is of high practical importance for the forecasting of imminent failure of loaded systems Pradhan and Chakrabarti (2002); Pradhan et al. (2005).
Fiber bundle models have also been adopted to study the failure of glued interfaces of solid blocks Batrouni et al. (2002); Zapperi et al. (2000); Knudsen and Massih (2005); Delaplace et al. (2001). Such interfaces as a part of complex constructions, are assumed to sustain various types of external loads. In fiber reinforced composites, where fibers are embedded in a matrix material, the fabrication of the fiber-matrix interface strongly affects the mechanical performance of the composite. Very recently we have shown that under shear loading of glued solid blocks, the interface elements may suffer not only stretching but also bending Raischel et al. (2005). In order to capture this effect we proposed to discretize the interface in terms of beams which can be elongated and bent, and break due to both deformation modes in a complex way. During the gradual failure of interfaces of solid blocks under shear, damaged regions of the interface can still transmit load contributing to the overall load bearing capacity of the interface. This can occur, for instance, when the two solids remain in contact at the failed regions and exert friction force on each other. In many applications the glue between the two interfaces has disordered properties but its failure characteristics is not perfectly brittle, the glue under shear may also yield carrying a constant load above the yield point.
We present an extension of models of the shear failure of glued interfaces considering that surface elements after failure still can have a certain load bearing capacity. The disordered interface is represented by a parallel set of fibers with random breaking thresholds and linearly elastic behavior until failure. The broken fibers are assumed to carry a constant load which is a fraction of their failure load. Varying the value of the model interpolates between the perfectly brittle () and perfectly plastic () constitutive behavior of fibers. Based on analytic calculations and computer simulations, we show that the finite load bearing capacity of failed fibers has a substantial effect on both the macroscopic response and microscopic damage process of the fiber bundle. When the load redistribution following fiber failure is short ranged, an interesting phase transition is revealed at a specific value of .
II Model
In order to model the shear failure of glued interfaces, we recently introduced a model Raischel et al. (2005) which represents the interface as an ensemble of parallel beams connecting the surfaces of two rigid blocks. The beams are assumed to have identical geometrical extensions (length and width ) and linearly elastic behavior characterized by the Young modulus . In order to capture the failure of the interface, the beams are assumed to break when their deformation exceeds a certain threshold value. Under shear loading of the interface, beams suffer stretching and bending deformation resulting in two modes of breaking. The stretching and bending deformation of beams can be expressed in terms of a single variable, i.e. longitudinal strain , which enables us to map the interface model to the simpler fiber bundle models. The two breaking modes can be considered to be independent or combined in the form of a von Mises type breaking criterion. The strength of beams is characterized by the two threshold values of stretching and bending a beam can withstand. The breaking thresholds are assumed to be randomly distributed variables of the joint probability distribution . The randomness of the breaking thresholds is supposed to represent the disorder of the interface material. After breaking of a beam the excess load has to be redistributed over the remaining intact elements. In Ref. Raischel et al. (2005) we presented a detailed study which demonstrated that the beam model of sheared interfaces with two breaking modes can be mapped into a simple fiber bundle model of a single breaking mode by an appropriate transformation of the fibers’ strength disorder.
In the present paper, we extend our model by taking into account that failed surface elements can still carry some external load increasing the load bearing capacity of the damaged interface. For simplicity, our study is restricted to discretize the interface in terms of fibers which could then be further generalized to beams Raischel et al. (2005). A bundle of parallel fibers is considered with breaking thresholds in the interval with a probability density and distribution function . We assume that after the breaking of a fiber at the failure threshold , it may retain a fraction of its ultimate load , i.e. it will continue to transfer a constant load between the surfaces. This assumption can be interpreted so that at the damaged areas of the interfaces the two solids still remain in contact exerting for instance a friction force which may contribute to the overall load bearing capacity. In many applications the glue between the two interfaces has disordered properties but its failure characteristics is not perfectly brittle, the glue under shear may also yield. The constitutive behavior of single fibers is illustrated in Fig. 1. Note that the load carried by the broken fibers is independent of the external load, furthermore, it is a random variable due to the randomness of the breaking thresholds.

Varying the value of , the model interpolates between the perfectly brittle failure () and perfectly plastic () behavior of fibers. The load stored by the failed fibers reduces the load increment redistributed over the intact fibers, which strongly affects the process of gradual failure occurring under quasi-static loading of the interface. In the following we present a detailed study of the model system varying the strength of plasticity . For the range of load sharing the two limiting cases of global and local load redistributions will be considered after failure events.
III Transition to perfect plasticity
Assuming global load sharing (GLS) after fiber breaking, the constitutive equation of the interface can be cast into a closed form. At an externally imposed deformation the interface is a mixture of intact and broken fibers, which both contribute to the load bearing capacity of the interface. Since the broken fibers retain a fraction of their failure load, at the instant of fiber breaking only the reduced load is redistributed over the intact fibers. Since the fraction of fibers having breaking threshold in the interval can be obtained as , the constitutive equation reads as
| (1) |
where the integration is performed over the entire load history. The first term labeled provides the load carried by the intact fibers, which corresponds to the classical dry fiber bundle (DFBM) behavior Daniels (1945); Kloster et al. (1997); Sornette (1989).

The constitutive law of DFBMs is recovered in the limiting case , when the complete load of the failed fiber is transferred to the remaining intact fibers of the bundle. In the second term , which accounts for the load carried by the broken fibers, the integral is calculated over the entire load history of the interface up to the macroscopic deformation . It can be seen in Eq. (1) that the value of controls the relative importance of the elastic and plastic terms influencing the macroscopic response and also the microscopic damage process of the system. When is increased, less load is transfered to the intact fiber and in the limiting case failed fibers retain their entire load so no load transfer occurs. In this report, we explore the influence of the parameter when it is tuned between these two extremal cases. In the following calculations the value of the fibers’ Young modulus was set to unity .
We note that the plastic fiber bundle model resembles up to some extent to the continuous damage fiber bundle model (CDFBM) worked out in Refs. Kun et al. (2000); Hidalgo et al. (2001). The main assumption of the CDFBM is that due to the activation of certain internal degrees of freedom, the fibers undergo a gradual softening process reducing their Young modulus in consecutive partial failure events. The fibers always remain linearly elastic but with a Young modulus , where the multiplication factor describes the stiffness reduction in a single failure event and denotes the number of failures occurred. If the fibers can fail only once () and keep their stiffness value constant, the constitutive law of the system reads as
| (2) |
It was demonstrated in Refs. Kun et al. (2000); Hidalgo et al. (2001) that increasing the number of times the fibers can fail, the CDFBM develops a plastic plateau, however, with a mechanism completely different from the one considered here.
It is instructive to consider two fundamentally different cases of disorder distributions , namely bounded and unbounded ones, where the largest breaking threshold takes a finite value or goes to infinity, respectively. In this report, we focus on two specific realizations, i.e. a uniform distribution between 0 and
| (3) |
and distributions of the Weibull type
| (4) |
are considered where and denote the characteristics strength and Weibull modulus of the distribution, respectively. For our study the Weibull distribution has the advantage that the amount of disorder in the failure thresholds can easily be controlled by the value of .
The functional form of the constitutive behavior is shown in Fig. 2 for both disorder distributions Eqs. (3,4). It is interesting to note that for there always exists a maximum of , just as in the case of DFBM. Under stress controlled loading conditions, macroscopic failure occurs at the maximum of so that the position and value of the maximum define the critical stress and strain of the bundle, respectively. It can be observed in Fig. 2 that the value of and are both higher than the corresponding values of DFBM indicating that the presence of plastic fibers increases the macroscopic strength of the bundle. The decreasing part and the plateau of can be realized under strain controlled loading conditions gradually increasing . Under strain control the local load on the fibers is determined by the externally imposed deformation so that there is no load redistribution after fiber failure. The fibers break one-by-one in the increasing order of their failure thresholds . When the deformation approaches the maximum value of the breaking thresholds , all fibers must fail gradually so that the load of intact fibers tends to zero, while that of the broken fibers takes a finite asymptotic value
| (5) |
where the integral is equal to the average fiber strength .

When the strength of plasticity is increased, the critical strain and stress , furthermore, the asymptotic stress of the plateau increase. The value of the critical deformation can be obtained by differentiating Eq. (1) with respect to and calculating the root Sornette (1989)
| (6) |
from which the critical stress follows as . Eq. (6) implies that in the limiting case of the critical strain tends to the maximum of the breaking thresholds , where . For the uniform distribution Eq. (3) we obtain
| (7) |
Here denotes the critical strain of DFBM , which can be obtained by setting in Eq. (6). It follows that for unbounded threshold distributions like the Weibull distribution, diverges so that perfect plasticity is only reached in the limit . The functional form of the divergence is not universal, due to the structure of the third term on the left hand side of Eq. (6), depends on the specific form of . For the Weibull distribution, as a function of reads as
| (8) |
for any Weibull exponent . Parallel to this, the decreasing part and the plateau of the constitutive curve disappear so that and converge to the same finite value, which is the average fiber strength
| (9) |
The average fiber strength can be determined as
| (10) |
for the uniform and Weibull distributions, respectively. Here denotes the Gamma function.
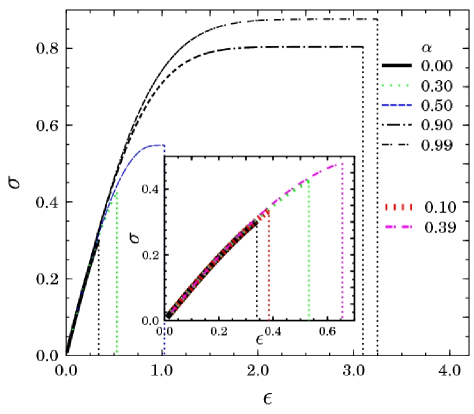
In order to illustrate this behavior, Fig. 3 presents constitutive curves for Weibull distributed fiber strength obtained by computer simulations of stress controlled loading up to the critical point with and . It is apparent that in the limiting case of the constitutive curve reaches a plateau, indicating a perfectly plastic macroscopic state of the system. The position of the maximum of the constitutive curves, i.e. the ending point of the curves, rapidly increases as approaches 1, while the value of the maximum tends to a finite value. In agreement with the analytic predictions Eq. (8), simulations confirmed that diverges as a power law whose exponent depends on the parameters of the strength distribution (see Fig. 4).
Controlling the external stress, the constitutive curve of the system Fig. 3 can only be realized up to the maximum, since at the critical load abrupt failure of the bundle occurs breaking all the surviving intact fibers in a large burst. The fraction of fibers which break in the final burst causing global failure can be determined as , which is illustrated in Fig. 5 as a function of for the specific case of a Weibull distribution
| (11) |
It can be observed that as the system approaches the state of perfect plasticity , tends to zero. This demonstrates that more and more fibers break before global failure occurs, and perfect plasticity is obtained when the strongest fiber fails at the maximum of (compare also to Fig. 3). This argument also implies that for , the difference of the microscopic damage process under stress and strain controlled loading disappears, the fibers break one-by-one without triggering avalanches of breakings.

IV Avalanches of fiber breakings
Under stress controlled loading of the fiber bundle, the load dropped by a breaking fiber is redistributed over the intact ones. This load increment can give rise to further breakings which then may trigger an entire avalanche of failure events. The distribution of avalanche sizes is an important quantity for the dynamical description of the loaded system. For the case of classical DFBMs () under GLS conditions the avalanche size distribution can be obtained analytically Hemmer and Hansen (1992); Kloster et al. (1997) as an integral, from which the asymptotic form of the distribution for large avalanches proved to be a power law
| (12) |

The value of the exponent is universal, it does not depend on the details of the disorder distribution of the failure thresholds Hemmer and Hansen (1992); Kloster et al. (1997).
In order to obtain the analytical solution for the avalanche distribution in the presence of plastic fibers , we can follow the derivation of Refs. Hemmer and Hansen (1992); Kloster et al. (1997), taking into account that the average number of fibers which break as a consequence of the load increment caused by a fiber breaking at the deformation , is reduced by a factor of
| (13) |
Taking into account that the critical deformation where macroscopic failure occurs also depends on , the avalanche size distribution can be cast in the form
For the specific case of the Weibull distribution with an arbitrary modulus the general equation Eq. (IV) can be written in the form
where depends on the amount of disorder and on the strength of plasticity
| (16) |
In Eq. (IV) denotes the incomplete Gamma function 222There are several definitions of the incomplete Gamma function, we use .. Two limiting cases can be distinguished in the solution: first, for the classical power law dependence Eq. (12) is recovered. This analytic solution is illustrated in Fig. 6 for a Weibull distribution with , where a power law of is apparent for .

However, for the limiting case of , we have to consider the behavior of the argument of the analytic solution Eq. (IV). For , there will be a regime of values where the term dominates over resulting in a faster decay of the distribution than any power. Still, for any values of in the limiting case , the usual mean field power law behavior Eq. (12) is asymptotically recovered. Avalanche size distributions obtained from computer simulations at various different values of are presented in Fig. 7. In a good quantitative agreement with the analytic predictions, the numerical results can be well fitted by a power law of exponent 5/2 for moderate values of . However, for strong deviations from the power law Eq. (12) can be observed for intermediate avalanche sizes , which appears to be an exponential decay. Although in the analytical solution the asymptotic power law behavior is still visible for very large , see Fig. 6, computer simulations in Fig. 7 show solely a very steep decrease. It can be seen in the analytic solution in Fig. 6 that the relative frequency of avalanches of size is for , so it would require extremely large systems to count any such events. The size of the largest avalanche is plotted in Fig. 8 as a function of . Obviously, is a monotonically decreasing function of whose decrease gets faster in the regime where the distribution exhibits the crossover to the faster decaying form.

An important consequence of the analytic solution Eqs. (IV,16) is that the characteristic avalanche size where the crossover occurs from a power law to a faster decaying exponential form also depends on the amount of disorder, i.e. the stronger the disorder is, the larger the crossover size gets at a given .
V Local load sharing
From experimental and theoretical point of view, it is very important to study the behavior of the plastic bundle when the interaction of fibers is localized. In the case of local load sharing (LLS) under stress controlled external loading conditions, the load dropped by the broken fiber is redistributed in a local neighborhood of the fiber giving rise to high stress concentration in the vicinity of failed regions. Stress concentration leads to correlated growth of clusters of broken fibers (cracks), which plays a crucial role in the final breakdown of the system, i.e. macroscopic failure of the bundle occurs due to the instability of a broken cluster which then triggers an avalanche of failure events where all the remaining intact fibers break. This effect typically leads to a more brittle constitutive behavior of the system and the appearance of non-trivial spatial and temporal correlations in the damage process Hansen and Hemmer (1994); Batrouni et al. (2002); Hidalgo et al. (2002); Kun et al. (2000).
In the plastic bundle, after a fiber breaks it still retains a fraction of its failure load so that only the amount is redistributed over the intact fibers in the neighborhood. It implies that the load bearing broken fibers reduce the stress concentration around failed regions giving rise to stabilization which also affects the temporal and spatial evolution of damage during the loading process.
In the following we consider a bundle of fibers organized on a square lattice of size with periodic boundary conditions. The fibers are assumed to have Weibull distributed strength Eq. (4), where the value of is always set to unity and for the Weibull modulus two different values are considered: (large disorder) and (smaller disorder). After a failure event the load dropped by the broken fiber is equally redistributed over the nearest and next-nearest intact neighbors in the square lattice, i.e. the local neighborhood of a broken fiber contains at most 8 intact sites. Stress controlled simulations have been carried out for system sizes ranging from to varying the strength of plasticity .
V.1 Macroscopic response
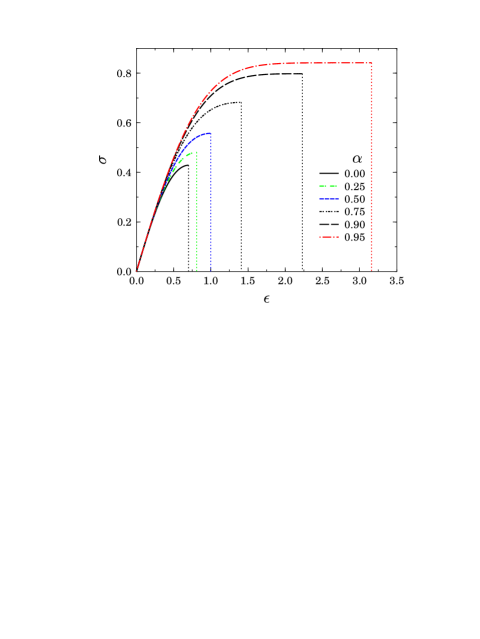
It has been shown for DFBMs where broken fibers carry no load, that the macroscopic response of the bundle when the interaction of fibers is localized follows the constitutive law of the corresponding GLS system with a reduced critical strain and stress, i.e. the bundle behaves macroscopically in a more brittle way than its GLS counterpart Hansen and Hemmer (1994); Kun et al. (2000); Hidalgo et al. (2002). Figure 9 shows the constitutive curve of a plastic bundle of size for several different values of . It can be observed that for the constitutive curve exhibits the usual behavior, i.e. the macroscopic failure is preceded by a relatively short non-linear regime and global failure occurs in an abrupt manner. The position of the macroscopic failure defines the value of the critical strain and stress . It is very interesting to note that when is increased, the LLS constitutive curves practically recover the behaviour of the corresponding GLS system, i.e. for the macroscopic failure occurs when reaching the plateau of .
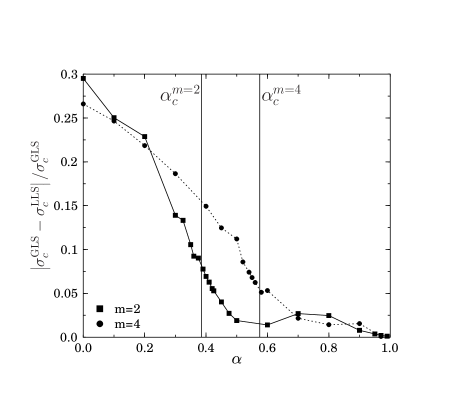
The convergence of the LLS system to the GLS macroscopic behavior is better seen in Fig. 10 where the relative difference of the critical stresses and of the global and local load sharing bundles is presented. It can be seen in the figure that there exists a threshold value of above which the macroscopic response of the LLS bundle becomes very close to the corresponding GLS system, while below the constitutive behavior of the bundle changes continuously from the usual LLS response with a high degree of brittleness () to the global load sharing behavior. It seems that at a continuous transition occurs between the two regimes. The transition indicates that as a consequence of the reduction of stress concentration around failed fibers, the bundle can sustain higher external loads and is able to keep its integrity until the maximum of is reached.

V.2 Bursts of fiber breakings
The evolution of the macroscopic response of the system with increasing is accompanied by interesting changes of the damage process on the micro-level, characterized by the avalanches of fiber breakings and the cluster structure of failed regions. The avalanche statistics presented in Fig. 11 shows remarkable features. For , due to the high stress concentration around failed fibers, the LLS bundle can only tolerate small avalanches so that the avalanche size distribution decays rapidly. With increasing the higher amount of load kept by broken fibers can stabilize the bundle even after larger bursts, hence, the cut-off of the distributions moves to higher values. It is interesting to note that also the functional form of the distribution changes, i.e. when approaches the exponential cut-off disappears and the distribution becomes a power law
| (17) |
for large avalanches. The exponent of the power law was determined numerically as , which is significantly lower than the mean field value Kloster et al. (1997). Increasing above the critical point an exponential cut-off occurs and the power law regime of large avalanches gradually disappears. Comparing Fig. 11 to the corresponding GLS results presented in Fig. 7, it is apparent that above the LLS distributions have the same functional form and follow the same tendency with increasing as the mean field results. It can be concluded that the avalanche statistics presents the same transitional behavior between the local load sharing and mean field regimes as observed for the macroscopic response. The same value of was obtained numerically for , indicating the universality of the exponent with respect to the strength of disorder. The transition is more evident in the inset of Fig. 11, where the size of the largest avalanche is plotted as a function of . The sharp peak indicates the transition point whose position defines , while in GLS the largest avalanche was a monotonically decreasing smooth function (compare to Fig. 8).
V.3 Spatial structure of damage
Gradually increasing the external load in the fiber bundle, the weakest fibers break first in an uncorrelated manner. Since the load is redistributed solely over the intact neighbors of the broken fiber, the chance of fiber breakings increases in the vicinity of damage regions. This effect can result in correlated growth of clusters of broken fibers with a high stress concentration around their boundaries. The larger the cluster is, the higher stress concentration arises. Global failure of the bundle occurs when, due to an external load increment, one of the clusters becomes unstable and grows until all fibers break. The spatial structure of the damage emerging when the interaction of fibers is localized can be characterized by studying the statistics and structure of clusters of broken fibers. Former studies of the limiting case of very localized interactions have revealed that the size of the largest cluster in the system is rather limited, furthermore, it is independent of the system size. Since the clusters are relatively small, merging of neighboring clusters does not occur frequently. The clusters themselves are found to be compact objects dispersed homogeneously over the cross section of the bundle Zapperi et al. (1999a, b); Kun et al. (2000).

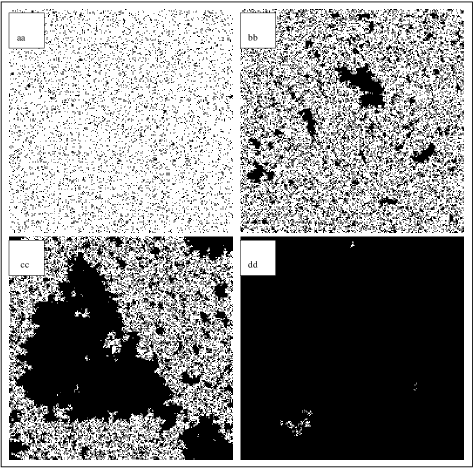
In Fig. 12 the latest stable configuration of the bundle is presented just before catastrophic failure occurs at the critical load for several different values of . For we note only small clusters of broken fibers as it is expected for LLS bundles (Fig. 12a). With increasing , these clusters grow and adjacent clusters can even merge further increasing the typical cluster size (Fig. 12b). Around the critical value of , a spanning cluster of broken fibers seems to appear (Fig. 12c), whereas for higher values of almost all fibers have failed (Fig. 12d) already by the time the critical stress is reached. The existence of very large clusters is the direct consequence of the increased load bearing capacity of broken fibers.
Clusters of broken fibers were identified in the square lattice using the Hoshen-Kopelman algorithm. We evaluated the distribution of cluster sizes in the last stable configuration just before macroscopic failure occurs. The behavior of shows again the transitional nature we have observed for other quantities. It can be seen again in Fig. 13 that a well defined exists which separates two regimes: for the clusters are small and has a steep decrease. Approaching , the cluster size distribution tends to a power law
| (18) |
where the value of the exponent was obtained as which is higher than the corresponding exponent of 2d-percolation on a square lattice Stauffer and Aharony (1992). Note that in the regime where spanning clusters exist (), the distribution contains only the finite clusters.

In order to characterize the evolution of the cluster structure when is changed and to reveal the nature of the transition occurring at , we calculated the average cluster size as the ratio of the second and first moments of the cluster size distribution
| (19) |
The -th moment of the distribution is defined as
| (20) |
where the largest cluster is excluded from the summation. Figure 14 presents as a function of for different system sizes ranging from to . It can be seen in the figure that for each value of the average cluster size has a maximum at a well defined value of , which becomes a sharp peak with increasing , i.e. the peak becomes higher and narrower for larger systems. The observed behavior is typical for continuous phase transitions, where the position of the maximum defines the critical point of the finite size system. Based on the analogy to critical phenomena we tested the validity of the scaling law , where denotes the scaling function of Newman and Barkema (1999); Stauffer and Aharony (1992). The results presented in Fig. 15 were obtained by varying the values of the critical point and of the critical exponent of the susceptibility , and correlation length until the best data collapse was reached.

It can be observed in Fig. 15 that in the vicinity of the critical point a good quality data collapse is obtained using the values , , and , where the critical exponents are only slightly different from the percolation exponents of and in 2d Stauffer and Aharony (1992).
At the critical point a spanning cluster of broken fibers occurs which is much larger than the other clusters. In order to characterize the strength of the spanning cluster we calculated the probability that a failed fiber belongs to the largest cluster. For percolation the quantity plays the role of the order parameter whose value distinguishes the phases of the system. Similarly to percolation lattices, we find numerically a sharp rise from to at , see Fig. 16. When the system size is increased tends to a step function indicating that the transition becomes sharper. Assuming the scaling law of the order parameter for finite size systems, where denotes the scaling function and is the order parameter exponent Newman and Barkema (1999); Stauffer and Aharony (1992), we replotted the data in Fig. 17. The good quality of the data collapse was obtained with the parameter values , , and . Note that the value of agrees well with the one determined by the finite size scaling of the average cluster size , larger deviations occur only for the critical point . The order parameter exponent is compatible with the percolation value
V.4 Random crack nucleation versus crack growth
The failure mechanism of disordered materials and its relation to the amount of disorder has long been discussed in the literature Herrmann and Roux (1990); Chakrabarti and Benguigui (1997); Kun et al. (2000); Nukala et al. (2004); Zapperi et al. (1999b); Zapperi et al. (1997); Hansen et al. (1989); Batrouni and Hansen (1998). When the material has a low degree of disorder only a small amount (if any) of damage occurs prior to macroscopic failure. In this case even the nucleation of a single microcrack can lead to localization and abrupt failure of the system. Increasing the amount of disorder, the macroscopic failure is preceded by a larger and larger precursory activity, i.e. a large amount of damage accumulates and local breakings can trigger bursts of breaking events Kloster et al. (1997).

Since cracks nucleate randomly, the process of damage before localization resembles percolation up to some extent. Stress concentration builds up around failed regions which might lead to correlated growth of the nucleated cracks Ray and Date (1996); Kun et al. (2000); Nukala et al. (2004); Andersen et al. (1997). Increasing the strength of disorder, correlation effects become less dominating and in the limit of infinite disorder the damage accumulation process can be mapped to percolation Roux et al. (1988).
We have shown above that in the plastic fiber bundle model (PFBM), the load bearing capacity of broken fibers has a substantial effect on the process of failure when the load redistribution is localized due to the reduction of the stress concentration along cracks. In order to give a quantitative characterization of damage accumulation in our model, we determined the fraction of broken fibers at global failure as a function of the strength of plasticity .

The quantity can also be interpreted as the probability that a randomly chosen fiber in the bundle is broken which makes it possible to compare the spatial structure of damage to percolation lattices Stauffer and Aharony (1992) generated with the occupation probability Herrmann and Roux (1990); Chakrabarti and Benguigui (1997); Hidalgo et al. (2002); Roux et al. (1988). The results are presented in Fig. 18 for the system size and Weibull parameters and plotting also the corresponding GLS results for comparison. In the case of local load sharing, when the failure load of fibers is almost entirely redistributed locally () only a small damage can accumulate up to global failure keeping the integrity of the system. Comparing the curves of different Weibull indices it follows that the stronger the disorder is, the larger amount of damage the system can tolerate at the same value of . In the vicinity of the respective , the breaking fraction rapidly increases and converges to the maximum value , which implies that in the regime practically no localization occurs, the bundle can remain stable until almost all fibers break.
It is instructive to compare this behavior to the case of GLS, where those fibers break up to the critical point whose breaking threshold falls below , hence, can simply be obtained as . It can be seen in Fig. 18 that under global load sharing for a significantly larger fraction of fibers fails without destroying the system than in the LLS bundle. The breaking fraction is a monotonically increasing function of irrespective of the range of load sharing, however, in the vicinity of the critical point of LLS bundles exceeds the smoothly rising GLS curves . Note that depending on the threshold distribution of fibers, even at the value of can be smaller or larger than the critical percolation probability of the corresponding lattice type, since (contrary to fuse networks Batrouni and Hansen (1998); Nukala et al. (2004) or discrete element models D’ Addetta et al. (2001)) fracture in fiber bundles is not related to the appearance of a spanning cluster of failed elements. Varying as a control parameter, formally the GLS results could be perfectly mapped onto a percolation problem: at the critical value of the control parameter defined as a spanning cluster occurs, which has a fractal structure, the average size of finite clusters has a maximum at the critical point and the cluster size distribution exhibits gap scaling Stauffer and Aharony (1992). However, this percolation is not related to the point of failure of the GLS bundle, the analogy to percolation is based purely on geometrical properties without any physical relevance.
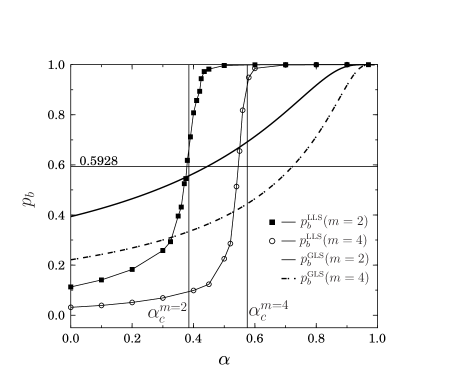
Figure 18 shows that for localized load sharing the phase transition occurs when the damage fraction reaches the critical percolation probability of the corresponding lattice type. Due to the very localized load sharing, only short range correlations arise in the system which are further moderated by the finite load bearing capacity of broken fibers. Hence, in the vicinity of the transition point holds and the evolution of the microstructure of damage shows strong analogy to percolation lattices. It can be seen in Table 1 that the critical exponents of the plastic fiber bundle model are slightly different from the corresponding exponents of percolation, furthermore, the usual scaling relations of percolation critical exponents Stauffer and Aharony (1992) are not fulfilled within the error bars. It has been shown for percolation that correlated occupation probabilities lead to the same critical behavior as random percolation when the correlations are short ranged Weinrib (1984); Anderson and Family (1988), however, long range correlations result in changes of the critical exponents Weinrib (1984). It is interesting to note that the value of the correlation length exponent of PFBM is smaller than the value of random percolation which is consistent with the presence of relevant correlations Weinrib (1984). We would like to emphasize that contrary to global load sharing, this percolation like transition has important physical consequences on the behavior of the fiber bundle. The failure process of the bundle is dominated by the competition of fiber breaking by local stress enhancement due to load redistribution and by local weakness due to disorder. Our detailed analysis revealed that the relative importance of the two effects is controlled by the parameter . Below the critical point high stress concentration can develop around cracks so that the failure of the bundle occurs due to localization. Above the critical point the macroscopic response of the LLS bundle becomes practically identical with the GLS constitutive behavior showing the dominance of disorder. It is important to note that the size distribution of bursts of simultaneously failing fibers becomes a power law at the critical point with an exponent equal to the value recently predicted for GLS bundles of so-called critical failure threshold distributions Pradhan et al. (2005); Pradhan and Hansen (2005). This can be explained such that the large avalanches of power law distribution occurring in the plastic fiber bundle model at (see Fig. 11) are dominated by the strong fibers of the bundle whose strength distribution is close to critical Pradhan et al. (2005); Pradhan and Hansen (2005).
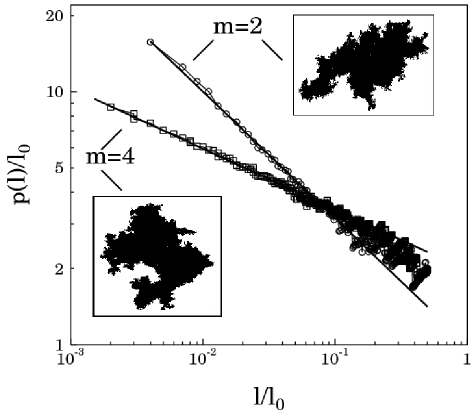
The structure of the spanning cluster of the LLS bundle formed at the critical point has also remarkable features different from the spanning cluster of percolation Stauffer and Aharony (1992). The insets of Fig. 19 present representative examples of the spanning cluster of a system of size at two different disorder strengths. It can be observed that the clusters are compact, they practically do not have holes, there are no islands of unbroken fibers in the interior of the cluster. This structure is a direct consequence of the merging of growing compact clusters where espcially large stress concentrations arise between the cluster surfaces breaking the fibers and filling the holes in the spanning cluster. We note that in the limiting case of very strong disorder a small amount of intact fibers may survive dispersed over the spanning cluster. The result implies that the fractal dimension of the spanning cluster of the LLS bundle is 2, which should be compared to the corresponding value of random percolation where a finite amount of holes exists Stauffer and Aharony (1992) even for short range correlated occupation probabilities Anderson and Family (1988). The perimeter of the spanning cluster, however, has a fine structure, i.e. it has a large number of peninsulas and valleys of all sizes. To reveal the structure of the perimeter, we measured its length as a function of the length of the yardstick . It can be seen in Fig. 19 that shows a power law dependence on over almost two decades
| (21) |
where the value of the exponent proved to be for a Weibull distribution of fiber strength with . The power law Eq. (21) indicates that the perimeter line is a fractal with a dimension . The upper bound of the scaling range in Fig. 19 can be attributed to the characteristic size of peninsulas of the spanning cluster, over which the rough structure of the perimeter disappears. Numerical calculations revealed that the fractal dimension of the cluster surface is not universal, i.e. it depends on the strength of disorder of the breaking thresholds. The insets of Fig. 19 illustrate that a lower amount of disorder gives rise to a more regular, smoother cluster surface characterized by a lower value of . For the Weibull index we obtained , which is significantly smaller than the corresponding value of . The surface of damage clusters should be compared to the hull of the spanning cluster of percolation with the fractal dimension Saleur and Duplantier (1987) (see also Table 1).
| Critical exponents | PFBM | Percolation |
|---|---|---|
| (Bursts) | – |
VI Summary
We introduced a fiber bundle model where failed fibers retain a fraction of their failure load. The value of the parameter interpolates between the perfectly rigid failure and perfect plasticity of fibers. We carried out a detailed study of the effect of the finite load bearing capacity of fibers on the microscopic damage process and macroscopic response of fiber bundles considering both global and local load sharing for the load redistribution after fiber failure. Analytic calculations and computer simulations revealed that under global load sharing the macroscopic constitutive behavior of the interface shows a transition to perfect plasticity when , where the yield stress proved to be the average fiber strength. Approaching the state of perfect plasticity, the size distribution of bursts has a crossover from the mean field power law form of exponent 2.5 to a faster exponential decay.
When the load sharing is localized it is found that the load carried by the broken fibers has a stabilizing effect on the bundle, i.e. it lowers the stress concentration around clusters of failed fibers which has important consequences on the microscopic process of fracture and on the macroscopic response of the bundle. Extensive numerical calculations showed that at a specific value a very interesting transition occurs from a phase where macroscopic failure emerges due to stress enhancement around failed regions leading to localization, to another phase where the disordered fiber strength plays the dominating role in the damage process.
On the macro-level, below the critical point the fiber bundle shows a brittle response, i.e. the macroscopic failure is preceded by a weak non-linearity, while for the constitutive behavior of the LLS bundle becomes practically identical with the GLS counterpart. Analyzing the evolution of the micro-structure of damage with increasing , the transition proved to be continuous analogous to percolation. Computer simulations revealed that the avalanche size distribution of fiber breakings becomes a power law at the critical point with an universal exponent equal to the mean field exponent of bundles with critical strength distributions. The spanning cluster of failed fibers formed at the transition point proved to be compact with a fractal boundary whose dimension increases with the amount of disorder. The critical value is not universal, besides the lattice structure, it also depends on the strength of disorder.
The plastic fiber bundle model can be relevant for the shear failure of interfaces where failed surface elements can remain in contact still transmitting load. Such glued interfaces of solids typically occur in fiber composites, where fibers are embedded in a matrix material. The finite load bearing capacity of failed elements of the model can account for the frictional contact of debonded fiber-matrix interfaces and also for plastic behavior of the components.
Acknowledgements.
This work was supported by the Collaborative Research Center SFB 381. F. Kun acknowledges financial support of the Research Contracts NKFP 3A-043/2004, OTKA M041537, T049209 and of the György Békésy Foundation of the Hungarian Academy of Sciences.References
- Herrmann and Roux (1990) H. J. Herrmann and S. Roux, eds., Statistical models for the fracture of disordered media, Random materials and processes (Elsevier, Amsterdam, 1990).
- Chakrabarti and Benguigui (1997) B. K. Chakrabarti and L. G. Benguigui, Statistical Physics of Fracture and Breakdown in Disordered Systems (Oxford University Press, 1997).
- Daniels (1945) H. E. Daniels, Proc. R. Soc London A 183, 405 (1945).
- Harlow and Phoenix (1978) D. G. Harlow and S. L. Phoenix, J. Composite Materials 12, 314 (1978).
- Curtin (1998) W. A. Curtin, Phys. Rev. Lett. 80, 1445 (1998).
- Kun and Herrmann (2000) F. Kun and H. J. Herrmann, Journal of Materials Science 35, 4685 (2000).
- Pradhan and Chakrabarti (2003) S. Pradhan and B. K. Chakrabarti, Int. J. Mod. Phys. B 17, 5565 (2003).
- Kloster et al. (1997) M. Kloster, A. Hansen, and P. C. Hemmer, Phys. Rev. E 56, 2615 (1997).
- Pradhan et al. (2005) S. Pradhan, A. Hansen, and P. C. Hemmer, Phys. Rev. Lett. 95, 125501 (2005).
- Pradhan and Hansen (2005) S. Pradhan and A. Hansen, Phys. Rev. E 72, 026111 (2005).
- Hidalgo et al. (2001) R. C. Hidalgo, F. Kun, and H. J. Herrmann, Phys. Rev. E 64, 066122 (2001).
- Andersen et al. (1997) J. V. Andersen, D. Sornette, and K. Leung, Phys. Rev. Lett. 78, 2140 (1997).
- Moreno et al. (2000) Y. Moreno, J. B. Gomez, and A. F. Pacheco, Phys. Rev. Lett. 85, 2865 (2000).
- Kun et al. (2003) F. Kun, Y. Moreno, R. C. Hidalgo, and H. J. Herrmann, Europhys. Lett. 63, 347 (2003).
- Bhattacharyya et al. (2003) P. Bhattacharyya, S. Pradhan, and B. K. Chakrabarti, Phys. Rev. E 67, 046122 (2003).
- Pradhan and Chakrabarti (2002) S. Pradhan and B. K. Chakrabarti, Phys. Rev. E 65, 016113 (2002).
- Batrouni et al. (2002) G. G. Batrouni, A. Hansen, and J. Schmittbuhl, Phys. Rev. E 65, 036126 (2002).
- Zapperi et al. (2000) S. Zapperi, H. J. Herrmann, and S. Roux, Eur. Phys. J. B 17, 131 (2000).
- Knudsen and Massih (2005) J. Knudsen and A. R. Massih, Phys. Rev. E 72, 036129 (2005).
- Delaplace et al. (2001) A. Delaplace, S. Roux, and G. Pijaudier-Cabot, J. Eng. Mech. 127, 646 (2001).
- Raischel et al. (2005) F. Raischel, F. Kun, and H. J. Herrmann, Phys. Rev. E 72, 046126 (2005).
- Sornette (1989) D. Sornette, J. Phys. A 22, L243 (1989).
- Kun et al. (2000) F. Kun, S. Zapperi, and H. J. Herrmann, Eur. Phys. J. B 17, 269 (2000).
- Hemmer and Hansen (1992) P. C. Hemmer and A. Hansen, J. Appl. Mech. 59, 909 (1992).
- Hansen and Hemmer (1994) A. Hansen and P. C. Hemmer, Phys. Lett. A 184, 394 (1994).
- Hidalgo et al. (2002) R. C. Hidalgo, Y. Moreno, F. Kun, and H. J. Herrmann, Phys. Rev. E 65, 046148 (2002).
- Zapperi et al. (1999a) S. Zapperi, P. Ray, H. E. Stanley, and A. Vespignani, Physica A 270, 57 (1999a).
- Zapperi et al. (1999b) S. Zapperi, P. Ray, H. E. Stanley, and A. Vespignani, Phys. Rev. E 59, 5049 (1999b).
- Stauffer and Aharony (1992) D. Stauffer and A. Aharony, Introduction to Percolation Theory (Taylor & Francis, 1992).
- Newman and Barkema (1999) M. E. J. Newman and G. T. Barkema, Monte Carlo Methods in Statistical Physics (Clarendon Press, Oxford, 1999).
- Nukala et al. (2004) P. V. V. Nukala, S. Simunovic, and S. Zapperi, J. Stat. Mech: Theor. Exp. p. P08001 (2004).
- Zapperi et al. (1997) S. Zapperi, P. Ray, H. E. Stanley, and A. Vespignani, Phys. Rev. Lett. 78, 1408 (1997).
- Hansen et al. (1989) A. Hansen, S. Roux, and H. J. Herrmann, J. Phys. France 50, 733 (1989).
- Batrouni and Hansen (1998) G. G. Batrouni and A. Hansen, Phys. Rev. Lett. 80, 325 (1998).
- Ray and Date (1996) P. Ray and G. Date, Physica A 229, 26 (1996).
- Roux et al. (1988) S. Roux, A. Hansen, H. Herrmann, and W. Guyon, J. Stat. Phys. 52, 237 (1988).
- D’ Addetta et al. (2001) G. A. D’ Addetta, F. Kun, E. Ramm, and H. J. Herrmann, in Continuous and Discontinuous Modelling of Cohesive-Frictional Materials, edited by P. Vermeer et al. (Springer-Verlag Berlin Heidelberg New York, 2001), Lecture Notes in Physics.
- Weinrib (1984) A. Weinrib, Phys. Rev. B 29, 387 (1984).
- Anderson and Family (1988) S. R. Anderson and F. Family, Phys. Rev. A 38, 4198 (1988).
- Saleur and Duplantier (1987) H. Saleur and B. Duplantier, Phys. Rev. Lett. 58, 2325 (1987).