Dynamics of liquid silica as explained by properties of the potential energy landscape
Abstract
The dynamics of silica displays an Arrhenius temperature dependence, classifying silica as a strong glass-former. Using recently developed concepts to analyse the potential energy landscape one can get a far-reaching understanding of the long-range transport of silica. It can be expressed in terms of properties of the thermodynamics as well as local relaxation processes, thereby extending the phenomenological standard picture of a strong glass-former. The local relaxation processes are characterized by complex correlated sequences of bond breaking and reformation processes.
pacs:
64.70.Pf, 65.40.Gr, 66.20.+dSilica is a prototypical and technologically relevant glass-former, displaying a variety of remarkable physical properties like thermodynamic anomaliesSaika-Voivod et al. (2001); Shell et al. (2002); Saika-Voivod et al. (2004). In contrast to most other glass-formers the temperature dependence of its transport properties like the oxygen self-diffusion constant display a simple Arrhenius behavior with an activation energy 4.7 eV Mikkelsen (1984) and is thus a strong glass-former Angell (1995); G. Ruocco et. al (2004). This suggests that the transport can be described as a successive breaking and reformation processes of Si-O bonds with an activation energy close to Ediger (2000); Debenedetti and Stillinger (2001).
To scrutinise this simple picture and thus to obtain a microscopic picture of the dynamics of silica we employ the framework of the potential energy landscape (PEL), defined in the high-dimensional configuration space Debenedetti and Stillinger (2001). At low temperatures the properties of silica and other glass forming systems are mainly characterized by the properties of the local potential energy minima of the PEL (denoted inherent structures, IS) Stillinger and Weber (1982); Debenedetti and Stillinger (2001). The thermodynamics of the system is mainly governed by the energy distribution of the number of IS. Introducing the configurational entropy as a measure for the number of accessible IS at a given temperature, there is an empirical connection of to the dynamics (Adam-Gibbs relation Adam and Gibbs (1965)) with some fitting parameter Sastry (2001); Saika-Voivod et al. (2001); La Nave et al. (2002). Its theoretical foundation, however, is under debateXia and Wolynes (2001); Berthier and Garrahan (2003) and no direct interpretation of is available, yet. In any event, one would expect that also the topology of the PEL should be of utmost importance for understanding the dynamics Stillinger and Debenedetti (2002).
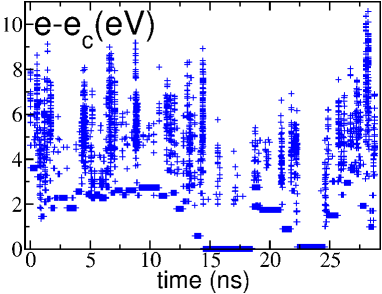
Following the ideas of Stillinger and Weber Stillinger and Weber (1982) one can map a trajectory, obtained via a molecular dynamics simulation, to a sequence of IS via frequent minimization of the potential energy. One example is shown in Fig.1. This highlights how the system is exploring the PEL. One can group together IS to metabasins (MB) such that the dynamics between MB does not contain any correlated backward-forward processes Debenedetti and Stillinger (2001); Doliwa and Heuer (2003a); Denny et al. (2003). Each MB is characterized by a waiting time and an energy (defined as the lowest IS energy in this MB). The technical details of this approach, which have been developed in the context of studying a simple glass-forming model, i.e. the binary mixture Lennard-Jones system (BMLJ), can be found in Doliwa and Heuer (2003a).
In this work we apply these techniques to silica. Combining information about the energy distribution of IS and the local relaxation processes, reflecting the local topology of the PEL, we obtain a far-reaching understanding of its dynamics. From this we can identify the reasons why silica is a strong system and obtain a quantitative understanding of observables like the resulting activation energy . Further information is obtained from an appropriate comparison with the real-space behavior of silica. The underlying picture, emerging from these results, extends substantially the rationalization of the strong behavior of silica, sketched above.
Information about the BKS potential Van Beest et al. (1990), used to model silica, as well as further simulation details can be found in Ref. Saksaengwijit et al. (2004). For an optimum analysis in terms of the PEL the system size should be as small as possible without showing significant finite size effects Doliwa and Heuer (2003a). It has been shown that already for system sizes finite size effects concerning the configurational entropy Saksaengwijit et al. (2004), the properties of tunneling systems Reinisch and Heuer (2005), the temperature dependence of the oxygen diffusion Saksaengwijit et al. (2004) as well as the nature of the relaxation processes in BKS silica (checked, e.g., via the degree of non-exponentiality in the incoherent scattering function) Saksaengwijit et al. (2004); Martin-Samos et al. (2005)are small in the accessible range of temperatures. Here we choose . Properties of larger systems can be then predicted from statistical arguments J.Wales and K.Doye (2003). Recent studies have shown that the distribution of configurational energies has a low-energy cutoff around some energy Saksaengwijit et al. (2004) with a finite configurational entropy Saika-Voivod et al. (2004). It results from the network constraints in defect-free configurations Saksaengwijit et al. (2004). It will turn out to be one key feature for the understanding of the dynamics.
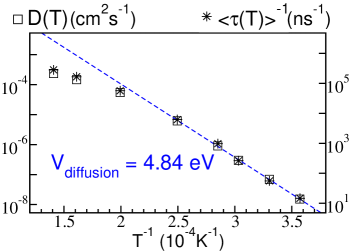
In analogy to previous results for the BMLJ system Doliwa and Heuer (2003b) the oxygen diffusion constant is proportional to the inverse of the average MB waiting time ; see Fig.2. Thus, a local quantity like fully determines the temperature dependence of diffusion, i.e. . The low-temperature activation energy eV is very close to the experimentally observed value of 4.7 eV Mikkelsen (1984). Around 3500 K one observes the crossover from the high-temperature non-Arrhenius to the low-temperature Arrhenius-regime Horbach and Kob (1999); Saika-Voivod et al. (2001); La Nave et al. (2002); Saika-Voivod et al. (2004).
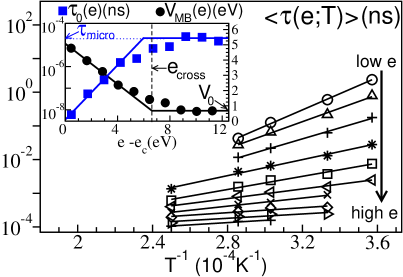
One may suspect that the MB waiting times are strongly energy dependent because high-energy configurations have a larger number of defects Saksaengwijit et al. (2004) which can more easily relax Reinisch and Heuer (2005). For a quantification we determine the average MB waiting time in dependence of temperature and energy, denoted from analysis of several independent equilibrium runs; see Fig.3. Interestingly, for all one finds a simple Arrhenius-behavior, characterized by an effective activation energy and a prefactor . Thus, the Arrhenius-behavior is not only present for simple atomic systems like the BMLJ system Doliwa and Heuer (2003a) but also for silica. One observes a crossover from the high-energy regime with and to a low-energy regime with a strong energy-dependence of both functions. The resulting broad distribution of waiting times implies that energy is likely the most dominating factor for understanding the occurrence of dynamic heterogeneities in silica and other glass-forming systems Vogel and Glotzer (2004).
For relating the thermodynamics and the dynamics we introduce as the Boltzmann probability to be in a MB of energy . It turns out that in the relevant energy and temperature range is virtually identical for MB and IS Saksaengwijit et al. (2004) and thus contains all the information about the configurational entropy. Using the quantities, introduced so far, we can write down the formal relation Doliwa and Heuer (2003a)
| (1) | |||||
Its physical relevance is far-reaching because it relates the thermodynamics (via ) and the local dynamics (via ) to the long range diffusion. It follows that for very low temperatures for which has only contributions for the dominant contributions to the average waiting time originate from configurations with energies close to via . Then the local Arrhenius behavior translates into a macroscopic Arrhenius behavior. Indeed, the macroscopic activation energy is close to ; see Fig.4.
What determines the value of the crossover temperature of 3500 K? At this temperature is peaked around eV and the low-energy wing of just starts to be influenced by the low-energy cutoff Saksaengwijit et al. (2004). Thus, on first view the above arguments to rationalize Arrhenius behavior should only apply for lower temperatures. However, due to the additional weighting of by in Eq.1, which for is more than four orders of magnitude larger than ( fs), the influence of the low-energy states in the integral is significantly enhanced, thus giving rise to the actually observed crossover. Is there a direct relation to the mode-coupling temperature Horbach and Kob (1999)? Qualitatively, is related to the beginning dominance of activated processes rather than to the presence of a low-energy cutoff of the PEL and thus seems to have a different physical origin.
In the next step we elucidate the microscopic origin of the escape properties from configurations close to . We present detailed results for one specific configuration (denoted IS0). In a first step we determine its average waiting time via repeated runs starting at IS0 with different initial velocities and different temperatures. These runs typically involve many unsuccessful escape attempts. We define the waiting time as the time when IS0 is left for the last time. We find a simple Arrhenius behavior with an effective activation energy of eV (Fig.4a).
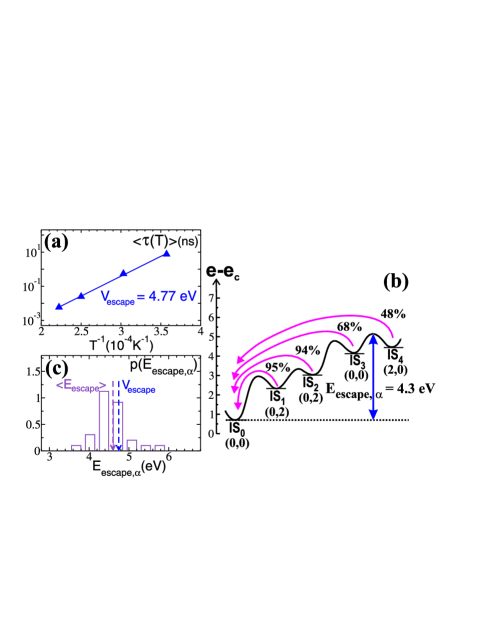
This activation energy incorporates all the complexity of the local PEL around this configuration. In particular, the configuration may relax along different paths , which all contribute to the total relaxation rate, i.e. . If is the probability to escape via path and if path is characterized by an effective barrier height (see below for its definition) one can write Doliwa and Heuer (2003a), which is the average value of for independent runs starting from IS0. A typical escape path is shown in Fig.4b. One can see the sequence of IS after IS0 is visited for the last time. For every ISi a value, denoted , has been obtained from counting for a set of independent simulations with starting structure ISi, whether or not the system returns to IS0. Qualitatively, indicates that the system will (on average) escape from the catchment region of IS0. This limit typically involves the entropic effect that due to the large number of transition options in the high-dimensional PEL there is no need to follow the path back to IS0. As shown in Ref.Doliwa and Heuer (2003a) for a given escape path a good estimate of is first to locate the first IS with and then to identify as the highest energy along the reaction coordinate up to this IS. Application to the escape path in Fig.4b yields eV. Four transitions are required until for the first time .
From the distribution of for 30 different escape paths from IS0 one obtains eV which is close to the value of eV ; see Fig.4c. Thus, it is indeed possible to quantitatively relate the effective activation energy to the local properties of the PEL. Repeating this analysis for two different low-energy IS we get a similar agreement. More generally this implies that , on the one hand, can be quantitatively related to specific local barriers and, on the other hand, to the activation energy of macroscopic diffusion . This establishes a direct link between the microscopic and macroscopic behavior of silica.
Having identified a complete escape process (relevant for ) via the -criterion we are in a position also to analyze its real-space characteristics. First we note that in the vast majority of cases the sequence of IS-transitions during the escape is correlated. This is reflected by the fact that at least one atom, involved in a bond-breaking or reformation process during a specific IS-transition () ISISi+1 was involved during a previous IS-transition. When comparing IS4 with IS0 in total 4 Si-O bonds have been broken and 5 silicon atoms have changed their oxygen neighbors. These values are close to the average behavior after analyzing the escape from all three three initial IS (4.6 and 4.4, resp.). This implies significant correlated bond-breaking and reformation processes. In particular, cannot be related to the breaking of a single Si-O bond. Other researchers have rationalized the value of by the sum of half of the mean formation energy of an oxygen Frenkel pair and a migration barrier Martin-Samos et al. (2005). On a qualitative level something similar is observed here because in the first step a defect is created and afterwards the defect is transferred until . A closer look, however, reveals that the behavior in BKS silica is more complex as reflected, e.g., by the fact that in the example of Fig.4 in between also configurations with no defects occur (IS3).
The additional contribution of the saddle between IS3 and IS4 of approx. 0.8 eV to the final value of is small. This also holds in general (approx. 1.0 eV) which, interestingly, is close to . Thus one may conclude that there are two distinct contributions to the activation energy : (1) as the contribution reflecting the topology of the PEL, related to differences between IS energies, and (2) as the additional contribution of the final saddle. Around the first contribution is dominating.
Why is silica a strong glass-former? The standard scenario, sketched in the introductory paragraph, would imply Ediger (2000); Debenedetti and Stillinger (2001). This reflects the presence of one typical relaxation process which holds throughout the entire PEL Debenedetti and Stillinger (2001). In contrast, our simulations have revealed a strong energy dependence of and together with complex successive bond-breaking and reformation processes. Rather we can identify two underlying reasons for the classification of silica as a strong glass-former: (1) the presence of the cutoff in the PEL of silica as a consequence of its network structure, (2) the Arrhenius temperature dependence of together with a large attempt rate . How to rationalize property (2)? As can be seen from Fig.4c the distribution of effective barrier heights is very narrow. For the example of IS0 this implies an Arrhenius temperature dependence in agreement with the observation; see Fig.4a. This behavior was also observed for the escape from the other low-energy IS, analyzed along the same lines. Thus, it seems to be a general feature that starting from a low-energy (and typically defect-free) configuration around the system first has to acquire an energy of approx. until the escape is complete (ending in an IS with ). More pictorially one may state that low-energy IS () form the bottom of crater-like objects in the PEL and the system has no escape option apart from climbing up the whole crater until . Thus, beyond the presence of the low-energy bound of the PEL the strong behavior of silica is also related to this crater-like structure of the PEL.
The previous thermodynamic analysis has revealed that for this system the number of IS with eV is approx. times larger than the corresponding number at Saksaengwijit et al. (2004). This observation suggests that the number of possible transitions from to configurations with energies around eV is also exponentially large, thereby rationalizing the dramatic increase of as compared to . It has been already explicitly shown in previous model calculations that the prefactor for relaxation processes in model landscapes scales with the number of accessible states for which for the first time is smaller than approx. 50% Saksaengwijit et al. (2003). Then can be much larger than microscopic jump rates. Interestingly, in the relevant energy regime of the BMLJ system the number of IS increases much weaker with increasing energy and correspondingly there is hardly any energy-dependence of Doliwa and Heuer (2003a). This further supports our hypothesis about the origin of the large energy-dependence of .
It has been speculated that different network-forming systems (e.g. silica and water) have similar propertiesIto et al. (1999); Scala et al. (2000); H. E. Stanley et. al (2003). Indeed, indications have been found recently that also the amorphous states of water possesses a low-energy cutoff, which will influence the thermodynamics and dynamics at low temperatures similarly to silicaPoole et al. (2005). Therefore exploration of the properties of silica may be of major importance also for an improved understanding of water and other network formers. The possible universality of this class of systems has recently lead to the formulation of an abstract model which is aimed to reflect the basic physics of all amorphous network formers A. J. Moreno et. al (2005).
In summary, using the PEL-framework we have identified relevant underlying mechanisms for the dynamics of silica: (1) The elementary relaxation processes are not simple bond-breaking processes with the final activation energy but rather form correlated sequences of many bond-breaking processes with a strong dependence on the initial energy. (2) The simultaneous presence of the low-energy cutoff of the PEL as well as the narrow distribution of escape barriers from MB give rise to the resulting strong behavior. (3) Dramatic entropic effects are present for the escape from low-energy states, showing that the dynamics is much more complex than reflected by the resulting simple Arrhenius behavior. (4) The occurrence of the crossover temperature around 3500 K can be quantitatively understood by the presence of the low-energy cutoff and these entropic effects. (5) There exists a crossover energy which separates the high-energy liquid-like behavior and the low-energy activated behavior.
We gratefully acknowledge helpful discussions with R. D. Banhatti, B. Doliwa, D.R. Reichman, O. Rubner and M. Vogel. The work was supported in part by the DFG via SFB 458 and by the NRW Graduate School of Chemistry.
References
- Saika-Voivod et al. (2001) I. Saika-Voivod, P. H. Poole, and F. Sciortino, Nature 412, 514 (2001).
- Shell et al. (2002) M. S. Shell, P. G. Debenedetti, and A. Z. Panagiotopoulos, Phys. Rev. E. 66, 011202 (2002).
- Saika-Voivod et al. (2004) I. Saika-Voivod, F. Sciortino, and P. H. Poole, Phys. Rev. E. 69, 041503 (2004).
- Mikkelsen (1984) J. C. Mikkelsen, Appl. Phys. Lett. 45, 1187 (1984).
- Angell (1995) C. A. Angell, Science 267, 1924 (1995).
- G. Ruocco et. al (2004) G. Ruocco et. al, J. Chem. Phys. 120, 10666 (2004).
- Ediger (2000) M. D. Ediger, Ann. Rev. of Phys. Chem. 51, 99 (2000).
- Debenedetti and Stillinger (2001) P. G. Debenedetti and F. H. Stillinger, Nature 410, 259 (2001).
- Stillinger and Weber (1982) F. H. Stillinger and T. A. Weber, Phys. Rev. A 25, 978 (1982).
- Adam and Gibbs (1965) G. Adam and J. H. Gibbs, J. Chem. Phys. 43, 139 (1965).
- Sastry (2001) S. Sastry, Nature 409, 164 (2001).
- La Nave et al. (2002) E. La Nave, H. E. Stanley, and F. Sciortino, Phys. Rev. Lett 88, 035501 (2002).
- Xia and Wolynes (2001) X. Xia and P. G. Wolynes, Phys. Rev. Lett 86, 5526 (2001).
- Berthier and Garrahan (2003) L. Berthier and J. P. Garrahan, Phys. Rev. E. 68, 041201 (2003).
- Stillinger and Debenedetti (2002) F. H. Stillinger and P. G. Debenedetti, J. Chem. Phys. 116, 3353 (2002).
- Doliwa and Heuer (2003a) B. Doliwa and A. Heuer, Phys. Rev. E. 67, 031506 (2003a).
- Denny et al. (2003) R. A. Denny, D. R. Reichman, and J. P. Bouchaud, Phys. Rev. Lett. 90, 025503 (2003).
- Van Beest et al. (1990) B. W. H. Van Beest, G. J. Kramer, and R. A. Van Santen, Phys. Rev. Lett. 64, 1955 (1990).
- Saksaengwijit et al. (2004) A. Saksaengwijit, J. Reinisch, and A. Heuer, Phys. Rev. Lett. 93, 235701 (2004).
- Reinisch and Heuer (2005) J. Reinisch and A. Heuer, Phys. Rev. Lett 95, 155502 (2005).
- Martin-Samos et al. (2005) L. Martin-Samos, Y. Limoge, J. P. Crocombette, G. Roma, and N. Richard, Phys. Rev. B 71, 014116 (2005).
- J.Wales and K.Doye (2003) D. J.Wales and J. P. K.Doye, J. Chem. Phys. 119, 12409 (2003).
- Doliwa and Heuer (2003b) B. Doliwa and A. Heuer, Phys. Rev. E. 67, 030501 (2003b).
- Horbach and Kob (1999) J. Horbach and W. Kob, Phys. Rev. B. 60, 3169 (1999).
- Vogel and Glotzer (2004) M. Vogel and S. C. Glotzer, Phys. Rev. Lett. 92, 255901 (2004).
- Saksaengwijit et al. (2003) A. Saksaengwijit, B. Doliwa, and A. Heuer, J. Phys.: Condens. Matter 15, S1237 (2003).
- Ito et al. (1999) K. Ito, C. T. Moynihan, and C. A. Angell, Nature 398, 492 (1999).
- Scala et al. (2000) A. Scala, F. W. Starr, E. L. Nave, F. Sciortino, and H. E. Stanley, Nature 406, 166 (2000).
- H. E. Stanley et. al (2003) H. E. Stanley et. al, J. Stat. Phys. 110, 1039 (2003).
- Poole et al. (2005) P. H. Poole, I. Saika-Voivod, and F. Sciortino, J. Phys. Cond. Matter 17, L431 (2005).
- A. J. Moreno et. al (2005) A. J. Moreno et. al, Phys. Rev. Lett. 95, 157802 (2005).