Muon-spin rotation measurements of the penetration depth in Li2Pd3B
Abstract
Measurements of the magnetic field penetration depth in the ternary boride superconductor Li2Pd3B ( K) have been carried out by means of muon-spin rotation (SR). The absolute values of , the Ginzburg-Landau parameter , and the first and the second critical fields at obtained from SR were found to be nm, , mT, and T, respectively. The zero-temperature value of the superconducting gap 1.31(3) meV was found, corresponding to the ratio . At low temperatures saturates and becomes constant below , in agreement with what is expected for s-wave BCS superconductors. Our results suggest that Li2Pd3B is a s-wave BCS superconductor with the only one isotropic energy gap.
pacs:
74.70.Ad, 74.25.Op, 74.25.Ha, 76.75.+i, 83.80.FgI Introduction
The discovery of superconductivity in the ternary boride superconductors Li2Pd3B and Li2Pt3B has attracted considerable interest in the study of these materials.Togano04 ; Badica04 ; Yokoya05 ; Nishiyama05 ; Yuan05 ; Takeya05 It is believed now that superconductivity in both above mentioned compounds is most likely mediated by phonons. It stems from photoemission,Yokoya05 nuclear magnetic resonance (NMR), Nishiyama05 and specific heat experiments. Takeya05 Moreover, the observation of a Hebel-Slichter peak in the 11B spin-lattice relaxation rate in Li2Pd3B strongly supports singlet pairing.Nishiyama05 However, experimental results concerning the structure of the superconducting energy gap are still controversal. On the one hand, NMR data of Li2Pd3B (Ref. Nishiyama05, ) and specific heat data of Li2Pd3B and Li2Pt3B (Ref. Takeya05, ) can be well explained assuming conventional superconductivity. On the other hand, recent measurements of the magnetic field penetration depth suggest unconventional behavior of both compounds, namely double-gap superconductivity in Li3Pd2B and nodes in the energy gap in Li3Pt2B.Yuan05 ; Yuan05a This contradiction is serious and shows that further experimental investigations of these compounds are needed.
In this paper, we report a systematic study of magnetic field penetration depth in Li2Pd3B by means of transverse-field muon-spin rotation (TF-SR) (the detailed description of TF-SR technique in connection with studies can be found, e.g., in Ref. Zimmermann95, ). Measurements were performed down to 30 mK in a series of fields ranging from 0.02 T to 2.3 T. For all magnetic fields studied (0.02 T, 0.1 T, 0.5 T, 1 T, and 2.3 T) no sign of a second superconducting gap was detected. All our results may be well explained by assuming conventional superconductivity with the only one isotropic energy gap. The absolute values of , the Ginzburg-Landau parameter , and the first () and the second () critical fields at obtained from SR were found to be nm, , mT, and T, respectively. The zero temperature value of the superconducting gap was found to be 1.31(3) meV that corresponds to the ratio .
The paper is organized as follows: In Sec. II we describe the sample preparation procedure and the TF-SR technique in connection with measurements. In Sec. III.1 we discuss the temperature dependence of the second critical field . In Sec. III.2 we present the calculation of the absolute value of and the magnetic field dependence of the second moment of the SR line. Sec. III.3 comprises studies of the temperature dependence of . The conclusions follow in Sec. IV.
II Experimental details
The Li2Pd3B polycrystalline sample was prepared by two-step arc-melting.Togano04 First, a binary Pd3B alloy was prepared by conventional arc-melting from the mixture of Pd(99.9%) and B(99.5%). The alloying of Li was done in the second arc-melting, in which a small piece of Pd3B alloy was placed on a Li(%) plate. Once the Pd3B alloy melted, the reaction with Li occurred and developed very fast, forming a small button specimen (around 300 mg). Since the loss of Li was inevitable, the Li concentration in the final sample was estimated from the weight change. The deviation of the Li concentration from the stoichiometric one was less than 1% for the specimens used in this experiment.
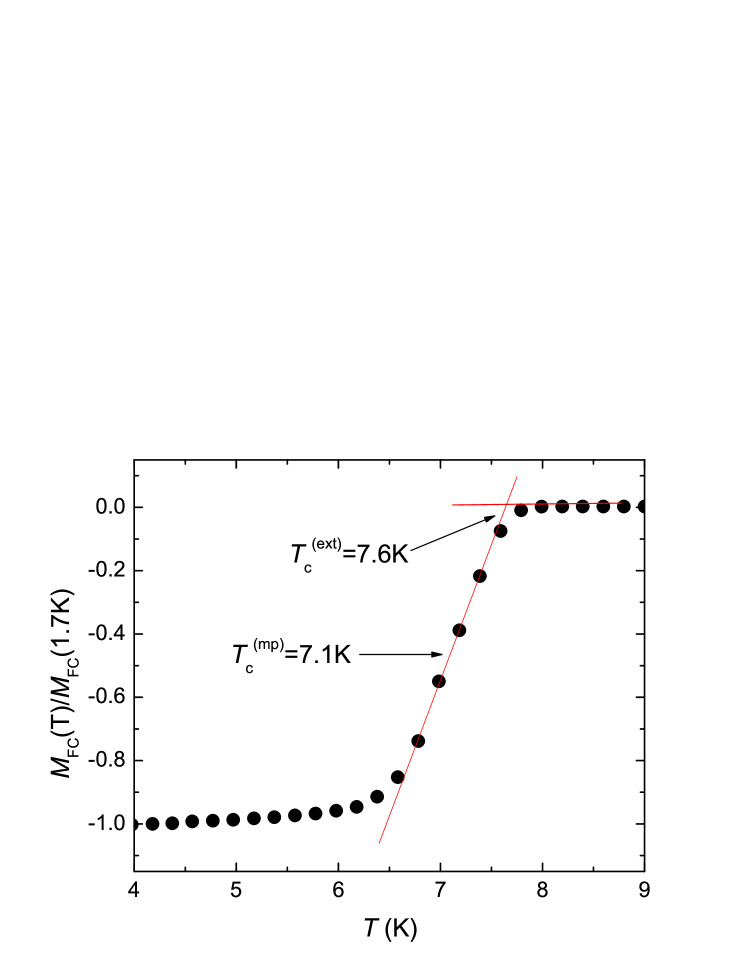
Field–cooled magnetization () measurements were performed with a SQUID magnetometer in fields ranging from 0.5 mT to 4 T and temperatures between 1.75 K and 10 K. The curve for mT is shown in Fig. 1. The superconducting transition is rather broad indicating that the sample is not particularly uniform, i.e., the superconducting transition temperature may be evaluated only approximately. The middle-point of the transition corresponds to K, while the linear extrapolation of the steepest part of the curve to results in K (see Fig. 1).
TF-SR experiments were performed at the M3 beam line at Paul Scherrer Institute (Villigen, Switzerland). The Li2Pd3B sample was field cooled from above down to 30 mK in fields of 2.3 T, 1 T and 0.5 T, and down to 1.6 K in fields of 0.1 T and 0.02 T.
In the transverse-field geometry the local magnetic field distribution inside the superconducting sample in the mixed state, probed by means of the TF-SR technique, is determined by the values of the coherence length and the magnetic field penetration depth . In extreme type-II superconductors () the distribution is almost independent on and the second moment of line becomes simply proportional to .Brandt88 ; Brandt03
The SR signal was recorded in the usual time-differential way by counting positrons from decaying muons as a function of time. The time dependence of the positron rate is given by the expression msr
| (1) |
where is the normalization constant, denotes the time-independent background, s is the muon lifetime, is the maximum decay asymmetry for the particular detector telescope ( in our case), and is the polarization of the muon ensemble:
| (2) |
Here MHz/T is the muon gyromagnetic ratio and is the angle between the initial muon polarization and the effective symmetry axis of a positron detector. can be linked to the internal field distribution by using the algorithm of Fourier transform.msr
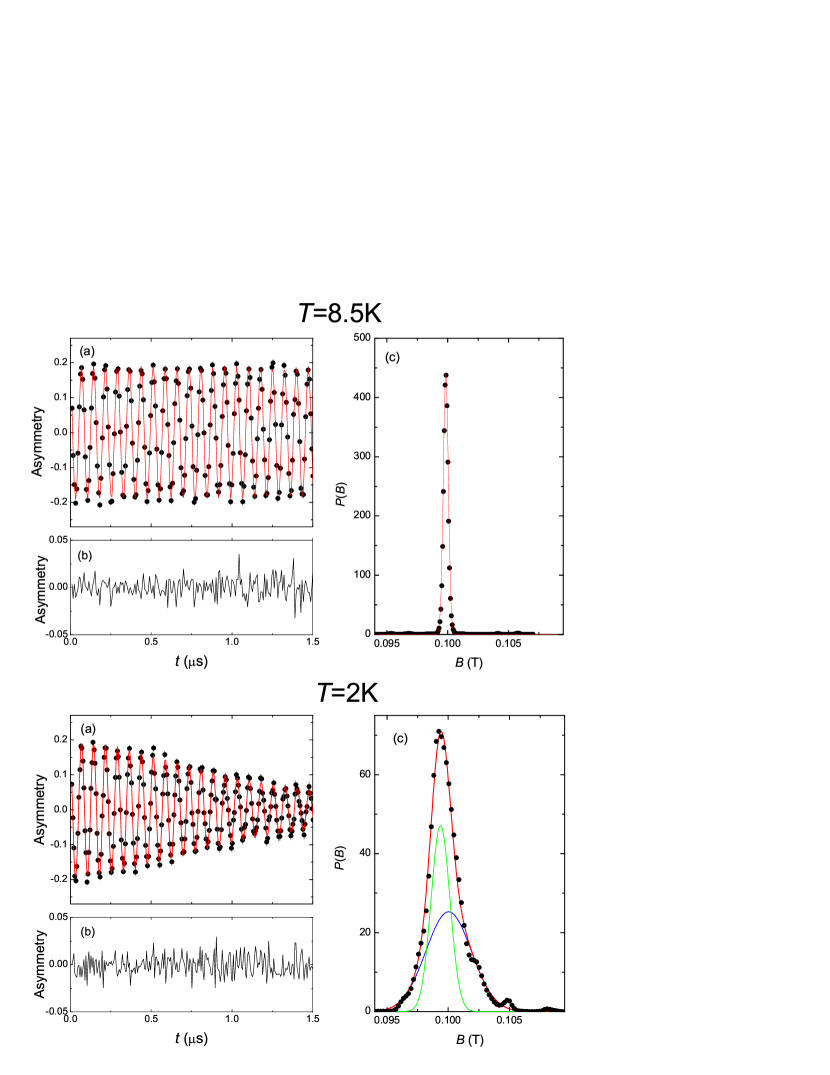
The and distributions inside the Li2Pd3B sample in the normal () and in the mixed state () after field cooling in a magnetic field of 0.1 T are shown in Fig. 2. The distributions were obtained from the measured by using the fast Fourier transform procedure based on the maximum entropy algorithm.Rainford94 In the normal state, a symmetric line at the position of the external magnetic field with a broadening arising from the nuclear magnetic moments is seen. Below the field distribution is broadened and asymmetric. In order to account for the asymmetric field distribution, SR time spectra obtained below were fitted by two Gaussian lines:Serventi04 ; Khasanov05
| (3) |
where , , and are the asymmetry, the Gaussian relaxation rate, and the first moment of the -th line, respectively. At , the analysis is simplified to a single line with MHz arising from the nuclear moments of the sample. Eq. (3) is equivalent to the field distribution Khasanov05
| (4) |
The solid lines in Figs. 2 (a) represent the best fit with the one (upper panel) and two Gaussian lines (lower panel) to the SR time spectra. The corresponding lines are shown in Figs. 2 (c). For this distribution the mean field and the second moment are Khasanov05
| (5) |
and
| (6) |
The superconducting part of the square root of the second moment was then obtained by subtracting the contribution of nuclear moments measured at as . From the known value of the absolute value of can be evaluated using the following relation
| (7) |
which describes the field variation of for an ideal triangular vortex lattice.Brandt03 Note, that according to Ref. Brandt03, , Eq. (7) does not hold for very low magnetic inductions .
III Experimental Results and Discussion
III.1 Temperature dependence of the upper critical field
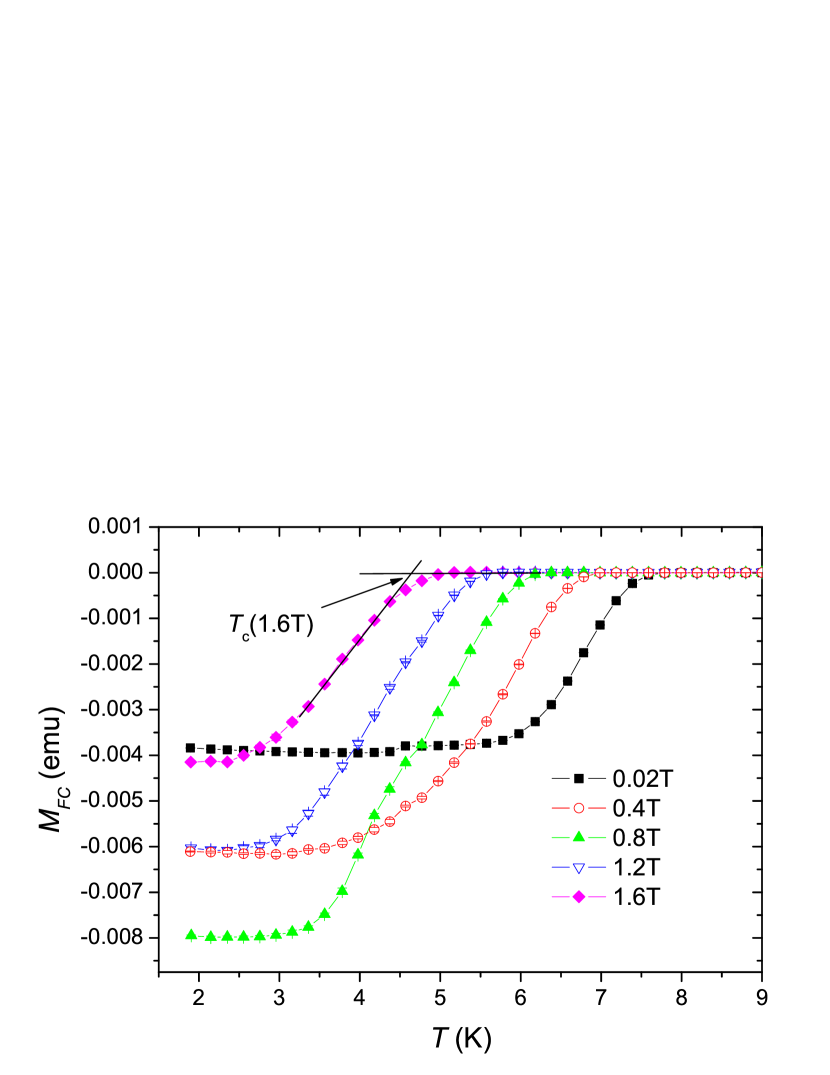
The field-cooled magnetization curves for several magnetic fields are shown in Fig. 3. The transition temperature was taken from the linearly extrapolated curves in the vicinity of with line. For each particular field the corresponding transition temperature was taken as the temperature where . The resulting dependence is presented in Fig. 4.
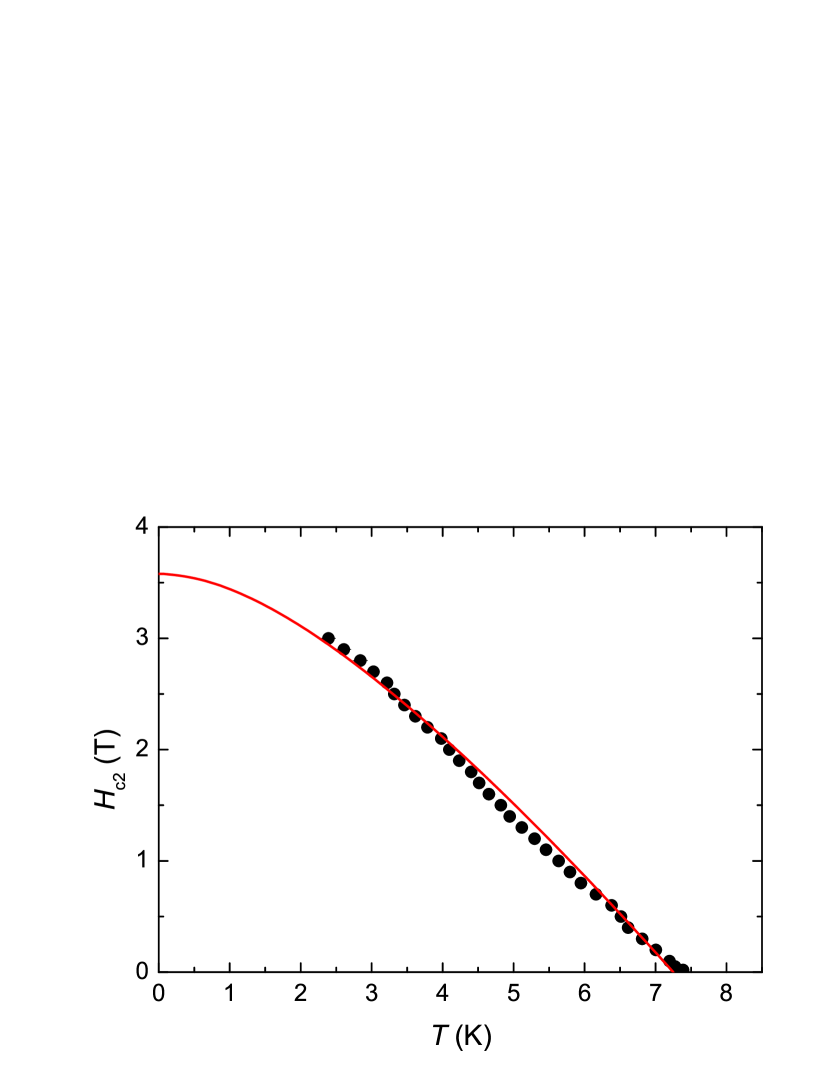
It is seen that data can be satisfactory fitted with the model provided by the Werthamer-Helfand-Hohenberg (WHH) theory.Werthamer66 The fit yields T and K. Note, that the value of the transition temperature obtained from the fit lies between and introduced in Fig. 1, i.e., it is in agreement with low-field magnetization measurements. In the following, the curve presented in Fig. 4 is used to analyze the SR data (see Sec. III.3).
To summarize, the temperature dependence of the second critical field can be well described within the WHH theory. The absolute value of the second critical field at was found to be 3.58(10) T in agreement with results of Badica et al. Ref. Badica04, .
III.2 Magnetic field dependence of the second moment of SR line
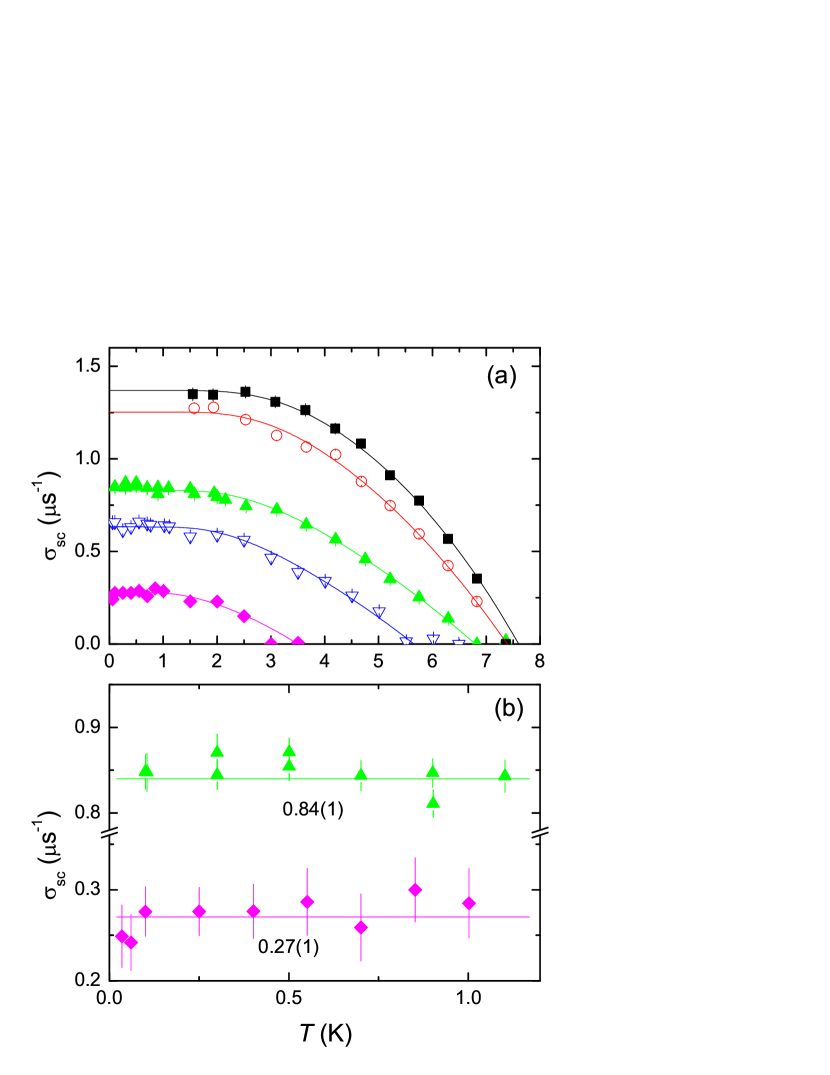
In Fig. 5 (a) the temperature dependences of for T, 0.1 T, 0.5 T, 1 T, and 2.3 T are shown. For 0.5, 1 T, and 2.3 T, was measured down to 30 mK. It is seen, that below 1.5 K is practically temperature independent [Fig. 5(b)]. Bearing in mind, that the temperature dependence of saturates at low temperatures, the values of can be reliably evaluated for all magnetic fields. The results are plotted in Fig. 6 as a function of . For T, 1.0 T, and 2.3 T was obtained from the zero slope linear fit of the K data [see Fig. 5(b)] and for T and 0.1 T was assumed to be equal to at the lowest measured temperature ( K). The solid line in Fig. 6 represents the result of the fit of Eq. (7) to the experimental data with T and nm.
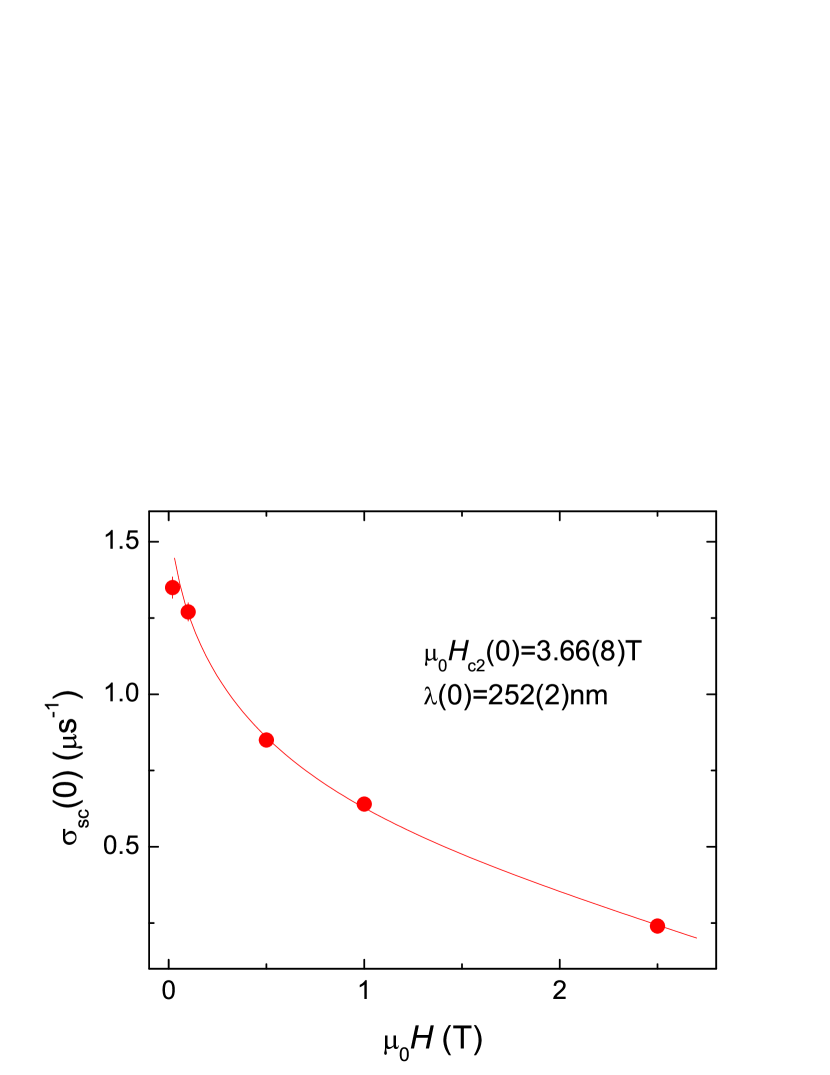
As it was already mentioned above, Eq. (7) does not hold for the very low magnetic field. For this reason the data point for T was excluded from the fit. It is seen (Fig. 6), that the theoretical curve perfectly matches all data points for T. The value of for T lies slightly below the theoretical curve, as expected. It is important to emphasize that the value of T obtained from the fit of data coincides within the error with T, evaluated in the previous section from the directly measured . This good agreement between the values of , obtained from the two completely different experiments, clearly demonstrates the validity of our analysis.
The above presented experiments clearly demonstrate, that , evaluated from SR measurements, is indeed magnetic field independent, as one would expect in case of a conventional superconductor with isotropic energy gap.Kadono04 On the other hand, in superconductors with nodes in the gap and isotropic double-gap superconductors like MgB2, , evaluated in the same way, increases with increasing magnetic field (see e.g., Refs. Serventi04, , Kadono04, , and Sonier00, ). Thus, the fact, that the versus dependence is perfectly described by the field independent (see Fig. 6), implies that Li2Pd3B is a conventional single-gap superconductor.
The zero–temperature value of the superconducting coherence length may be estimated from as , which results in nm ( is the magnetic flux quantum). Using the values of and , one can also evaluate the zero-temperature value of the Ginzburg-Landau parameter . The value of the first critical field can also be calculated by means of Eq. (4) from Ref. Brandt03, as mT. It is remarkable that all superconducting characteristics of Li2Pd3B could be obtained solely from SR experiments.
To summarize, the magnetic field dependence of the superconducting part of the SR depolarization rate is well described within the Ginzburg-Landau theory for anisotropic single-gap superconductors. The zero-temperature values of the first and the second critical fields, the magnetic penetration depth, the coherence length, and the Ginzburg-Landau parameter were found to be T, mT, nm, nm, and , respectively.
III.3 Temperature dependence of
Eq. (7) implies that depends on and the reduced magnetic field . It is also clear that vanishes for . This means, that in order to obtain the temperature dependence of from the curves, the temperature dependence of must be taken into account. In our calculations, the curve provided by the solid line in Fig. 4 was used. Due to the known value of , we are not limited by Eq. (7) but can directly apply the numerical calculations of Brandt.Brandt03 In this case, the results collected in the lowest magnetic field ( T) can also be used. The resulting temperature dependence of is shown in the Fig. 7. Remarkably, all points, reconstructed from measured in various magnetic fields, collapse onto a single curve. One should emphasize, that in this reconstruction no adjustable parameter was used. The dependences were obtained by means of SR, while the curve was measured in a completely different set of magnetization experiments (see Sec. III.1).
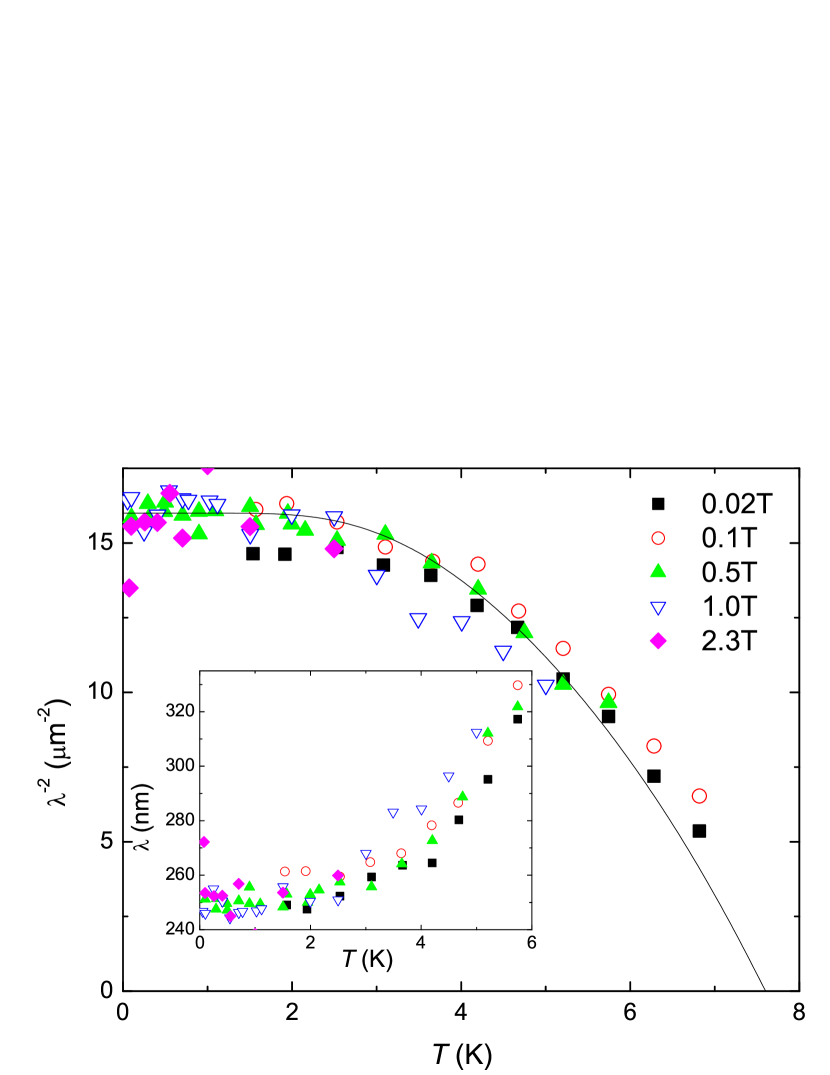
Considering the temperature dependence of , one should note, that it can be better described by the BCS theory for a moderate coupling with the zero-temperature energy gap [ meV] rather than for the weak coupling limit. This is in agreement with the value obtained recently from specific-heat measurements.Takeya05 The upward deviations of the experimental data-points from the theoretical curve at higher temperatures (see Fig. 7) is expected for nonuniform samples (e.g. for the samples where the transition temperatures are distributed via a certain range ). At temperatures close to . Assuming that the critical temperature varies throughout the sample from to , then the relative variation of for is proportional to , i.e., it increases with increasing temperature. The value of , resulting from SR experiments in the case of nonuniform samples, may be written as ( is the local value of in the unit volume and is the sample volume). Taking into account that this averaging implies that the parts of the sample with the smallest values of (the highest values of ) provide the main contribution to . At lower temperatures, however, become more uniform throughout the sample and can be used for reliable calculations of .
Recently, Yuan et al. studied the magnetic field penetration depth in Li2Pd3B by means of self-inductance technique.Yuan05 ; Yuan05a It was obtained that a considerable increase of starts already at temperatures well below 1 K. Since such a behavior contradicts conventional BCS theory, the authors assumed the presence of the second superconducting gap. Our results (see Fig. 7) are quite different. , evaluated from SR measurements, is practically temperature independent below 2 K in complete agreement with conventional single-gap theories of superconductivity. We argue that the most probable reason for the above mentioned disagreement in the dependence comes from the difference in the experimental techniques. The self-inductance technique used in Refs. Yuan05, and Yuan05a, provides information about the properties of the surface of the sample. It is likely that in this Li-containing compound the properties of the surface layer of the sample are different from those of the bulk.
To summarize, in the whole temperature range (from down to 30 mK) the temperature dependence of is consistent with what is expected for a single-gap s–wave BCS superconductor. The value of the superconducting gap was found to be meV, that corresponds to the ratio .
IV Conclusions
Muon-spin rotation and magnetization studies were performed on the ternary boride superconductor Li2Pd3B ( K). The main results are: (i) The absolute values of , , , , and at zero temperature obtained from SR are: nm, nm, , mT, and T. (ii) The values of evaluated from SR and magnetization measurements coincide within the experimental accuracy. (iii) Over the whole temperature range (from down to 30 mK) the temperature dependence of is consistent with what is expected for a single-gap s–wave BCS superconductor. (iv) No influence of the applied magnetic field to was observed. (v) At , the magnetic field dependence of is in agreement with what is expected for a superconductor with an isotropic energy gap.
To conclude, all the above mentioned features suggest that Li2Pd3B is a BCS superconductor with an isotropic energy gap.
V Acknowledgments
This work was partly performed at the Swiss Muon Source (SS), Paul Scherrer Institute (PSI, Switzerland). The authors are grateful to S. Strässle for help during manuscript preparation. This work was supported by the Swiss National Science Foundation.
References
- (1) K. Togano, P. Badica, Y. Nakamori, S. Orimo, H. Takeya, and K. Hirata, Phys. Rev. Lett. 93, 247004 (2004).
- (2) P. Badica, T. Kondo, T. Kudo, Y. Nakamori, S. Orimo, and K. Togano, Appl. Phys. Lett, 85, 4433 (2004).
- (3) T. Yokoya, T. Muro, I. Hase, H. Takeya, K. Hirata, and K. Togano, Phys. Rev. B 71, 092507 (2005).
- (4) M. Nishiyama, Y. Inada, and Guo-qing Zheng, Phys. Rev. B 71, 220505(R) (2005).
- (5) H.Q. Yuan, D. Vandervelde, M.B. Salamon, P. Badica, and K. Togano, cond-mat/0506771 (unpublished).
- (6) H. Takeya, K. Hirata, K. Yamaura, K. Togano, M.El Massalami, R. Rapp, F.A. Chaves, and B. Ouladdiaf, Phys. Rev. B 72, 104506 (2005).
- (7) H.Q. Yuan, D.F. Agterberg, N. Hayashi, P. Badica, D. Vandervelde, K. Togano, M. Sigrist, M.B. Salamon, cond-mat/0512601 (unpublished).
- (8) P. Zimmermann, H. Keller, S. L. Lee, I. M. Savic, M. Warden, D. Zech, R. Cubitt, E. M. Forgan, E. Kaldis, J. Karpinski, and C. Krüger, Phys. Rev. B 52, 541 (1995).
- (9) E.H. Brandt, Phys. Rev. B 37, 2349 (1988).
- (10) E.H. Brandt, Phys. Rev. B 68, 054506 (2003).
- (11) A. Schenck, Muon Spin Rotation: Principles and Applications in Solid State Physics, (Adam Hilger, Bristol, 1986); S.F.J. Cox, J. Phys. C20, 3187 (1987); J.H. Brewer, “Muon Spin Rotation/Relaxation/Resonance” in Encyclopedia of Applied Physics Vol. 11, p. 23 (VCH, New York, 1995).
- (12) B.D. Rainford and G.J. Daniell, Hyperfine Interact. 87, 1129 (1994).
- (13) S. Serventi, G. Allodi, R.De Renzi, G. Guidi, L. Romano, P. Manfrinetti, A. Palenzona, Ch. Niedermayer, A. Amato, and Ch. Baines, Phys. Rev. Lett. 93, 217003 (2004).
- (14) R. Khasanov, D.G. Eshchenko, D.Di Castro, A. Shengelaya, F.La Mattina, A. Maisuradze, C. Baines, H. Luetkens, J. Karpinski, S.M. Kazakov, and H. Keller, Phys. Rev. B 72, 104504 (2005).
- (15) E. Helfand and N.R. Werthamer, Phys. Rev. 147, 288 (1966); N.R. Werthamer, E. Helfand, and P.C. Hohenberg, ibid 147, 295 (1966).
- (16) R. Kadono, J.Phys.: Cond. Mat. 16, S4421 (2004).
- (17) J. Sonier, J. Brewer, and R. Kiefl, Rew. Mod. Phys. 72, 769 (2000).